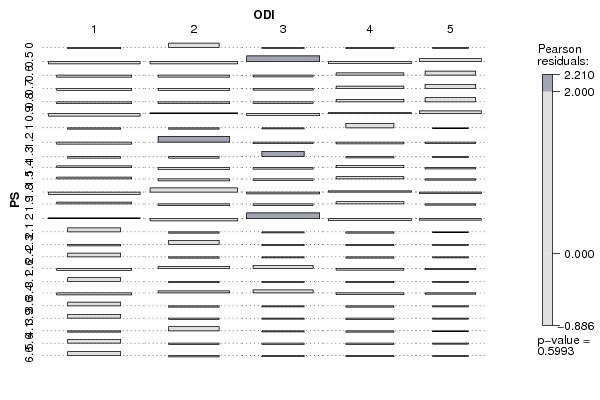
| Tabulation of Results | |||||
| PS x ODI | |||||
| 1 | 2 | 3 | 4 | 5 | 0 | 0 | 1 | 0 | 0 | 0 | 0.5 | 0 | 0 | 2 | 0 | 1 | 0.6 | 0 | 0 | 0 | 1 | 1 | 0.7 | 0 | 0 | 0 | 1 | 1 | 0.8 | 0 | 0 | 0 | 1 | 1 | 0.9 | 0 | 1 | 0 | 1 | 1 | 1 | 0 | 0 | 0 | 1 | 0 | 1.2 | 0 | 2 | 0 | 0 | 0 | 1.3 | 0 | 0 | 1 | 0 | 0 | 1.4 | 1 | 0 | 0 | 1 | 0 | 1.5 | 1 | 0 | 0 | 1 | 0 | 1.8 | 0 | 2 | 0 | 1 | 0 | 1.9 | 1 | 0 | 0 | 1 | 0 | 2 | 1 | 0 | 2 | 0 | 0 | 2.1 | 1 | 0 | 0 | 0 | 0 | 2.3 | 0 | 1 | 0 | 0 | 0 | 2.4 | 1 | 0 | 0 | 0 | 0 | 2.6 | 0 | 1 | 1 | 0 | 0 | 3.1 | 1 | 0 | 0 | 0 | 0 | 3.4 | 0 | 1 | 1 | 0 | 0 | 3.6 | 1 | 0 | 0 | 0 | 0 | 3.9 | 1 | 0 | 0 | 0 | 0 | 4.1 | 0 | 1 | 0 | 0 | 0 | 5.6 | 1 | 0 | 0 | 0 | 0 | 6.6 | 1 | 0 | 0 | 0 | 0 |
| Tabulation of Expected Results | |||||
| PS x ODI | |||||
| 1 | 2 | 3 | 4 | 5 | 0 | 0.26 | 0.24 | 0.17 | 0.21 | 0.12 | 0.5 | 0.79 | 0.71 | 0.5 | 0.64 | 0.36 | 0.6 | 0.52 | 0.48 | 0.33 | 0.43 | 0.24 | 0.7 | 0.52 | 0.48 | 0.33 | 0.43 | 0.24 | 0.8 | 0.52 | 0.48 | 0.33 | 0.43 | 0.24 | 0.9 | 0.79 | 0.71 | 0.5 | 0.64 | 0.36 | 1 | 0.26 | 0.24 | 0.17 | 0.21 | 0.12 | 1.2 | 0.52 | 0.48 | 0.33 | 0.43 | 0.24 | 1.3 | 0.26 | 0.24 | 0.17 | 0.21 | 0.12 | 1.4 | 0.52 | 0.48 | 0.33 | 0.43 | 0.24 | 1.5 | 0.52 | 0.48 | 0.33 | 0.43 | 0.24 | 1.8 | 0.79 | 0.71 | 0.5 | 0.64 | 0.36 | 1.9 | 0.52 | 0.48 | 0.33 | 0.43 | 0.24 | 2 | 0.79 | 0.71 | 0.5 | 0.64 | 0.36 | 2.1 | 0.26 | 0.24 | 0.17 | 0.21 | 0.12 | 2.3 | 0.26 | 0.24 | 0.17 | 0.21 | 0.12 | 2.4 | 0.26 | 0.24 | 0.17 | 0.21 | 0.12 | 2.6 | 0.52 | 0.48 | 0.33 | 0.43 | 0.24 | 3.1 | 0.26 | 0.24 | 0.17 | 0.21 | 0.12 | 3.4 | 0.52 | 0.48 | 0.33 | 0.43 | 0.24 | 3.6 | 0.26 | 0.24 | 0.17 | 0.21 | 0.12 | 3.9 | 0.26 | 0.24 | 0.17 | 0.21 | 0.12 | 4.1 | 0.26 | 0.24 | 0.17 | 0.21 | 0.12 | 5.6 | 0.26 | 0.24 | 0.17 | 0.21 | 0.12 | 6.6 | 0.26 | 0.24 | 0.17 | 0.21 | 0.12 |
| Statistical Results | |
| Pearson's Chi-squared test | |
| Chi Square Statistic | 91.91 |
| Degrees of Freedom | 96 |
| P value | 0.6 |