Free Statistics

of Irreproducible Research!

Author's title

Author*The author of this computation has been verified*
R Software Modulerwasp_autocorrelation.wasp
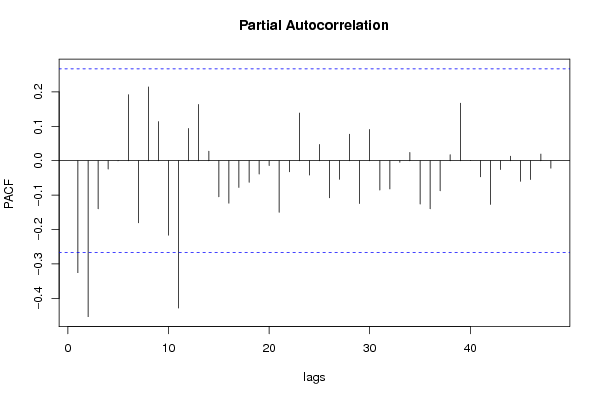
Title produced by software(Partial) Autocorrelation Function
Date of computationTue, 14 Dec 2010 08:26:44 +0000
Cite this page as followsStatistical Computations at FreeStatistics.org, Office for Research Development and Education, URL https://freestatistics.org/blog/index.php?v=date/2010/Dec/14/t1292315084vb80gmf1chdosr7.htm/, Retrieved Thu, 02 May 2024 13:57:45 +0000
Statistical Computations at FreeStatistics.org, Office for Research Development and Education, URL https://freestatistics.org/blog/index.php?pk=109251, Retrieved Thu, 02 May 2024 13:57:45 +0000
QR Codes:

Original text written by user:
IsPrivate?No (this computation is public)
User-defined keywords
Estimated Impact150
Family? (F = Feedback message, R = changed R code, M = changed R Module, P = changed Parameters, D = changed Data)
F     [(Partial) Autocorrelation Function] [WS9] [2010-12-08 16:30:25] [ebb35fb07def4d07c0eb7ec8d2fd3b0e]
-   P     [(Partial) Autocorrelation Function] [ws 10 verbetering] [2010-12-14 08:26:44] [60147a93d53c93401a082f47876e6cb5] [Current]
Feedback Forum

Post a new message
Dataseries X:
16198.9
16554.2
19554.2
15903.8
18003.8
18329.6
16260.7
14851.9
18174.1
18406.6
18466.5
16016.5
17428.5
17167.2
19630
17183.6
18344.7
19301.4
18147.5
16192.9
18374.4
20515.2
18957.2
16471.5
18746.8
19009.5
19211.2
20547.7
19325.8
20605.5
20056.9
16141.4
20359.8
19711.6
15638.6
14384.5
13855.6
14308.3
15290.6
14423.8
13779.7
15686.3
14733.8
12522.5
16189.4
16059.1
16007.1
15806.8
15160
15692.1
18908.9
16969.9
16997.5
19858.9
17681.2


Summary of computational transaction
Raw Inputview raw input (R code)
Raw Outputview raw output of R engine
Computing time2 seconds
R Server'RServer@AstonUniversity' @ vre.aston.ac.uk

\begin{tabular}{lllllllll}
\hline
Summary of computational transaction \tabularnewline
Raw Input & view raw input (R code)  \tabularnewline
Raw Output & view raw output of R engine  \tabularnewline
Computing time & 2 seconds \tabularnewline
R Server & 'RServer@AstonUniversity' @ vre.aston.ac.uk \tabularnewline
\hline
\end{tabular}
%Source: https://freestatistics.org/blog/index.php?pk=109251&T=0

[TABLE]
[ROW][C]Summary of computational transaction[/C][/ROW]
[ROW][C]Raw Input[/C][C]view raw input (R code) [/C][/ROW]
[ROW][C]Raw Output[/C][C]view raw output of R engine [/C][/ROW]
[ROW][C]Computing time[/C][C]2 seconds[/C][/ROW]
[ROW][C]R Server[/C][C]'RServer@AstonUniversity' @ vre.aston.ac.uk[/C][/ROW]
[/TABLE]
Source: https://freestatistics.org/blog/index.php?pk=109251&T=0

Globally Unique Identifier (entire table): ba.freestatistics.org/blog/index.php?pk=109251&T=0

As an alternative you can also use a QR Code:  

The GUIDs for individual cells are displayed in the table below:

Summary of computational transaction
Raw Inputview raw input (R code)
Raw Outputview raw output of R engine
Computing time2 seconds
R Server'RServer@AstonUniversity' @ vre.aston.ac.uk


Autocorrelation Function
Time lag kACF(k)T-STATP-value
1-0.325215-2.38980.010188
2-0.29941-2.20020.016045
30.1894821.39240.084754
40.0823930.60550.273704
5-0.091794-0.67450.25142
60.1178790.86620.195099
7-0.224925-1.65290.052082
80.2391741.75760.042245
90.0538150.39550.347031
10-0.351998-2.58660.00621
11-0.085387-0.62750.266499
120.5016713.68650.000264
13-0.156633-1.1510.1274
14-0.214992-1.57990.059989
150.0260940.19180.424329
160.0776260.57040.285376
17-0.007465-0.05490.478227
18-0.012191-0.08960.464474
19-0.136915-1.00610.159424
200.2204051.61960.055568
21-0.038796-0.28510.388333
22-0.211882-1.5570.062655
230.0531870.39080.348726
240.1801491.32380.09557
250.0229870.16890.433244
26-0.158241-1.16280.125006
27-0.054915-0.40350.344071
280.1880811.38210.086315
29-0.08112-0.59610.276798
300.0111220.08170.467582
31-0.031963-0.23490.407596
320.0439480.3230.373989
330.0293250.21550.415097
34-0.087247-0.64110.262074
35-0.104456-0.76760.223037
360.1949461.43260.078874
370.0022990.01690.493291
38-0.123786-0.90960.183528
390.0327420.24060.405387
400.0516160.37930.352977
41-0.060667-0.44580.328758
420.0543260.39920.345657
43-0.030297-0.22260.412329
44-0.019724-0.14490.442649
450.0817520.60080.275259
46-0.04505-0.33110.370944
47-0.08428-0.61930.269153
480.1088650.80.213611

\begin{tabular}{lllllllll}
\hline
Autocorrelation Function \tabularnewline
Time lag k & ACF(k) & T-STAT & P-value \tabularnewline
1 & -0.325215 & -2.3898 & 0.010188 \tabularnewline
2 & -0.29941 & -2.2002 & 0.016045 \tabularnewline
3 & 0.189482 & 1.3924 & 0.084754 \tabularnewline
4 & 0.082393 & 0.6055 & 0.273704 \tabularnewline
5 & -0.091794 & -0.6745 & 0.25142 \tabularnewline
6 & 0.117879 & 0.8662 & 0.195099 \tabularnewline
7 & -0.224925 & -1.6529 & 0.052082 \tabularnewline
8 & 0.239174 & 1.7576 & 0.042245 \tabularnewline
9 & 0.053815 & 0.3955 & 0.347031 \tabularnewline
10 & -0.351998 & -2.5866 & 0.00621 \tabularnewline
11 & -0.085387 & -0.6275 & 0.266499 \tabularnewline
12 & 0.501671 & 3.6865 & 0.000264 \tabularnewline
13 & -0.156633 & -1.151 & 0.1274 \tabularnewline
14 & -0.214992 & -1.5799 & 0.059989 \tabularnewline
15 & 0.026094 & 0.1918 & 0.424329 \tabularnewline
16 & 0.077626 & 0.5704 & 0.285376 \tabularnewline
17 & -0.007465 & -0.0549 & 0.478227 \tabularnewline
18 & -0.012191 & -0.0896 & 0.464474 \tabularnewline
19 & -0.136915 & -1.0061 & 0.159424 \tabularnewline
20 & 0.220405 & 1.6196 & 0.055568 \tabularnewline
21 & -0.038796 & -0.2851 & 0.388333 \tabularnewline
22 & -0.211882 & -1.557 & 0.062655 \tabularnewline
23 & 0.053187 & 0.3908 & 0.348726 \tabularnewline
24 & 0.180149 & 1.3238 & 0.09557 \tabularnewline
25 & 0.022987 & 0.1689 & 0.433244 \tabularnewline
26 & -0.158241 & -1.1628 & 0.125006 \tabularnewline
27 & -0.054915 & -0.4035 & 0.344071 \tabularnewline
28 & 0.188081 & 1.3821 & 0.086315 \tabularnewline
29 & -0.08112 & -0.5961 & 0.276798 \tabularnewline
30 & 0.011122 & 0.0817 & 0.467582 \tabularnewline
31 & -0.031963 & -0.2349 & 0.407596 \tabularnewline
32 & 0.043948 & 0.323 & 0.373989 \tabularnewline
33 & 0.029325 & 0.2155 & 0.415097 \tabularnewline
34 & -0.087247 & -0.6411 & 0.262074 \tabularnewline
35 & -0.104456 & -0.7676 & 0.223037 \tabularnewline
36 & 0.194946 & 1.4326 & 0.078874 \tabularnewline
37 & 0.002299 & 0.0169 & 0.493291 \tabularnewline
38 & -0.123786 & -0.9096 & 0.183528 \tabularnewline
39 & 0.032742 & 0.2406 & 0.405387 \tabularnewline
40 & 0.051616 & 0.3793 & 0.352977 \tabularnewline
41 & -0.060667 & -0.4458 & 0.328758 \tabularnewline
42 & 0.054326 & 0.3992 & 0.345657 \tabularnewline
43 & -0.030297 & -0.2226 & 0.412329 \tabularnewline
44 & -0.019724 & -0.1449 & 0.442649 \tabularnewline
45 & 0.081752 & 0.6008 & 0.275259 \tabularnewline
46 & -0.04505 & -0.3311 & 0.370944 \tabularnewline
47 & -0.08428 & -0.6193 & 0.269153 \tabularnewline
48 & 0.108865 & 0.8 & 0.213611 \tabularnewline
\hline
\end{tabular}
%Source: https://freestatistics.org/blog/index.php?pk=109251&T=1

[TABLE]
[ROW][C]Autocorrelation Function[/C][/ROW]
[ROW][C]Time lag k[/C][C]ACF(k)[/C][C]T-STAT[/C][C]P-value[/C][/ROW]
[ROW][C]1[/C][C]-0.325215[/C][C]-2.3898[/C][C]0.010188[/C][/ROW]
[ROW][C]2[/C][C]-0.29941[/C][C]-2.2002[/C][C]0.016045[/C][/ROW]
[ROW][C]3[/C][C]0.189482[/C][C]1.3924[/C][C]0.084754[/C][/ROW]
[ROW][C]4[/C][C]0.082393[/C][C]0.6055[/C][C]0.273704[/C][/ROW]
[ROW][C]5[/C][C]-0.091794[/C][C]-0.6745[/C][C]0.25142[/C][/ROW]
[ROW][C]6[/C][C]0.117879[/C][C]0.8662[/C][C]0.195099[/C][/ROW]
[ROW][C]7[/C][C]-0.224925[/C][C]-1.6529[/C][C]0.052082[/C][/ROW]
[ROW][C]8[/C][C]0.239174[/C][C]1.7576[/C][C]0.042245[/C][/ROW]
[ROW][C]9[/C][C]0.053815[/C][C]0.3955[/C][C]0.347031[/C][/ROW]
[ROW][C]10[/C][C]-0.351998[/C][C]-2.5866[/C][C]0.00621[/C][/ROW]
[ROW][C]11[/C][C]-0.085387[/C][C]-0.6275[/C][C]0.266499[/C][/ROW]
[ROW][C]12[/C][C]0.501671[/C][C]3.6865[/C][C]0.000264[/C][/ROW]
[ROW][C]13[/C][C]-0.156633[/C][C]-1.151[/C][C]0.1274[/C][/ROW]
[ROW][C]14[/C][C]-0.214992[/C][C]-1.5799[/C][C]0.059989[/C][/ROW]
[ROW][C]15[/C][C]0.026094[/C][C]0.1918[/C][C]0.424329[/C][/ROW]
[ROW][C]16[/C][C]0.077626[/C][C]0.5704[/C][C]0.285376[/C][/ROW]
[ROW][C]17[/C][C]-0.007465[/C][C]-0.0549[/C][C]0.478227[/C][/ROW]
[ROW][C]18[/C][C]-0.012191[/C][C]-0.0896[/C][C]0.464474[/C][/ROW]
[ROW][C]19[/C][C]-0.136915[/C][C]-1.0061[/C][C]0.159424[/C][/ROW]
[ROW][C]20[/C][C]0.220405[/C][C]1.6196[/C][C]0.055568[/C][/ROW]
[ROW][C]21[/C][C]-0.038796[/C][C]-0.2851[/C][C]0.388333[/C][/ROW]
[ROW][C]22[/C][C]-0.211882[/C][C]-1.557[/C][C]0.062655[/C][/ROW]
[ROW][C]23[/C][C]0.053187[/C][C]0.3908[/C][C]0.348726[/C][/ROW]
[ROW][C]24[/C][C]0.180149[/C][C]1.3238[/C][C]0.09557[/C][/ROW]
[ROW][C]25[/C][C]0.022987[/C][C]0.1689[/C][C]0.433244[/C][/ROW]
[ROW][C]26[/C][C]-0.158241[/C][C]-1.1628[/C][C]0.125006[/C][/ROW]
[ROW][C]27[/C][C]-0.054915[/C][C]-0.4035[/C][C]0.344071[/C][/ROW]
[ROW][C]28[/C][C]0.188081[/C][C]1.3821[/C][C]0.086315[/C][/ROW]
[ROW][C]29[/C][C]-0.08112[/C][C]-0.5961[/C][C]0.276798[/C][/ROW]
[ROW][C]30[/C][C]0.011122[/C][C]0.0817[/C][C]0.467582[/C][/ROW]
[ROW][C]31[/C][C]-0.031963[/C][C]-0.2349[/C][C]0.407596[/C][/ROW]
[ROW][C]32[/C][C]0.043948[/C][C]0.323[/C][C]0.373989[/C][/ROW]
[ROW][C]33[/C][C]0.029325[/C][C]0.2155[/C][C]0.415097[/C][/ROW]
[ROW][C]34[/C][C]-0.087247[/C][C]-0.6411[/C][C]0.262074[/C][/ROW]
[ROW][C]35[/C][C]-0.104456[/C][C]-0.7676[/C][C]0.223037[/C][/ROW]
[ROW][C]36[/C][C]0.194946[/C][C]1.4326[/C][C]0.078874[/C][/ROW]
[ROW][C]37[/C][C]0.002299[/C][C]0.0169[/C][C]0.493291[/C][/ROW]
[ROW][C]38[/C][C]-0.123786[/C][C]-0.9096[/C][C]0.183528[/C][/ROW]
[ROW][C]39[/C][C]0.032742[/C][C]0.2406[/C][C]0.405387[/C][/ROW]
[ROW][C]40[/C][C]0.051616[/C][C]0.3793[/C][C]0.352977[/C][/ROW]
[ROW][C]41[/C][C]-0.060667[/C][C]-0.4458[/C][C]0.328758[/C][/ROW]
[ROW][C]42[/C][C]0.054326[/C][C]0.3992[/C][C]0.345657[/C][/ROW]
[ROW][C]43[/C][C]-0.030297[/C][C]-0.2226[/C][C]0.412329[/C][/ROW]
[ROW][C]44[/C][C]-0.019724[/C][C]-0.1449[/C][C]0.442649[/C][/ROW]
[ROW][C]45[/C][C]0.081752[/C][C]0.6008[/C][C]0.275259[/C][/ROW]
[ROW][C]46[/C][C]-0.04505[/C][C]-0.3311[/C][C]0.370944[/C][/ROW]
[ROW][C]47[/C][C]-0.08428[/C][C]-0.6193[/C][C]0.269153[/C][/ROW]
[ROW][C]48[/C][C]0.108865[/C][C]0.8[/C][C]0.213611[/C][/ROW]
[/TABLE]
Source: https://freestatistics.org/blog/index.php?pk=109251&T=1

Globally Unique Identifier (entire table): ba.freestatistics.org/blog/index.php?pk=109251&T=1

As an alternative you can also use a QR Code:  

The GUIDs for individual cells are displayed in the table below:

Autocorrelation Function
Time lag kACF(k)T-STATP-value
1-0.325215-2.38980.010188
2-0.29941-2.20020.016045
30.1894821.39240.084754
40.0823930.60550.273704
5-0.091794-0.67450.25142
60.1178790.86620.195099
7-0.224925-1.65290.052082
80.2391741.75760.042245
90.0538150.39550.347031
10-0.351998-2.58660.00621
11-0.085387-0.62750.266499
120.5016713.68650.000264
13-0.156633-1.1510.1274
14-0.214992-1.57990.059989
150.0260940.19180.424329
160.0776260.57040.285376
17-0.007465-0.05490.478227
18-0.012191-0.08960.464474
19-0.136915-1.00610.159424
200.2204051.61960.055568
21-0.038796-0.28510.388333
22-0.211882-1.5570.062655
230.0531870.39080.348726
240.1801491.32380.09557
250.0229870.16890.433244
26-0.158241-1.16280.125006
27-0.054915-0.40350.344071
280.1880811.38210.086315
29-0.08112-0.59610.276798
300.0111220.08170.467582
31-0.031963-0.23490.407596
320.0439480.3230.373989
330.0293250.21550.415097
34-0.087247-0.64110.262074
35-0.104456-0.76760.223037
360.1949461.43260.078874
370.0022990.01690.493291
38-0.123786-0.90960.183528
390.0327420.24060.405387
400.0516160.37930.352977
41-0.060667-0.44580.328758
420.0543260.39920.345657
43-0.030297-0.22260.412329
44-0.019724-0.14490.442649
450.0817520.60080.275259
46-0.04505-0.33110.370944
47-0.08428-0.61930.269153
480.1088650.80.213611


Partial Autocorrelation Function
Time lag kPACF(k)T-STATP-value
1-0.325215-2.38980.010188
2-0.453097-3.32960.000786
3-0.13982-1.02750.154391
4-0.024364-0.1790.429288
5-0.000407-0.0030.498812
60.1920161.4110.081987
7-0.180294-1.32490.095394
80.2145331.57650.060377
90.1136990.83550.203556
10-0.216216-1.58890.058966
11-0.427999-3.14510.001349
120.0935460.68740.247379
130.163571.2020.117307
140.0277390.20380.419622
15-0.104953-0.77120.221962
16-0.123194-0.90530.184667
17-0.077558-0.56990.285543
18-0.06239-0.45850.324228
19-0.038541-0.28320.389046
20-0.013736-0.10090.459987
21-0.149934-1.10180.13772
22-0.032091-0.23580.407234
230.1384091.01710.156823
24-0.041384-0.30410.381107
250.0471910.34680.365053
26-0.107889-0.79280.215675
27-0.053841-0.39570.346961
280.0769170.56520.287131
29-0.124304-0.91340.182535
300.0908030.66730.253723
31-0.085078-0.62520.267239
32-0.081856-0.60150.275006
33-0.004634-0.03410.48648
340.0238210.1750.430849
35-0.125984-0.92580.179338
36-0.139408-1.02440.155098
37-0.087076-0.63990.26248
380.0176450.12970.448657
390.167091.22790.112414
400.0005690.00420.498339
41-0.046653-0.34280.36653
42-0.126904-0.93250.177603
43-0.025761-0.18930.425283
440.0133720.09830.461043
45-0.059733-0.43890.331225
46-0.054533-0.40070.345097
470.0193350.14210.443773
48-0.021519-0.15810.437471

\begin{tabular}{lllllllll}
\hline
Partial Autocorrelation Function \tabularnewline
Time lag k & PACF(k) & T-STAT & P-value \tabularnewline
1 & -0.325215 & -2.3898 & 0.010188 \tabularnewline
2 & -0.453097 & -3.3296 & 0.000786 \tabularnewline
3 & -0.13982 & -1.0275 & 0.154391 \tabularnewline
4 & -0.024364 & -0.179 & 0.429288 \tabularnewline
5 & -0.000407 & -0.003 & 0.498812 \tabularnewline
6 & 0.192016 & 1.411 & 0.081987 \tabularnewline
7 & -0.180294 & -1.3249 & 0.095394 \tabularnewline
8 & 0.214533 & 1.5765 & 0.060377 \tabularnewline
9 & 0.113699 & 0.8355 & 0.203556 \tabularnewline
10 & -0.216216 & -1.5889 & 0.058966 \tabularnewline
11 & -0.427999 & -3.1451 & 0.001349 \tabularnewline
12 & 0.093546 & 0.6874 & 0.247379 \tabularnewline
13 & 0.16357 & 1.202 & 0.117307 \tabularnewline
14 & 0.027739 & 0.2038 & 0.419622 \tabularnewline
15 & -0.104953 & -0.7712 & 0.221962 \tabularnewline
16 & -0.123194 & -0.9053 & 0.184667 \tabularnewline
17 & -0.077558 & -0.5699 & 0.285543 \tabularnewline
18 & -0.06239 & -0.4585 & 0.324228 \tabularnewline
19 & -0.038541 & -0.2832 & 0.389046 \tabularnewline
20 & -0.013736 & -0.1009 & 0.459987 \tabularnewline
21 & -0.149934 & -1.1018 & 0.13772 \tabularnewline
22 & -0.032091 & -0.2358 & 0.407234 \tabularnewline
23 & 0.138409 & 1.0171 & 0.156823 \tabularnewline
24 & -0.041384 & -0.3041 & 0.381107 \tabularnewline
25 & 0.047191 & 0.3468 & 0.365053 \tabularnewline
26 & -0.107889 & -0.7928 & 0.215675 \tabularnewline
27 & -0.053841 & -0.3957 & 0.346961 \tabularnewline
28 & 0.076917 & 0.5652 & 0.287131 \tabularnewline
29 & -0.124304 & -0.9134 & 0.182535 \tabularnewline
30 & 0.090803 & 0.6673 & 0.253723 \tabularnewline
31 & -0.085078 & -0.6252 & 0.267239 \tabularnewline
32 & -0.081856 & -0.6015 & 0.275006 \tabularnewline
33 & -0.004634 & -0.0341 & 0.48648 \tabularnewline
34 & 0.023821 & 0.175 & 0.430849 \tabularnewline
35 & -0.125984 & -0.9258 & 0.179338 \tabularnewline
36 & -0.139408 & -1.0244 & 0.155098 \tabularnewline
37 & -0.087076 & -0.6399 & 0.26248 \tabularnewline
38 & 0.017645 & 0.1297 & 0.448657 \tabularnewline
39 & 0.16709 & 1.2279 & 0.112414 \tabularnewline
40 & 0.000569 & 0.0042 & 0.498339 \tabularnewline
41 & -0.046653 & -0.3428 & 0.36653 \tabularnewline
42 & -0.126904 & -0.9325 & 0.177603 \tabularnewline
43 & -0.025761 & -0.1893 & 0.425283 \tabularnewline
44 & 0.013372 & 0.0983 & 0.461043 \tabularnewline
45 & -0.059733 & -0.4389 & 0.331225 \tabularnewline
46 & -0.054533 & -0.4007 & 0.345097 \tabularnewline
47 & 0.019335 & 0.1421 & 0.443773 \tabularnewline
48 & -0.021519 & -0.1581 & 0.437471 \tabularnewline
\hline
\end{tabular}
%Source: https://freestatistics.org/blog/index.php?pk=109251&T=2

[TABLE]
[ROW][C]Partial Autocorrelation Function[/C][/ROW]
[ROW][C]Time lag k[/C][C]PACF(k)[/C][C]T-STAT[/C][C]P-value[/C][/ROW]
[ROW][C]1[/C][C]-0.325215[/C][C]-2.3898[/C][C]0.010188[/C][/ROW]
[ROW][C]2[/C][C]-0.453097[/C][C]-3.3296[/C][C]0.000786[/C][/ROW]
[ROW][C]3[/C][C]-0.13982[/C][C]-1.0275[/C][C]0.154391[/C][/ROW]
[ROW][C]4[/C][C]-0.024364[/C][C]-0.179[/C][C]0.429288[/C][/ROW]
[ROW][C]5[/C][C]-0.000407[/C][C]-0.003[/C][C]0.498812[/C][/ROW]
[ROW][C]6[/C][C]0.192016[/C][C]1.411[/C][C]0.081987[/C][/ROW]
[ROW][C]7[/C][C]-0.180294[/C][C]-1.3249[/C][C]0.095394[/C][/ROW]
[ROW][C]8[/C][C]0.214533[/C][C]1.5765[/C][C]0.060377[/C][/ROW]
[ROW][C]9[/C][C]0.113699[/C][C]0.8355[/C][C]0.203556[/C][/ROW]
[ROW][C]10[/C][C]-0.216216[/C][C]-1.5889[/C][C]0.058966[/C][/ROW]
[ROW][C]11[/C][C]-0.427999[/C][C]-3.1451[/C][C]0.001349[/C][/ROW]
[ROW][C]12[/C][C]0.093546[/C][C]0.6874[/C][C]0.247379[/C][/ROW]
[ROW][C]13[/C][C]0.16357[/C][C]1.202[/C][C]0.117307[/C][/ROW]
[ROW][C]14[/C][C]0.027739[/C][C]0.2038[/C][C]0.419622[/C][/ROW]
[ROW][C]15[/C][C]-0.104953[/C][C]-0.7712[/C][C]0.221962[/C][/ROW]
[ROW][C]16[/C][C]-0.123194[/C][C]-0.9053[/C][C]0.184667[/C][/ROW]
[ROW][C]17[/C][C]-0.077558[/C][C]-0.5699[/C][C]0.285543[/C][/ROW]
[ROW][C]18[/C][C]-0.06239[/C][C]-0.4585[/C][C]0.324228[/C][/ROW]
[ROW][C]19[/C][C]-0.038541[/C][C]-0.2832[/C][C]0.389046[/C][/ROW]
[ROW][C]20[/C][C]-0.013736[/C][C]-0.1009[/C][C]0.459987[/C][/ROW]
[ROW][C]21[/C][C]-0.149934[/C][C]-1.1018[/C][C]0.13772[/C][/ROW]
[ROW][C]22[/C][C]-0.032091[/C][C]-0.2358[/C][C]0.407234[/C][/ROW]
[ROW][C]23[/C][C]0.138409[/C][C]1.0171[/C][C]0.156823[/C][/ROW]
[ROW][C]24[/C][C]-0.041384[/C][C]-0.3041[/C][C]0.381107[/C][/ROW]
[ROW][C]25[/C][C]0.047191[/C][C]0.3468[/C][C]0.365053[/C][/ROW]
[ROW][C]26[/C][C]-0.107889[/C][C]-0.7928[/C][C]0.215675[/C][/ROW]
[ROW][C]27[/C][C]-0.053841[/C][C]-0.3957[/C][C]0.346961[/C][/ROW]
[ROW][C]28[/C][C]0.076917[/C][C]0.5652[/C][C]0.287131[/C][/ROW]
[ROW][C]29[/C][C]-0.124304[/C][C]-0.9134[/C][C]0.182535[/C][/ROW]
[ROW][C]30[/C][C]0.090803[/C][C]0.6673[/C][C]0.253723[/C][/ROW]
[ROW][C]31[/C][C]-0.085078[/C][C]-0.6252[/C][C]0.267239[/C][/ROW]
[ROW][C]32[/C][C]-0.081856[/C][C]-0.6015[/C][C]0.275006[/C][/ROW]
[ROW][C]33[/C][C]-0.004634[/C][C]-0.0341[/C][C]0.48648[/C][/ROW]
[ROW][C]34[/C][C]0.023821[/C][C]0.175[/C][C]0.430849[/C][/ROW]
[ROW][C]35[/C][C]-0.125984[/C][C]-0.9258[/C][C]0.179338[/C][/ROW]
[ROW][C]36[/C][C]-0.139408[/C][C]-1.0244[/C][C]0.155098[/C][/ROW]
[ROW][C]37[/C][C]-0.087076[/C][C]-0.6399[/C][C]0.26248[/C][/ROW]
[ROW][C]38[/C][C]0.017645[/C][C]0.1297[/C][C]0.448657[/C][/ROW]
[ROW][C]39[/C][C]0.16709[/C][C]1.2279[/C][C]0.112414[/C][/ROW]
[ROW][C]40[/C][C]0.000569[/C][C]0.0042[/C][C]0.498339[/C][/ROW]
[ROW][C]41[/C][C]-0.046653[/C][C]-0.3428[/C][C]0.36653[/C][/ROW]
[ROW][C]42[/C][C]-0.126904[/C][C]-0.9325[/C][C]0.177603[/C][/ROW]
[ROW][C]43[/C][C]-0.025761[/C][C]-0.1893[/C][C]0.425283[/C][/ROW]
[ROW][C]44[/C][C]0.013372[/C][C]0.0983[/C][C]0.461043[/C][/ROW]
[ROW][C]45[/C][C]-0.059733[/C][C]-0.4389[/C][C]0.331225[/C][/ROW]
[ROW][C]46[/C][C]-0.054533[/C][C]-0.4007[/C][C]0.345097[/C][/ROW]
[ROW][C]47[/C][C]0.019335[/C][C]0.1421[/C][C]0.443773[/C][/ROW]
[ROW][C]48[/C][C]-0.021519[/C][C]-0.1581[/C][C]0.437471[/C][/ROW]
[/TABLE]
Source: https://freestatistics.org/blog/index.php?pk=109251&T=2

Globally Unique Identifier (entire table): ba.freestatistics.org/blog/index.php?pk=109251&T=2

As an alternative you can also use a QR Code:  

The GUIDs for individual cells are displayed in the table below:

Partial Autocorrelation Function
Time lag kPACF(k)T-STATP-value
1-0.325215-2.38980.010188
2-0.453097-3.32960.000786
3-0.13982-1.02750.154391
4-0.024364-0.1790.429288
5-0.000407-0.0030.498812
60.1920161.4110.081987
7-0.180294-1.32490.095394
80.2145331.57650.060377
90.1136990.83550.203556
10-0.216216-1.58890.058966
11-0.427999-3.14510.001349
120.0935460.68740.247379
130.163571.2020.117307
140.0277390.20380.419622
15-0.104953-0.77120.221962
16-0.123194-0.90530.184667
17-0.077558-0.56990.285543
18-0.06239-0.45850.324228
19-0.038541-0.28320.389046
20-0.013736-0.10090.459987
21-0.149934-1.10180.13772
22-0.032091-0.23580.407234
230.1384091.01710.156823
24-0.041384-0.30410.381107
250.0471910.34680.365053
26-0.107889-0.79280.215675
27-0.053841-0.39570.346961
280.0769170.56520.287131
29-0.124304-0.91340.182535
300.0908030.66730.253723
31-0.085078-0.62520.267239
32-0.081856-0.60150.275006
33-0.004634-0.03410.48648
340.0238210.1750.430849
35-0.125984-0.92580.179338
36-0.139408-1.02440.155098
37-0.087076-0.63990.26248
380.0176450.12970.448657
390.167091.22790.112414
400.0005690.00420.498339
41-0.046653-0.34280.36653
42-0.126904-0.93250.177603
43-0.025761-0.18930.425283
440.0133720.09830.461043
45-0.059733-0.43890.331225
46-0.054533-0.40070.345097
470.0193350.14210.443773
48-0.021519-0.15810.437471


Parameters (Session):
par1 = 48 ; par2 = 1 ; par3 = 1 ; par4 = 0 ; par5 = 12 ; par6 = White Noise ; par7 = 0.95 ;
Parameters (R input):
par1 = 48 ; par2 = 1 ; par3 = 1 ; par4 = 0 ; par5 = 12 ; par6 = White Noise ; par7 = 0.95 ;
R code (references can be found in the software module):
if (par1 == 'Default') {
par1 = 10*log10(length(x))
} else {
par1 <- as.numeric(par1)
}
par2 <- as.numeric(par2)
par3 <- as.numeric(par3)
par4 <- as.numeric(par4)
par5 <- as.numeric(par5)
if (par6 == 'White Noise') par6 <- 'white' else par6 <- 'ma'
par7 <- as.numeric(par7)
if (par2 == 0) {
x <- log(x)
} else {
x <- (x ^ par2 - 1) / par2
}
if (par3 > 0) x <- diff(x,lag=1,difference=par3)
if (par4 > 0) x <- diff(x,lag=par5,difference=par4)
bitmap(file='pic1.png')
racf <- acf(x, par1, main='Autocorrelation', xlab='time lag', ylab='ACF', ci.type=par6, ci=par7, sub=paste('(lambda=',par2,', d=',par3,', D=',par4,', CI=', par7, ', CI type=',par6,')',sep=''))
dev.off()
bitmap(file='pic2.png')
rpacf <- pacf(x,par1,main='Partial Autocorrelation',xlab='lags',ylab='PACF')
dev.off()
(myacf <- c(racf$acf))
(mypacf <- c(rpacf$acf))
lengthx <- length(x)
sqrtn <- sqrt(lengthx)
load(file='createtable')
a<-table.start()
a<-table.row.start(a)
a<-table.element(a,'Autocorrelation Function',4,TRUE)
a<-table.row.end(a)
a<-table.row.start(a)
a<-table.element(a,'Time lag k',header=TRUE)
a<-table.element(a,hyperlink('basics.htm','ACF(k)','click here for more information about the Autocorrelation Function'),header=TRUE)
a<-table.element(a,'T-STAT',header=TRUE)
a<-table.element(a,'P-value',header=TRUE)
a<-table.row.end(a)
for (i in 2:(par1+1)) {
a<-table.row.start(a)
a<-table.element(a,i-1,header=TRUE)
a<-table.element(a,round(myacf[i],6))
mytstat <- myacf[i]*sqrtn
a<-table.element(a,round(mytstat,4))
a<-table.element(a,round(1-pt(abs(mytstat),lengthx),6))
a<-table.row.end(a)
}
a<-table.end(a)
table.save(a,file='mytable.tab')
a<-table.start()
a<-table.row.start(a)
a<-table.element(a,'Partial Autocorrelation Function',4,TRUE)
a<-table.row.end(a)
a<-table.row.start(a)
a<-table.element(a,'Time lag k',header=TRUE)
a<-table.element(a,hyperlink('basics.htm','PACF(k)','click here for more information about the Partial Autocorrelation Function'),header=TRUE)
a<-table.element(a,'T-STAT',header=TRUE)
a<-table.element(a,'P-value',header=TRUE)
a<-table.row.end(a)
for (i in 1:par1) {
a<-table.row.start(a)
a<-table.element(a,i,header=TRUE)
a<-table.element(a,round(mypacf[i],6))
mytstat <- mypacf[i]*sqrtn
a<-table.element(a,round(mytstat,4))
a<-table.element(a,round(1-pt(abs(mytstat),lengthx),6))
a<-table.row.end(a)
}
a<-table.end(a)
table.save(a,file='mytable1.tab')