Free Statistics

of Irreproducible Research!

Author's title

Author*The author of this computation has been verified*
R Software Modulerwasp_multipleregression.wasp
Title produced by softwareMultiple Regression
Date of computationMon, 13 Dec 2010 21:59:12 +0000
Cite this page as followsStatistical Computations at FreeStatistics.org, Office for Research Development and Education, URL https://freestatistics.org/blog/index.php?v=date/2010/Dec/13/t1292277878w3chcr73vb27esx.htm/, Retrieved Tue, 07 May 2024 01:39:51 +0000
Statistical Computations at FreeStatistics.org, Office for Research Development and Education, URL https://freestatistics.org/blog/index.php?pk=109227, Retrieved Tue, 07 May 2024 01:39:51 +0000
QR Codes:

Original text written by user:
IsPrivate?No (this computation is public)
User-defined keywords
Estimated Impact124
Family? (F = Feedback message, R = changed R code, M = changed R Module, P = changed Parameters, D = changed Data)
-     [Kendall tau Correlation Matrix] [Extra Ws, poging 2] [2010-12-12 12:49:13] [3635fb7041b1998c5a1332cf9de22bce]
-    D  [Kendall tau Correlation Matrix] [Extra workshop, 3...] [2010-12-12 14:12:35] [3635fb7041b1998c5a1332cf9de22bce]
-         [Kendall tau Correlation Matrix] [Extra WS Correlat...] [2010-12-12 14:21:59] [8081b8996d5947580de3eb171e82db4f]
- RMPD      [Multiple Regression] [Extra WS Multiple...] [2010-12-13 10:56:49] [8081b8996d5947580de3eb171e82db4f]
-    D        [Multiple Regression] [Extra WS Multiple...] [2010-12-13 21:28:21] [8081b8996d5947580de3eb171e82db4f]
-    D            [Multiple Regression] [Extra WS Multiple...] [2010-12-13 21:59:12] [4d0f7ea43b071af5c75b527ee1ef14c2] [Current]
Feedback Forum

Post a new message
Dataseries X:
6.3	1,0	3,0
2.1	2547,0	4,0
9.1	10.55	4,0
15.8	0.023	1,0
5.2	160,0	4,0
10.9	3.3	1,0
8.3	52.16	1,0
11,0	0.425	4,0
3.2	465,0	5,0
6.3	0.075	1,0
6.6	0.785	2,0
9.5	0.2	2,0
3.3	27.66	5,0
11,0	0.12	2,0
4.7	85,0	1,0
10.4	0.101	3,0
7.4	1.04	4,0
2.1	521,0	5,0
17.9	0.01	1,0
6.1	62,0	1,0
11.9	0.023	3,0
13.8	1.7	1,0
14.3	3.5	1,0
15.2	0.48	2,0
10,0	10,0	4,0
11.9	1.62	2,0
6.5	192,0	4,0
7.5	2.5	5,0
10.6	0.28	3,0
7.4	4.235	1,0
8.4	6.8	2,0
5.7	0.75	2,0
4.9	3.6	3,0
3.2	55.5	5,0
11,0	0.9	2,0
4.9	2,0	3,0
13.2	0.104	2,0
9.7	4.19	4,0
12.8	3.5	1,0


Summary of computational transaction
Raw Inputview raw input (R code)
Raw Outputview raw output of R engine
Computing time6 seconds
R Server'George Udny Yule' @ 72.249.76.132

\begin{tabular}{lllllllll}
\hline
Summary of computational transaction \tabularnewline
Raw Input & view raw input (R code)  \tabularnewline
Raw Output & view raw output of R engine  \tabularnewline
Computing time & 6 seconds \tabularnewline
R Server & 'George Udny Yule' @ 72.249.76.132 \tabularnewline
\hline
\end{tabular}
%Source: https://freestatistics.org/blog/index.php?pk=109227&T=0

[TABLE]
[ROW][C]Summary of computational transaction[/C][/ROW]
[ROW][C]Raw Input[/C][C]view raw input (R code) [/C][/ROW]
[ROW][C]Raw Output[/C][C]view raw output of R engine [/C][/ROW]
[ROW][C]Computing time[/C][C]6 seconds[/C][/ROW]
[ROW][C]R Server[/C][C]'George Udny Yule' @ 72.249.76.132[/C][/ROW]
[/TABLE]
Source: https://freestatistics.org/blog/index.php?pk=109227&T=0

Globally Unique Identifier (entire table): ba.freestatistics.org/blog/index.php?pk=109227&T=0

As an alternative you can also use a QR Code:  

The GUIDs for individual cells are displayed in the table below:

Summary of computational transaction
Raw Inputview raw input (R code)
Raw Outputview raw output of R engine
Computing time6 seconds
R Server'George Udny Yule' @ 72.249.76.132


Multiple Linear Regression - Estimated Regression Equation
SWS[t] = + 12.5002913623981 -0.00255900349633257Wb[t] -1.31330657799119D[t] + e[t]

\begin{tabular}{lllllllll}
\hline
Multiple Linear Regression - Estimated Regression Equation \tabularnewline
SWS[t] =  +  12.5002913623981 -0.00255900349633257Wb[t] -1.31330657799119D[t]  + e[t] \tabularnewline
\hline
\end{tabular}
%Source: https://freestatistics.org/blog/index.php?pk=109227&T=1

[TABLE]
[ROW][C]Multiple Linear Regression - Estimated Regression Equation[/C][/ROW]
[ROW][C]SWS[t] =  +  12.5002913623981 -0.00255900349633257Wb[t] -1.31330657799119D[t]  + e[t][/C][/ROW]
[/TABLE]
Source: https://freestatistics.org/blog/index.php?pk=109227&T=1

Globally Unique Identifier (entire table): ba.freestatistics.org/blog/index.php?pk=109227&T=1

As an alternative you can also use a QR Code:  

The GUIDs for individual cells are displayed in the table below:

Multiple Linear Regression - Estimated Regression Equation
SWS[t] = + 12.5002913623981 -0.00255900349633257Wb[t] -1.31330657799119D[t] + e[t]


Multiple Linear Regression - Ordinary Least Squares
VariableParameterS.D.T-STATH0: parameter = 02-tail p-value1-tail p-value
(Intercept)12.50029136239811.12937611.068300
Wb-0.002559003496332570.001317-1.94260.0599230.029962
D-1.313306577991190.386405-3.39880.0016670.000834

\begin{tabular}{lllllllll}
\hline
Multiple Linear Regression - Ordinary Least Squares \tabularnewline
Variable & Parameter & S.D. & T-STATH0: parameter = 0 & 2-tail p-value & 1-tail p-value \tabularnewline
(Intercept) & 12.5002913623981 & 1.129376 & 11.0683 & 0 & 0 \tabularnewline
Wb & -0.00255900349633257 & 0.001317 & -1.9426 & 0.059923 & 0.029962 \tabularnewline
D & -1.31330657799119 & 0.386405 & -3.3988 & 0.001667 & 0.000834 \tabularnewline
\hline
\end{tabular}
%Source: https://freestatistics.org/blog/index.php?pk=109227&T=2

[TABLE]
[ROW][C]Multiple Linear Regression - Ordinary Least Squares[/C][/ROW]
[ROW][C]Variable[/C][C]Parameter[/C][C]S.D.[/C][C]T-STATH0: parameter = 0[/C][C]2-tail p-value[/C][C]1-tail p-value[/C][/ROW]
[ROW][C](Intercept)[/C][C]12.5002913623981[/C][C]1.129376[/C][C]11.0683[/C][C]0[/C][C]0[/C][/ROW]
[ROW][C]Wb[/C][C]-0.00255900349633257[/C][C]0.001317[/C][C]-1.9426[/C][C]0.059923[/C][C]0.029962[/C][/ROW]
[ROW][C]D[/C][C]-1.31330657799119[/C][C]0.386405[/C][C]-3.3988[/C][C]0.001667[/C][C]0.000834[/C][/ROW]
[/TABLE]
Source: https://freestatistics.org/blog/index.php?pk=109227&T=2

Globally Unique Identifier (entire table): ba.freestatistics.org/blog/index.php?pk=109227&T=2

As an alternative you can also use a QR Code:  

The GUIDs for individual cells are displayed in the table below:

Multiple Linear Regression - Ordinary Least Squares
VariableParameterS.D.T-STATH0: parameter = 02-tail p-value1-tail p-value
(Intercept)12.50029136239811.12937611.068300
Wb-0.002559003496332570.001317-1.94260.0599230.029962
D-1.313306577991190.386405-3.39880.0016670.000834


Multiple Linear Regression - Regression Statistics
Multiple R0.600800504937635
R-squared0.360961246733317
Adjusted R-squared0.325459093774057
F-TEST (value)10.1673058292417
F-TEST (DF numerator)2
F-TEST (DF denominator)36
p-value0.000315856287357086
Multiple Linear Regression - Residual Statistics
Residual Standard Deviation3.259188225191
Sum Squared Residuals382.403083940051

\begin{tabular}{lllllllll}
\hline
Multiple Linear Regression - Regression Statistics \tabularnewline
Multiple R & 0.600800504937635 \tabularnewline
R-squared & 0.360961246733317 \tabularnewline
Adjusted R-squared & 0.325459093774057 \tabularnewline
F-TEST (value) & 10.1673058292417 \tabularnewline
F-TEST (DF numerator) & 2 \tabularnewline
F-TEST (DF denominator) & 36 \tabularnewline
p-value & 0.000315856287357086 \tabularnewline
Multiple Linear Regression - Residual Statistics \tabularnewline
Residual Standard Deviation & 3.259188225191 \tabularnewline
Sum Squared Residuals & 382.403083940051 \tabularnewline
\hline
\end{tabular}
%Source: https://freestatistics.org/blog/index.php?pk=109227&T=3

[TABLE]
[ROW][C]Multiple Linear Regression - Regression Statistics[/C][/ROW]
[ROW][C]Multiple R[/C][C]0.600800504937635[/C][/ROW]
[ROW][C]R-squared[/C][C]0.360961246733317[/C][/ROW]
[ROW][C]Adjusted R-squared[/C][C]0.325459093774057[/C][/ROW]
[ROW][C]F-TEST (value)[/C][C]10.1673058292417[/C][/ROW]
[ROW][C]F-TEST (DF numerator)[/C][C]2[/C][/ROW]
[ROW][C]F-TEST (DF denominator)[/C][C]36[/C][/ROW]
[ROW][C]p-value[/C][C]0.000315856287357086[/C][/ROW]
[ROW][C]Multiple Linear Regression - Residual Statistics[/C][/ROW]
[ROW][C]Residual Standard Deviation[/C][C]3.259188225191[/C][/ROW]
[ROW][C]Sum Squared Residuals[/C][C]382.403083940051[/C][/ROW]
[/TABLE]
Source: https://freestatistics.org/blog/index.php?pk=109227&T=3

Globally Unique Identifier (entire table): ba.freestatistics.org/blog/index.php?pk=109227&T=3

As an alternative you can also use a QR Code:  

The GUIDs for individual cells are displayed in the table below:

Multiple Linear Regression - Regression Statistics
Multiple R0.600800504937635
R-squared0.360961246733317
Adjusted R-squared0.325459093774057
F-TEST (value)10.1673058292417
F-TEST (DF numerator)2
F-TEST (DF denominator)36
p-value0.000315856287357086
Multiple Linear Regression - Residual Statistics
Residual Standard Deviation3.259188225191
Sum Squared Residuals382.403083940051


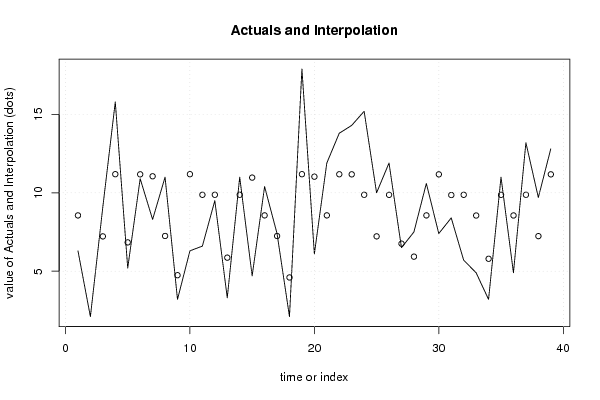
Multiple Linear Regression - Actuals, Interpolation, and Residuals
Time or IndexActualsInterpolationForecastResidualsPrediction Error
16.38.55781262492819-2.25781262492819
22.10.7292831452742691.37071685472573
39.17.220067563547011.87993243645299
415.811.18692592732654.61307407267354
55.26.83762449102011-1.63762449102011
610.911.1785400728690-0.278540072868979
78.311.0535071620382-2.75350716203817
8117.245977473947383.75402252605262
93.24.74382184664749-1.54382184664749
106.311.1867928591447-4.88679285914465
116.69.87166938867107-3.27166938867107
129.59.87316640571642-0.373166405716424
133.35.86297643573358-2.56297643573357
14119.873371125996131.12662887400387
154.710.9694694872186-6.26946948721861
1610.48.560113169071371.83988683092863
177.47.244403686797130.155596313202868
182.14.60051765085286-2.50051765085286
1917.911.18695919437196.71304080562808
206.111.0283265676343-4.92832656763426
2111.98.560312771344093.33968722865591
2213.811.18263447846312.61736552153689
2314.311.17802827216973.12197172783029
2415.29.872449884737455.32755011526255
25107.221475015469992.77852498453001
2611.99.869532620751632.03046737924837
276.56.75573637913747-0.255736379137465
287.55.92736096370131.5726390362987
2910.68.559655107445532.04034489255447
307.411.1761474045999-3.77614740459991
318.49.85627698264063-1.45627698264063
325.79.87175895379344-4.17175895379344
334.98.5511592158377-3.65115921583771
343.25.79173377839567-2.59173377839567
35119.8713751032691.12862489673101
364.98.55525362143184-3.65525362143184
3713.29.873412070052073.32658792994793
389.77.236342825783692.46365717421631
3912.811.17802827216971.62197172783029

\begin{tabular}{lllllllll}
\hline
Multiple Linear Regression - Actuals, Interpolation, and Residuals \tabularnewline
Time or Index & Actuals & InterpolationForecast & ResidualsPrediction Error \tabularnewline
1 & 6.3 & 8.55781262492819 & -2.25781262492819 \tabularnewline
2 & 2.1 & 0.729283145274269 & 1.37071685472573 \tabularnewline
3 & 9.1 & 7.22006756354701 & 1.87993243645299 \tabularnewline
4 & 15.8 & 11.1869259273265 & 4.61307407267354 \tabularnewline
5 & 5.2 & 6.83762449102011 & -1.63762449102011 \tabularnewline
6 & 10.9 & 11.1785400728690 & -0.278540072868979 \tabularnewline
7 & 8.3 & 11.0535071620382 & -2.75350716203817 \tabularnewline
8 & 11 & 7.24597747394738 & 3.75402252605262 \tabularnewline
9 & 3.2 & 4.74382184664749 & -1.54382184664749 \tabularnewline
10 & 6.3 & 11.1867928591447 & -4.88679285914465 \tabularnewline
11 & 6.6 & 9.87166938867107 & -3.27166938867107 \tabularnewline
12 & 9.5 & 9.87316640571642 & -0.373166405716424 \tabularnewline
13 & 3.3 & 5.86297643573358 & -2.56297643573357 \tabularnewline
14 & 11 & 9.87337112599613 & 1.12662887400387 \tabularnewline
15 & 4.7 & 10.9694694872186 & -6.26946948721861 \tabularnewline
16 & 10.4 & 8.56011316907137 & 1.83988683092863 \tabularnewline
17 & 7.4 & 7.24440368679713 & 0.155596313202868 \tabularnewline
18 & 2.1 & 4.60051765085286 & -2.50051765085286 \tabularnewline
19 & 17.9 & 11.1869591943719 & 6.71304080562808 \tabularnewline
20 & 6.1 & 11.0283265676343 & -4.92832656763426 \tabularnewline
21 & 11.9 & 8.56031277134409 & 3.33968722865591 \tabularnewline
22 & 13.8 & 11.1826344784631 & 2.61736552153689 \tabularnewline
23 & 14.3 & 11.1780282721697 & 3.12197172783029 \tabularnewline
24 & 15.2 & 9.87244988473745 & 5.32755011526255 \tabularnewline
25 & 10 & 7.22147501546999 & 2.77852498453001 \tabularnewline
26 & 11.9 & 9.86953262075163 & 2.03046737924837 \tabularnewline
27 & 6.5 & 6.75573637913747 & -0.255736379137465 \tabularnewline
28 & 7.5 & 5.9273609637013 & 1.5726390362987 \tabularnewline
29 & 10.6 & 8.55965510744553 & 2.04034489255447 \tabularnewline
30 & 7.4 & 11.1761474045999 & -3.77614740459991 \tabularnewline
31 & 8.4 & 9.85627698264063 & -1.45627698264063 \tabularnewline
32 & 5.7 & 9.87175895379344 & -4.17175895379344 \tabularnewline
33 & 4.9 & 8.5511592158377 & -3.65115921583771 \tabularnewline
34 & 3.2 & 5.79173377839567 & -2.59173377839567 \tabularnewline
35 & 11 & 9.871375103269 & 1.12862489673101 \tabularnewline
36 & 4.9 & 8.55525362143184 & -3.65525362143184 \tabularnewline
37 & 13.2 & 9.87341207005207 & 3.32658792994793 \tabularnewline
38 & 9.7 & 7.23634282578369 & 2.46365717421631 \tabularnewline
39 & 12.8 & 11.1780282721697 & 1.62197172783029 \tabularnewline
\hline
\end{tabular}
%Source: https://freestatistics.org/blog/index.php?pk=109227&T=4

[TABLE]
[ROW][C]Multiple Linear Regression - Actuals, Interpolation, and Residuals[/C][/ROW]
[ROW][C]Time or Index[/C][C]Actuals[/C][C]InterpolationForecast[/C][C]ResidualsPrediction Error[/C][/ROW]
[ROW][C]1[/C][C]6.3[/C][C]8.55781262492819[/C][C]-2.25781262492819[/C][/ROW]
[ROW][C]2[/C][C]2.1[/C][C]0.729283145274269[/C][C]1.37071685472573[/C][/ROW]
[ROW][C]3[/C][C]9.1[/C][C]7.22006756354701[/C][C]1.87993243645299[/C][/ROW]
[ROW][C]4[/C][C]15.8[/C][C]11.1869259273265[/C][C]4.61307407267354[/C][/ROW]
[ROW][C]5[/C][C]5.2[/C][C]6.83762449102011[/C][C]-1.63762449102011[/C][/ROW]
[ROW][C]6[/C][C]10.9[/C][C]11.1785400728690[/C][C]-0.278540072868979[/C][/ROW]
[ROW][C]7[/C][C]8.3[/C][C]11.0535071620382[/C][C]-2.75350716203817[/C][/ROW]
[ROW][C]8[/C][C]11[/C][C]7.24597747394738[/C][C]3.75402252605262[/C][/ROW]
[ROW][C]9[/C][C]3.2[/C][C]4.74382184664749[/C][C]-1.54382184664749[/C][/ROW]
[ROW][C]10[/C][C]6.3[/C][C]11.1867928591447[/C][C]-4.88679285914465[/C][/ROW]
[ROW][C]11[/C][C]6.6[/C][C]9.87166938867107[/C][C]-3.27166938867107[/C][/ROW]
[ROW][C]12[/C][C]9.5[/C][C]9.87316640571642[/C][C]-0.373166405716424[/C][/ROW]
[ROW][C]13[/C][C]3.3[/C][C]5.86297643573358[/C][C]-2.56297643573357[/C][/ROW]
[ROW][C]14[/C][C]11[/C][C]9.87337112599613[/C][C]1.12662887400387[/C][/ROW]
[ROW][C]15[/C][C]4.7[/C][C]10.9694694872186[/C][C]-6.26946948721861[/C][/ROW]
[ROW][C]16[/C][C]10.4[/C][C]8.56011316907137[/C][C]1.83988683092863[/C][/ROW]
[ROW][C]17[/C][C]7.4[/C][C]7.24440368679713[/C][C]0.155596313202868[/C][/ROW]
[ROW][C]18[/C][C]2.1[/C][C]4.60051765085286[/C][C]-2.50051765085286[/C][/ROW]
[ROW][C]19[/C][C]17.9[/C][C]11.1869591943719[/C][C]6.71304080562808[/C][/ROW]
[ROW][C]20[/C][C]6.1[/C][C]11.0283265676343[/C][C]-4.92832656763426[/C][/ROW]
[ROW][C]21[/C][C]11.9[/C][C]8.56031277134409[/C][C]3.33968722865591[/C][/ROW]
[ROW][C]22[/C][C]13.8[/C][C]11.1826344784631[/C][C]2.61736552153689[/C][/ROW]
[ROW][C]23[/C][C]14.3[/C][C]11.1780282721697[/C][C]3.12197172783029[/C][/ROW]
[ROW][C]24[/C][C]15.2[/C][C]9.87244988473745[/C][C]5.32755011526255[/C][/ROW]
[ROW][C]25[/C][C]10[/C][C]7.22147501546999[/C][C]2.77852498453001[/C][/ROW]
[ROW][C]26[/C][C]11.9[/C][C]9.86953262075163[/C][C]2.03046737924837[/C][/ROW]
[ROW][C]27[/C][C]6.5[/C][C]6.75573637913747[/C][C]-0.255736379137465[/C][/ROW]
[ROW][C]28[/C][C]7.5[/C][C]5.9273609637013[/C][C]1.5726390362987[/C][/ROW]
[ROW][C]29[/C][C]10.6[/C][C]8.55965510744553[/C][C]2.04034489255447[/C][/ROW]
[ROW][C]30[/C][C]7.4[/C][C]11.1761474045999[/C][C]-3.77614740459991[/C][/ROW]
[ROW][C]31[/C][C]8.4[/C][C]9.85627698264063[/C][C]-1.45627698264063[/C][/ROW]
[ROW][C]32[/C][C]5.7[/C][C]9.87175895379344[/C][C]-4.17175895379344[/C][/ROW]
[ROW][C]33[/C][C]4.9[/C][C]8.5511592158377[/C][C]-3.65115921583771[/C][/ROW]
[ROW][C]34[/C][C]3.2[/C][C]5.79173377839567[/C][C]-2.59173377839567[/C][/ROW]
[ROW][C]35[/C][C]11[/C][C]9.871375103269[/C][C]1.12862489673101[/C][/ROW]
[ROW][C]36[/C][C]4.9[/C][C]8.55525362143184[/C][C]-3.65525362143184[/C][/ROW]
[ROW][C]37[/C][C]13.2[/C][C]9.87341207005207[/C][C]3.32658792994793[/C][/ROW]
[ROW][C]38[/C][C]9.7[/C][C]7.23634282578369[/C][C]2.46365717421631[/C][/ROW]
[ROW][C]39[/C][C]12.8[/C][C]11.1780282721697[/C][C]1.62197172783029[/C][/ROW]
[/TABLE]
Source: https://freestatistics.org/blog/index.php?pk=109227&T=4

Globally Unique Identifier (entire table): ba.freestatistics.org/blog/index.php?pk=109227&T=4

As an alternative you can also use a QR Code:  

The GUIDs for individual cells are displayed in the table below:

Multiple Linear Regression - Actuals, Interpolation, and Residuals
Time or IndexActualsInterpolationForecastResidualsPrediction Error
16.38.55781262492819-2.25781262492819
22.10.7292831452742691.37071685472573
39.17.220067563547011.87993243645299
415.811.18692592732654.61307407267354
55.26.83762449102011-1.63762449102011
610.911.1785400728690-0.278540072868979
78.311.0535071620382-2.75350716203817
8117.245977473947383.75402252605262
93.24.74382184664749-1.54382184664749
106.311.1867928591447-4.88679285914465
116.69.87166938867107-3.27166938867107
129.59.87316640571642-0.373166405716424
133.35.86297643573358-2.56297643573357
14119.873371125996131.12662887400387
154.710.9694694872186-6.26946948721861
1610.48.560113169071371.83988683092863
177.47.244403686797130.155596313202868
182.14.60051765085286-2.50051765085286
1917.911.18695919437196.71304080562808
206.111.0283265676343-4.92832656763426
2111.98.560312771344093.33968722865591
2213.811.18263447846312.61736552153689
2314.311.17802827216973.12197172783029
2415.29.872449884737455.32755011526255
25107.221475015469992.77852498453001
2611.99.869532620751632.03046737924837
276.56.75573637913747-0.255736379137465
287.55.92736096370131.5726390362987
2910.68.559655107445532.04034489255447
307.411.1761474045999-3.77614740459991
318.49.85627698264063-1.45627698264063
325.79.87175895379344-4.17175895379344
334.98.5511592158377-3.65115921583771
343.25.79173377839567-2.59173377839567
35119.8713751032691.12862489673101
364.98.55525362143184-3.65525362143184
3713.29.873412070052073.32658792994793
389.77.236342825783692.46365717421631
3912.811.17802827216971.62197172783029


Goldfeld-Quandt test for Heteroskedasticity
p-valuesAlternative Hypothesis
breakpoint indexgreater2-sidedless
60.5002207898017150.999558420396570.499779210198285
70.5326913008637950.934617398272410.467308699136205
80.5448523721263020.9102952557473960.455147627873698
90.4554766364153380.9109532728306750.544523363584662
100.5768843565648880.8462312868702230.423115643435112
110.5431085851828630.9137828296342740.456891414817137
120.429924377045540.859848754091080.57007562295446
130.3928489931532440.7856979863064870.607151006846756
140.3169933334868830.6339866669737650.683006666513117
150.5037665016604590.9924669966790820.496233498339541
160.4454270100435340.8908540200870680.554572989956466
170.3478949517960130.6957899035920260.652105048203987
180.3095809744133350.619161948826670.690419025586665
190.629443234198520.7411135316029590.370556765801480
200.7018188956547410.5963622086905180.298181104345259
210.6938430702486170.6123138595027660.306156929751383
220.650838146209520.6983237075809610.349161853790481
230.6316132735241360.7367734529517290.368386726475865
240.771853364552820.4562932708943610.228146635447181
250.7423071002329970.5153857995340070.257692899767003
260.6986165437026390.6027669125947220.301383456297361
270.6721623829529420.6556752340941170.327837617047058
280.5653642236835370.8692715526329250.434635776316463
290.4960303023676520.9920606047353030.503969697632348
300.4836860123754860.9673720247509710.516313987624514
310.3634966362757650.726993272551530.636503363724235
320.4400410397336980.8800820794673950.559958960266302
330.4802282383028760.960456476605750.519771761697124

\begin{tabular}{lllllllll}
\hline
Goldfeld-Quandt test for Heteroskedasticity \tabularnewline
p-values & Alternative Hypothesis \tabularnewline
breakpoint index & greater & 2-sided & less \tabularnewline
6 & 0.500220789801715 & 0.99955842039657 & 0.499779210198285 \tabularnewline
7 & 0.532691300863795 & 0.93461739827241 & 0.467308699136205 \tabularnewline
8 & 0.544852372126302 & 0.910295255747396 & 0.455147627873698 \tabularnewline
9 & 0.455476636415338 & 0.910953272830675 & 0.544523363584662 \tabularnewline
10 & 0.576884356564888 & 0.846231286870223 & 0.423115643435112 \tabularnewline
11 & 0.543108585182863 & 0.913782829634274 & 0.456891414817137 \tabularnewline
12 & 0.42992437704554 & 0.85984875409108 & 0.57007562295446 \tabularnewline
13 & 0.392848993153244 & 0.785697986306487 & 0.607151006846756 \tabularnewline
14 & 0.316993333486883 & 0.633986666973765 & 0.683006666513117 \tabularnewline
15 & 0.503766501660459 & 0.992466996679082 & 0.496233498339541 \tabularnewline
16 & 0.445427010043534 & 0.890854020087068 & 0.554572989956466 \tabularnewline
17 & 0.347894951796013 & 0.695789903592026 & 0.652105048203987 \tabularnewline
18 & 0.309580974413335 & 0.61916194882667 & 0.690419025586665 \tabularnewline
19 & 0.62944323419852 & 0.741113531602959 & 0.370556765801480 \tabularnewline
20 & 0.701818895654741 & 0.596362208690518 & 0.298181104345259 \tabularnewline
21 & 0.693843070248617 & 0.612313859502766 & 0.306156929751383 \tabularnewline
22 & 0.65083814620952 & 0.698323707580961 & 0.349161853790481 \tabularnewline
23 & 0.631613273524136 & 0.736773452951729 & 0.368386726475865 \tabularnewline
24 & 0.77185336455282 & 0.456293270894361 & 0.228146635447181 \tabularnewline
25 & 0.742307100232997 & 0.515385799534007 & 0.257692899767003 \tabularnewline
26 & 0.698616543702639 & 0.602766912594722 & 0.301383456297361 \tabularnewline
27 & 0.672162382952942 & 0.655675234094117 & 0.327837617047058 \tabularnewline
28 & 0.565364223683537 & 0.869271552632925 & 0.434635776316463 \tabularnewline
29 & 0.496030302367652 & 0.992060604735303 & 0.503969697632348 \tabularnewline
30 & 0.483686012375486 & 0.967372024750971 & 0.516313987624514 \tabularnewline
31 & 0.363496636275765 & 0.72699327255153 & 0.636503363724235 \tabularnewline
32 & 0.440041039733698 & 0.880082079467395 & 0.559958960266302 \tabularnewline
33 & 0.480228238302876 & 0.96045647660575 & 0.519771761697124 \tabularnewline
\hline
\end{tabular}
%Source: https://freestatistics.org/blog/index.php?pk=109227&T=5

[TABLE]
[ROW][C]Goldfeld-Quandt test for Heteroskedasticity[/C][/ROW]
[ROW][C]p-values[/C][C]Alternative Hypothesis[/C][/ROW]
[ROW][C]breakpoint index[/C][C]greater[/C][C]2-sided[/C][C]less[/C][/ROW]
[ROW][C]6[/C][C]0.500220789801715[/C][C]0.99955842039657[/C][C]0.499779210198285[/C][/ROW]
[ROW][C]7[/C][C]0.532691300863795[/C][C]0.93461739827241[/C][C]0.467308699136205[/C][/ROW]
[ROW][C]8[/C][C]0.544852372126302[/C][C]0.910295255747396[/C][C]0.455147627873698[/C][/ROW]
[ROW][C]9[/C][C]0.455476636415338[/C][C]0.910953272830675[/C][C]0.544523363584662[/C][/ROW]
[ROW][C]10[/C][C]0.576884356564888[/C][C]0.846231286870223[/C][C]0.423115643435112[/C][/ROW]
[ROW][C]11[/C][C]0.543108585182863[/C][C]0.913782829634274[/C][C]0.456891414817137[/C][/ROW]
[ROW][C]12[/C][C]0.42992437704554[/C][C]0.85984875409108[/C][C]0.57007562295446[/C][/ROW]
[ROW][C]13[/C][C]0.392848993153244[/C][C]0.785697986306487[/C][C]0.607151006846756[/C][/ROW]
[ROW][C]14[/C][C]0.316993333486883[/C][C]0.633986666973765[/C][C]0.683006666513117[/C][/ROW]
[ROW][C]15[/C][C]0.503766501660459[/C][C]0.992466996679082[/C][C]0.496233498339541[/C][/ROW]
[ROW][C]16[/C][C]0.445427010043534[/C][C]0.890854020087068[/C][C]0.554572989956466[/C][/ROW]
[ROW][C]17[/C][C]0.347894951796013[/C][C]0.695789903592026[/C][C]0.652105048203987[/C][/ROW]
[ROW][C]18[/C][C]0.309580974413335[/C][C]0.61916194882667[/C][C]0.690419025586665[/C][/ROW]
[ROW][C]19[/C][C]0.62944323419852[/C][C]0.741113531602959[/C][C]0.370556765801480[/C][/ROW]
[ROW][C]20[/C][C]0.701818895654741[/C][C]0.596362208690518[/C][C]0.298181104345259[/C][/ROW]
[ROW][C]21[/C][C]0.693843070248617[/C][C]0.612313859502766[/C][C]0.306156929751383[/C][/ROW]
[ROW][C]22[/C][C]0.65083814620952[/C][C]0.698323707580961[/C][C]0.349161853790481[/C][/ROW]
[ROW][C]23[/C][C]0.631613273524136[/C][C]0.736773452951729[/C][C]0.368386726475865[/C][/ROW]
[ROW][C]24[/C][C]0.77185336455282[/C][C]0.456293270894361[/C][C]0.228146635447181[/C][/ROW]
[ROW][C]25[/C][C]0.742307100232997[/C][C]0.515385799534007[/C][C]0.257692899767003[/C][/ROW]
[ROW][C]26[/C][C]0.698616543702639[/C][C]0.602766912594722[/C][C]0.301383456297361[/C][/ROW]
[ROW][C]27[/C][C]0.672162382952942[/C][C]0.655675234094117[/C][C]0.327837617047058[/C][/ROW]
[ROW][C]28[/C][C]0.565364223683537[/C][C]0.869271552632925[/C][C]0.434635776316463[/C][/ROW]
[ROW][C]29[/C][C]0.496030302367652[/C][C]0.992060604735303[/C][C]0.503969697632348[/C][/ROW]
[ROW][C]30[/C][C]0.483686012375486[/C][C]0.967372024750971[/C][C]0.516313987624514[/C][/ROW]
[ROW][C]31[/C][C]0.363496636275765[/C][C]0.72699327255153[/C][C]0.636503363724235[/C][/ROW]
[ROW][C]32[/C][C]0.440041039733698[/C][C]0.880082079467395[/C][C]0.559958960266302[/C][/ROW]
[ROW][C]33[/C][C]0.480228238302876[/C][C]0.96045647660575[/C][C]0.519771761697124[/C][/ROW]
[/TABLE]
Source: https://freestatistics.org/blog/index.php?pk=109227&T=5

Globally Unique Identifier (entire table): ba.freestatistics.org/blog/index.php?pk=109227&T=5

As an alternative you can also use a QR Code:  

The GUIDs for individual cells are displayed in the table below:

Goldfeld-Quandt test for Heteroskedasticity
p-valuesAlternative Hypothesis
breakpoint indexgreater2-sidedless
60.5002207898017150.999558420396570.499779210198285
70.5326913008637950.934617398272410.467308699136205
80.5448523721263020.9102952557473960.455147627873698
90.4554766364153380.9109532728306750.544523363584662
100.5768843565648880.8462312868702230.423115643435112
110.5431085851828630.9137828296342740.456891414817137
120.429924377045540.859848754091080.57007562295446
130.3928489931532440.7856979863064870.607151006846756
140.3169933334868830.6339866669737650.683006666513117
150.5037665016604590.9924669966790820.496233498339541
160.4454270100435340.8908540200870680.554572989956466
170.3478949517960130.6957899035920260.652105048203987
180.3095809744133350.619161948826670.690419025586665
190.629443234198520.7411135316029590.370556765801480
200.7018188956547410.5963622086905180.298181104345259
210.6938430702486170.6123138595027660.306156929751383
220.650838146209520.6983237075809610.349161853790481
230.6316132735241360.7367734529517290.368386726475865
240.771853364552820.4562932708943610.228146635447181
250.7423071002329970.5153857995340070.257692899767003
260.6986165437026390.6027669125947220.301383456297361
270.6721623829529420.6556752340941170.327837617047058
280.5653642236835370.8692715526329250.434635776316463
290.4960303023676520.9920606047353030.503969697632348
300.4836860123754860.9673720247509710.516313987624514
310.3634966362757650.726993272551530.636503363724235
320.4400410397336980.8800820794673950.559958960266302
330.4802282383028760.960456476605750.519771761697124


Meta Analysis of Goldfeld-Quandt test for Heteroskedasticity
Description# significant tests% significant testsOK/NOK
1% type I error level00OK
5% type I error level00OK
10% type I error level00OK

\begin{tabular}{lllllllll}
\hline
Meta Analysis of Goldfeld-Quandt test for Heteroskedasticity \tabularnewline
Description & # significant tests & % significant tests & OK/NOK \tabularnewline
1% type I error level & 0 & 0 & OK \tabularnewline
5% type I error level & 0 & 0 & OK \tabularnewline
10% type I error level & 0 & 0 & OK \tabularnewline
\hline
\end{tabular}
%Source: https://freestatistics.org/blog/index.php?pk=109227&T=6

[TABLE]
[ROW][C]Meta Analysis of Goldfeld-Quandt test for Heteroskedasticity[/C][/ROW]
[ROW][C]Description[/C][C]# significant tests[/C][C]% significant tests[/C][C]OK/NOK[/C][/ROW]
[ROW][C]1% type I error level[/C][C]0[/C][C]0[/C][C]OK[/C][/ROW]
[ROW][C]5% type I error level[/C][C]0[/C][C]0[/C][C]OK[/C][/ROW]
[ROW][C]10% type I error level[/C][C]0[/C][C]0[/C][C]OK[/C][/ROW]
[/TABLE]
Source: https://freestatistics.org/blog/index.php?pk=109227&T=6

Globally Unique Identifier (entire table): ba.freestatistics.org/blog/index.php?pk=109227&T=6

As an alternative you can also use a QR Code:  

The GUIDs for individual cells are displayed in the table below:

Meta Analysis of Goldfeld-Quandt test for Heteroskedasticity
Description# significant tests% significant testsOK/NOK
1% type I error level00OK
5% type I error level00OK
10% type I error level00OK


Parameters (Session):
par1 = 1 ; par2 = Do not include Seasonal Dummies ; par3 = No Linear Trend ;
Parameters (R input):
par1 = 1 ; par2 = Do not include Seasonal Dummies ; par3 = No Linear Trend ;
R code (references can be found in the software module):
library(lattice)
library(lmtest)
n25 <- 25 #minimum number of obs. for Goldfeld-Quandt test
par1 <- as.numeric(par1)
x <- t(y)
k <- length(x[1,])
n <- length(x[,1])
x1 <- cbind(x[,par1], x[,1:k!=par1])
mycolnames <- c(colnames(x)[par1], colnames(x)[1:k!=par1])
colnames(x1) <- mycolnames #colnames(x)[par1]
x <- x1
if (par3 == 'First Differences'){
x2 <- array(0, dim=c(n-1,k), dimnames=list(1:(n-1), paste('(1-B)',colnames(x),sep='')))
for (i in 1:n-1) {
for (j in 1:k) {
x2[i,j] <- x[i+1,j] - x[i,j]
}
}
x <- x2
}
if (par2 == 'Include Monthly Dummies'){
x2 <- array(0, dim=c(n,11), dimnames=list(1:n, paste('M', seq(1:11), sep ='')))
for (i in 1:11){
x2[seq(i,n,12),i] <- 1
}
x <- cbind(x, x2)
}
if (par2 == 'Include Quarterly Dummies'){
x2 <- array(0, dim=c(n,3), dimnames=list(1:n, paste('Q', seq(1:3), sep ='')))
for (i in 1:3){
x2[seq(i,n,4),i] <- 1
}
x <- cbind(x, x2)
}
k <- length(x[1,])
if (par3 == 'Linear Trend'){
x <- cbind(x, c(1:n))
colnames(x)[k+1] <- 't'
}
x
k <- length(x[1,])
df <- as.data.frame(x)
(mylm <- lm(df))
(mysum <- summary(mylm))
if (n > n25) {
kp3 <- k + 3
nmkm3 <- n - k - 3
gqarr <- array(NA, dim=c(nmkm3-kp3+1,3))
numgqtests <- 0
numsignificant1 <- 0
numsignificant5 <- 0
numsignificant10 <- 0
for (mypoint in kp3:nmkm3) {
j <- 0
numgqtests <- numgqtests + 1
for (myalt in c('greater', 'two.sided', 'less')) {
j <- j + 1
gqarr[mypoint-kp3+1,j] <- gqtest(mylm, point=mypoint, alternative=myalt)$p.value
}
if (gqarr[mypoint-kp3+1,2] < 0.01) numsignificant1 <- numsignificant1 + 1
if (gqarr[mypoint-kp3+1,2] < 0.05) numsignificant5 <- numsignificant5 + 1
if (gqarr[mypoint-kp3+1,2] < 0.10) numsignificant10 <- numsignificant10 + 1
}
gqarr
}
bitmap(file='test0.png')
plot(x[,1], type='l', main='Actuals and Interpolation', ylab='value of Actuals and Interpolation (dots)', xlab='time or index')
points(x[,1]-mysum$resid)
grid()
dev.off()
bitmap(file='test1.png')
plot(mysum$resid, type='b', pch=19, main='Residuals', ylab='value of Residuals', xlab='time or index')
grid()
dev.off()
bitmap(file='test2.png')
hist(mysum$resid, main='Residual Histogram', xlab='values of Residuals')
grid()
dev.off()
bitmap(file='test3.png')
densityplot(~mysum$resid,col='black',main='Residual Density Plot', xlab='values of Residuals')
dev.off()
bitmap(file='test4.png')
qqnorm(mysum$resid, main='Residual Normal Q-Q Plot')
qqline(mysum$resid)
grid()
dev.off()
(myerror <- as.ts(mysum$resid))
bitmap(file='test5.png')
dum <- cbind(lag(myerror,k=1),myerror)
dum
dum1 <- dum[2:length(myerror),]
dum1
z <- as.data.frame(dum1)
z
plot(z,main=paste('Residual Lag plot, lowess, and regression line'), ylab='values of Residuals', xlab='lagged values of Residuals')
lines(lowess(z))
abline(lm(z))
grid()
dev.off()
bitmap(file='test6.png')
acf(mysum$resid, lag.max=length(mysum$resid)/2, main='Residual Autocorrelation Function')
grid()
dev.off()
bitmap(file='test7.png')
pacf(mysum$resid, lag.max=length(mysum$resid)/2, main='Residual Partial Autocorrelation Function')
grid()
dev.off()
bitmap(file='test8.png')
opar <- par(mfrow = c(2,2), oma = c(0, 0, 1.1, 0))
plot(mylm, las = 1, sub='Residual Diagnostics')
par(opar)
dev.off()
if (n > n25) {
bitmap(file='test9.png')
plot(kp3:nmkm3,gqarr[,2], main='Goldfeld-Quandt test',ylab='2-sided p-value',xlab='breakpoint')
grid()
dev.off()
}
load(file='createtable')
a<-table.start()
a<-table.row.start(a)
a<-table.element(a, 'Multiple Linear Regression - Estimated Regression Equation', 1, TRUE)
a<-table.row.end(a)
myeq <- colnames(x)[1]
myeq <- paste(myeq, '[t] = ', sep='')
for (i in 1:k){
if (mysum$coefficients[i,1] > 0) myeq <- paste(myeq, '+', '')
myeq <- paste(myeq, mysum$coefficients[i,1], sep=' ')
if (rownames(mysum$coefficients)[i] != '(Intercept)') {
myeq <- paste(myeq, rownames(mysum$coefficients)[i], sep='')
if (rownames(mysum$coefficients)[i] != 't') myeq <- paste(myeq, '[t]', sep='')
}
}
myeq <- paste(myeq, ' + e[t]')
a<-table.row.start(a)
a<-table.element(a, myeq)
a<-table.row.end(a)
a<-table.end(a)
table.save(a,file='mytable1.tab')
a<-table.start()
a<-table.row.start(a)
a<-table.element(a,hyperlink('ols1.htm','Multiple Linear Regression - Ordinary Least Squares',''), 6, TRUE)
a<-table.row.end(a)
a<-table.row.start(a)
a<-table.element(a,'Variable',header=TRUE)
a<-table.element(a,'Parameter',header=TRUE)
a<-table.element(a,'S.D.',header=TRUE)
a<-table.element(a,'T-STAT
H0: parameter = 0',header=TRUE)
a<-table.element(a,'2-tail p-value',header=TRUE)
a<-table.element(a,'1-tail p-value',header=TRUE)
a<-table.row.end(a)
for (i in 1:k){
a<-table.row.start(a)
a<-table.element(a,rownames(mysum$coefficients)[i],header=TRUE)
a<-table.element(a,mysum$coefficients[i,1])
a<-table.element(a, round(mysum$coefficients[i,2],6))
a<-table.element(a, round(mysum$coefficients[i,3],4))
a<-table.element(a, round(mysum$coefficients[i,4],6))
a<-table.element(a, round(mysum$coefficients[i,4]/2,6))
a<-table.row.end(a)
}
a<-table.end(a)
table.save(a,file='mytable2.tab')
a<-table.start()
a<-table.row.start(a)
a<-table.element(a, 'Multiple Linear Regression - Regression Statistics', 2, TRUE)
a<-table.row.end(a)
a<-table.row.start(a)
a<-table.element(a, 'Multiple R',1,TRUE)
a<-table.element(a, sqrt(mysum$r.squared))
a<-table.row.end(a)
a<-table.row.start(a)
a<-table.element(a, 'R-squared',1,TRUE)
a<-table.element(a, mysum$r.squared)
a<-table.row.end(a)
a<-table.row.start(a)
a<-table.element(a, 'Adjusted R-squared',1,TRUE)
a<-table.element(a, mysum$adj.r.squared)
a<-table.row.end(a)
a<-table.row.start(a)
a<-table.element(a, 'F-TEST (value)',1,TRUE)
a<-table.element(a, mysum$fstatistic[1])
a<-table.row.end(a)
a<-table.row.start(a)
a<-table.element(a, 'F-TEST (DF numerator)',1,TRUE)
a<-table.element(a, mysum$fstatistic[2])
a<-table.row.end(a)
a<-table.row.start(a)
a<-table.element(a, 'F-TEST (DF denominator)',1,TRUE)
a<-table.element(a, mysum$fstatistic[3])
a<-table.row.end(a)
a<-table.row.start(a)
a<-table.element(a, 'p-value',1,TRUE)
a<-table.element(a, 1-pf(mysum$fstatistic[1],mysum$fstatistic[2],mysum$fstatistic[3]))
a<-table.row.end(a)
a<-table.row.start(a)
a<-table.element(a, 'Multiple Linear Regression - Residual Statistics', 2, TRUE)
a<-table.row.end(a)
a<-table.row.start(a)
a<-table.element(a, 'Residual Standard Deviation',1,TRUE)
a<-table.element(a, mysum$sigma)
a<-table.row.end(a)
a<-table.row.start(a)
a<-table.element(a, 'Sum Squared Residuals',1,TRUE)
a<-table.element(a, sum(myerror*myerror))
a<-table.row.end(a)
a<-table.end(a)
table.save(a,file='mytable3.tab')
a<-table.start()
a<-table.row.start(a)
a<-table.element(a, 'Multiple Linear Regression - Actuals, Interpolation, and Residuals', 4, TRUE)
a<-table.row.end(a)
a<-table.row.start(a)
a<-table.element(a, 'Time or Index', 1, TRUE)
a<-table.element(a, 'Actuals', 1, TRUE)
a<-table.element(a, 'Interpolation
Forecast', 1, TRUE)
a<-table.element(a, 'Residuals
Prediction Error', 1, TRUE)
a<-table.row.end(a)
for (i in 1:n) {
a<-table.row.start(a)
a<-table.element(a,i, 1, TRUE)
a<-table.element(a,x[i])
a<-table.element(a,x[i]-mysum$resid[i])
a<-table.element(a,mysum$resid[i])
a<-table.row.end(a)
}
a<-table.end(a)
table.save(a,file='mytable4.tab')
if (n > n25) {
a<-table.start()
a<-table.row.start(a)
a<-table.element(a,'Goldfeld-Quandt test for Heteroskedasticity',4,TRUE)
a<-table.row.end(a)
a<-table.row.start(a)
a<-table.element(a,'p-values',header=TRUE)
a<-table.element(a,'Alternative Hypothesis',3,header=TRUE)
a<-table.row.end(a)
a<-table.row.start(a)
a<-table.element(a,'breakpoint index',header=TRUE)
a<-table.element(a,'greater',header=TRUE)
a<-table.element(a,'2-sided',header=TRUE)
a<-table.element(a,'less',header=TRUE)
a<-table.row.end(a)
for (mypoint in kp3:nmkm3) {
a<-table.row.start(a)
a<-table.element(a,mypoint,header=TRUE)
a<-table.element(a,gqarr[mypoint-kp3+1,1])
a<-table.element(a,gqarr[mypoint-kp3+1,2])
a<-table.element(a,gqarr[mypoint-kp3+1,3])
a<-table.row.end(a)
}
a<-table.end(a)
table.save(a,file='mytable5.tab')
a<-table.start()
a<-table.row.start(a)
a<-table.element(a,'Meta Analysis of Goldfeld-Quandt test for Heteroskedasticity',4,TRUE)
a<-table.row.end(a)
a<-table.row.start(a)
a<-table.element(a,'Description',header=TRUE)
a<-table.element(a,'# significant tests',header=TRUE)
a<-table.element(a,'% significant tests',header=TRUE)
a<-table.element(a,'OK/NOK',header=TRUE)
a<-table.row.end(a)
a<-table.row.start(a)
a<-table.element(a,'1% type I error level',header=TRUE)
a<-table.element(a,numsignificant1)
a<-table.element(a,numsignificant1/numgqtests)
if (numsignificant1/numgqtests < 0.01) dum <- 'OK' else dum <- 'NOK'
a<-table.element(a,dum)
a<-table.row.end(a)
a<-table.row.start(a)
a<-table.element(a,'5% type I error level',header=TRUE)
a<-table.element(a,numsignificant5)
a<-table.element(a,numsignificant5/numgqtests)
if (numsignificant5/numgqtests < 0.05) dum <- 'OK' else dum <- 'NOK'
a<-table.element(a,dum)
a<-table.row.end(a)
a<-table.row.start(a)
a<-table.element(a,'10% type I error level',header=TRUE)
a<-table.element(a,numsignificant10)
a<-table.element(a,numsignificant10/numgqtests)
if (numsignificant10/numgqtests < 0.1) dum <- 'OK' else dum <- 'NOK'
a<-table.element(a,dum)
a<-table.row.end(a)
a<-table.end(a)
table.save(a,file='mytable6.tab')
}