Free Statistics

of Irreproducible Research!

Author's title

Author*The author of this computation has been verified*
R Software Modulerwasp_regression_trees1.wasp
Title produced by softwareRecursive Partitioning (Regression Trees)
Date of computationMon, 13 Dec 2010 21:44:07 +0000
Cite this page as followsStatistical Computations at FreeStatistics.org, Office for Research Development and Education, URL https://freestatistics.org/blog/index.php?v=date/2010/Dec/13/t1292276561g9ogweuyd4qv2zw.htm/, Retrieved Mon, 06 May 2024 17:18:58 +0000
Statistical Computations at FreeStatistics.org, Office for Research Development and Education, URL https://freestatistics.org/blog/index.php?pk=109218, Retrieved Mon, 06 May 2024 17:18:58 +0000
QR Codes:

Original text written by user:
IsPrivate?No (this computation is public)
User-defined keywords
Estimated Impact141
Family? (F = Feedback message, R = changed R code, M = changed R Module, P = changed Parameters, D = changed Data)
-     [Recursive Partitioning (Regression Trees)] [] [2010-12-05 18:59:57] [b98453cac15ba1066b407e146608df68]
- R PD    [Recursive Partitioning (Regression Trees)] [Workshop 10; PLC:...] [2010-12-13 21:44:07] [50e0b5177c9c80b42996aa89930b928a] [Current]
Feedback Forum

Post a new message
Dataseries X:
107.11	236.67	8.92	1
122.23	258.1	9.32	2
134.69	241.52	8.9	3
128.79	190.71	8.53	4
126.16	200.32	8.51	5
119.98	223.41	9.03	6
108.45	201.38	9.6	7
108.43	211.83	9.88	8
98.17	224.41	10.81	9
106.09	211.57	11.61	10
108.81	194.77	11.81	11
103.03	201.86	13.93	12
124.36	225	16.19	13
118.52	278.9	18.05	14
112.2	259.74	17.08	15
114.71	230.45	17.46	16
107.96	238.26	16.9	17
101.21	250.14	15.69	18
102.77	263.81	15.86	19
112.13	247.22	12.98	20
109.36	229.81	12.31	21
110.91	224.27	11.51	22
123.57	213.23	11.73	23
129.95	239.57	11.7	24
124.46	249.7	10.9	25
122.34	212.5	10.57	26
116.61	203.27	10.37	27
114.59	192.05	9.59	28
112.52	190.04	9.09	29
118.67	202.05	9.26	30
116.8	211.91	9.9	31
123.63	210.39	9.61	32
128.04	231.25	9.85	33
134.57	224.3	9.99	34
130.33	209.64	9.9	35
136.47	206.05	10.45	36
139.05	229.7	11.66	37
158.21	264.67	13.61	38
148.07	246.29	12.88	39
137.74	260.91	12.52	40
139.74	265.14	10.93	41
144.08	284.52	12.07	42
145.35	287.48	13.21	43
145.77	321.9	13.68	44
140.56	321.59	14.02	45
121.41	282.39	11.7	46
120.44	241	11.83	47
116.97	228.48	11.32	48
128.03	261.59	12.24	49
128.51	270	13.31	50
127.76	262.86	12.93	51
134.58	277.41	13.47	52
147.64	288	15.47	53
144.46	287.14	16.58	54
137.6	337.65	17.8	55
146.87	328.38	21.72	56
145.67	374.41	23.45	57
151.95	344.77	23.16	58
150.23	361.05	22.77	59
155.86	374.22	24.9	60


Summary of computational transaction
Raw Inputview raw input (R code)
Raw Outputview raw output of R engine
Computing time4 seconds
R Server'Sir Ronald Aylmer Fisher' @ 193.190.124.24

\begin{tabular}{lllllllll}
\hline
Summary of computational transaction \tabularnewline
Raw Input & view raw input (R code)  \tabularnewline
Raw Output & view raw output of R engine  \tabularnewline
Computing time & 4 seconds \tabularnewline
R Server & 'Sir Ronald Aylmer Fisher' @ 193.190.124.24 \tabularnewline
\hline
\end{tabular}
%Source: https://freestatistics.org/blog/index.php?pk=109218&T=0

[TABLE]
[ROW][C]Summary of computational transaction[/C][/ROW]
[ROW][C]Raw Input[/C][C]view raw input (R code) [/C][/ROW]
[ROW][C]Raw Output[/C][C]view raw output of R engine [/C][/ROW]
[ROW][C]Computing time[/C][C]4 seconds[/C][/ROW]
[ROW][C]R Server[/C][C]'Sir Ronald Aylmer Fisher' @ 193.190.124.24[/C][/ROW]
[/TABLE]
Source: https://freestatistics.org/blog/index.php?pk=109218&T=0

Globally Unique Identifier (entire table): ba.freestatistics.org/blog/index.php?pk=109218&T=0

As an alternative you can also use a QR Code:  

The GUIDs for individual cells are displayed in the table below:

Summary of computational transaction
Raw Inputview raw input (R code)
Raw Outputview raw output of R engine
Computing time4 seconds
R Server'Sir Ronald Aylmer Fisher' @ 193.190.124.24


Goodness of Fit
Correlation0.8348
R-squared0.6969
RMSE8.3808

\begin{tabular}{lllllllll}
\hline
Goodness of Fit \tabularnewline
Correlation & 0.8348 \tabularnewline
R-squared & 0.6969 \tabularnewline
RMSE & 8.3808 \tabularnewline
\hline
\end{tabular}
%Source: https://freestatistics.org/blog/index.php?pk=109218&T=1

[TABLE]
[ROW][C]Goodness of Fit[/C][/ROW]
[ROW][C]Correlation[/C][C]0.8348[/C][/ROW]
[ROW][C]R-squared[/C][C]0.6969[/C][/ROW]
[ROW][C]RMSE[/C][C]8.3808[/C][/ROW]
[/TABLE]
Source: https://freestatistics.org/blog/index.php?pk=109218&T=1

Globally Unique Identifier (entire table): ba.freestatistics.org/blog/index.php?pk=109218&T=1

As an alternative you can also use a QR Code:  

The GUIDs for individual cells are displayed in the table below:

Goodness of Fit
Correlation0.8348
R-squared0.6969
RMSE8.3808


Actuals, Predictions, and Residuals
#ActualsForecastsResiduals
1107.11115.2878125-8.1778125
2122.23115.28781256.9421875
3134.69115.287812519.4021875
4128.79115.287812513.5021875
5126.16115.287812510.8721875
6119.98115.28781254.6921875
7108.45115.2878125-6.8378125
8108.43115.2878125-6.8578125
998.17115.2878125-17.1178125
10106.09115.2878125-9.1978125
11108.81115.2878125-6.4778125
12103.03115.2878125-12.2578125
13124.36115.28781259.0721875
14118.52115.28781253.23218749999999
15112.2115.2878125-3.0878125
16114.71115.2878125-0.577812500000007
17107.96115.2878125-7.32781250000001
18101.21115.2878125-14.0778125
19102.77115.2878125-12.5178125
20112.13115.2878125-3.15781250000001
21109.36115.2878125-5.9278125
22110.91115.2878125-4.37781250000000
23123.57115.28781258.2821875
24129.95115.287812514.6621875
25124.46115.28781259.1721875
26122.34115.28781257.0521875
27116.61115.28781251.32218750000000
28114.59115.2878125-0.697812499999998
29112.52115.2878125-2.76781250000001
30118.67115.28781253.3821875
31116.8115.28781251.51218750000000
32123.63115.28781258.3421875
33128.04133.008235294118-4.96823529411765
34134.57133.0082352941181.56176470588235
35130.33133.008235294118-2.67823529411763
36136.47133.0082352941183.46176470588236
37139.05133.0082352941186.04176470588237
38158.21147.71090909090910.4990909090909
39148.07133.00823529411815.0617647058824
40137.74133.0082352941184.73176470588237
41139.74133.0082352941186.73176470588237
42144.08133.00823529411811.0717647058824
43145.35133.00823529411812.3417647058824
44145.77147.710909090909-1.94090909090909
45140.56147.710909090909-7.1509090909091
46121.41133.008235294118-11.5982352941176
47120.44133.008235294118-12.5682352941176
48116.97133.008235294118-16.0382352941176
49128.03133.008235294118-4.97823529411764
50128.51133.008235294118-4.49823529411765
51127.76133.008235294118-5.24823529411763
52134.58133.0082352941181.57176470588237
53147.64147.710909090909-0.0709090909091117
54144.46147.710909090909-3.25090909090909
55137.6147.710909090909-10.1109090909091
56146.87147.710909090909-0.840909090909093
57145.67147.710909090909-2.04090909090911
58151.95147.7109090909094.23909090909089
59150.23147.7109090909092.51909090909089
60155.86147.7109090909098.14909090909092

\begin{tabular}{lllllllll}
\hline
Actuals, Predictions, and Residuals \tabularnewline
# & Actuals & Forecasts & Residuals \tabularnewline
1 & 107.11 & 115.2878125 & -8.1778125 \tabularnewline
2 & 122.23 & 115.2878125 & 6.9421875 \tabularnewline
3 & 134.69 & 115.2878125 & 19.4021875 \tabularnewline
4 & 128.79 & 115.2878125 & 13.5021875 \tabularnewline
5 & 126.16 & 115.2878125 & 10.8721875 \tabularnewline
6 & 119.98 & 115.2878125 & 4.6921875 \tabularnewline
7 & 108.45 & 115.2878125 & -6.8378125 \tabularnewline
8 & 108.43 & 115.2878125 & -6.8578125 \tabularnewline
9 & 98.17 & 115.2878125 & -17.1178125 \tabularnewline
10 & 106.09 & 115.2878125 & -9.1978125 \tabularnewline
11 & 108.81 & 115.2878125 & -6.4778125 \tabularnewline
12 & 103.03 & 115.2878125 & -12.2578125 \tabularnewline
13 & 124.36 & 115.2878125 & 9.0721875 \tabularnewline
14 & 118.52 & 115.2878125 & 3.23218749999999 \tabularnewline
15 & 112.2 & 115.2878125 & -3.0878125 \tabularnewline
16 & 114.71 & 115.2878125 & -0.577812500000007 \tabularnewline
17 & 107.96 & 115.2878125 & -7.32781250000001 \tabularnewline
18 & 101.21 & 115.2878125 & -14.0778125 \tabularnewline
19 & 102.77 & 115.2878125 & -12.5178125 \tabularnewline
20 & 112.13 & 115.2878125 & -3.15781250000001 \tabularnewline
21 & 109.36 & 115.2878125 & -5.9278125 \tabularnewline
22 & 110.91 & 115.2878125 & -4.37781250000000 \tabularnewline
23 & 123.57 & 115.2878125 & 8.2821875 \tabularnewline
24 & 129.95 & 115.2878125 & 14.6621875 \tabularnewline
25 & 124.46 & 115.2878125 & 9.1721875 \tabularnewline
26 & 122.34 & 115.2878125 & 7.0521875 \tabularnewline
27 & 116.61 & 115.2878125 & 1.32218750000000 \tabularnewline
28 & 114.59 & 115.2878125 & -0.697812499999998 \tabularnewline
29 & 112.52 & 115.2878125 & -2.76781250000001 \tabularnewline
30 & 118.67 & 115.2878125 & 3.3821875 \tabularnewline
31 & 116.8 & 115.2878125 & 1.51218750000000 \tabularnewline
32 & 123.63 & 115.2878125 & 8.3421875 \tabularnewline
33 & 128.04 & 133.008235294118 & -4.96823529411765 \tabularnewline
34 & 134.57 & 133.008235294118 & 1.56176470588235 \tabularnewline
35 & 130.33 & 133.008235294118 & -2.67823529411763 \tabularnewline
36 & 136.47 & 133.008235294118 & 3.46176470588236 \tabularnewline
37 & 139.05 & 133.008235294118 & 6.04176470588237 \tabularnewline
38 & 158.21 & 147.710909090909 & 10.4990909090909 \tabularnewline
39 & 148.07 & 133.008235294118 & 15.0617647058824 \tabularnewline
40 & 137.74 & 133.008235294118 & 4.73176470588237 \tabularnewline
41 & 139.74 & 133.008235294118 & 6.73176470588237 \tabularnewline
42 & 144.08 & 133.008235294118 & 11.0717647058824 \tabularnewline
43 & 145.35 & 133.008235294118 & 12.3417647058824 \tabularnewline
44 & 145.77 & 147.710909090909 & -1.94090909090909 \tabularnewline
45 & 140.56 & 147.710909090909 & -7.1509090909091 \tabularnewline
46 & 121.41 & 133.008235294118 & -11.5982352941176 \tabularnewline
47 & 120.44 & 133.008235294118 & -12.5682352941176 \tabularnewline
48 & 116.97 & 133.008235294118 & -16.0382352941176 \tabularnewline
49 & 128.03 & 133.008235294118 & -4.97823529411764 \tabularnewline
50 & 128.51 & 133.008235294118 & -4.49823529411765 \tabularnewline
51 & 127.76 & 133.008235294118 & -5.24823529411763 \tabularnewline
52 & 134.58 & 133.008235294118 & 1.57176470588237 \tabularnewline
53 & 147.64 & 147.710909090909 & -0.0709090909091117 \tabularnewline
54 & 144.46 & 147.710909090909 & -3.25090909090909 \tabularnewline
55 & 137.6 & 147.710909090909 & -10.1109090909091 \tabularnewline
56 & 146.87 & 147.710909090909 & -0.840909090909093 \tabularnewline
57 & 145.67 & 147.710909090909 & -2.04090909090911 \tabularnewline
58 & 151.95 & 147.710909090909 & 4.23909090909089 \tabularnewline
59 & 150.23 & 147.710909090909 & 2.51909090909089 \tabularnewline
60 & 155.86 & 147.710909090909 & 8.14909090909092 \tabularnewline
\hline
\end{tabular}
%Source: https://freestatistics.org/blog/index.php?pk=109218&T=2

[TABLE]
[ROW][C]Actuals, Predictions, and Residuals[/C][/ROW]
[ROW][C]#[/C][C]Actuals[/C][C]Forecasts[/C][C]Residuals[/C][/ROW]
[ROW][C]1[/C][C]107.11[/C][C]115.2878125[/C][C]-8.1778125[/C][/ROW]
[ROW][C]2[/C][C]122.23[/C][C]115.2878125[/C][C]6.9421875[/C][/ROW]
[ROW][C]3[/C][C]134.69[/C][C]115.2878125[/C][C]19.4021875[/C][/ROW]
[ROW][C]4[/C][C]128.79[/C][C]115.2878125[/C][C]13.5021875[/C][/ROW]
[ROW][C]5[/C][C]126.16[/C][C]115.2878125[/C][C]10.8721875[/C][/ROW]
[ROW][C]6[/C][C]119.98[/C][C]115.2878125[/C][C]4.6921875[/C][/ROW]
[ROW][C]7[/C][C]108.45[/C][C]115.2878125[/C][C]-6.8378125[/C][/ROW]
[ROW][C]8[/C][C]108.43[/C][C]115.2878125[/C][C]-6.8578125[/C][/ROW]
[ROW][C]9[/C][C]98.17[/C][C]115.2878125[/C][C]-17.1178125[/C][/ROW]
[ROW][C]10[/C][C]106.09[/C][C]115.2878125[/C][C]-9.1978125[/C][/ROW]
[ROW][C]11[/C][C]108.81[/C][C]115.2878125[/C][C]-6.4778125[/C][/ROW]
[ROW][C]12[/C][C]103.03[/C][C]115.2878125[/C][C]-12.2578125[/C][/ROW]
[ROW][C]13[/C][C]124.36[/C][C]115.2878125[/C][C]9.0721875[/C][/ROW]
[ROW][C]14[/C][C]118.52[/C][C]115.2878125[/C][C]3.23218749999999[/C][/ROW]
[ROW][C]15[/C][C]112.2[/C][C]115.2878125[/C][C]-3.0878125[/C][/ROW]
[ROW][C]16[/C][C]114.71[/C][C]115.2878125[/C][C]-0.577812500000007[/C][/ROW]
[ROW][C]17[/C][C]107.96[/C][C]115.2878125[/C][C]-7.32781250000001[/C][/ROW]
[ROW][C]18[/C][C]101.21[/C][C]115.2878125[/C][C]-14.0778125[/C][/ROW]
[ROW][C]19[/C][C]102.77[/C][C]115.2878125[/C][C]-12.5178125[/C][/ROW]
[ROW][C]20[/C][C]112.13[/C][C]115.2878125[/C][C]-3.15781250000001[/C][/ROW]
[ROW][C]21[/C][C]109.36[/C][C]115.2878125[/C][C]-5.9278125[/C][/ROW]
[ROW][C]22[/C][C]110.91[/C][C]115.2878125[/C][C]-4.37781250000000[/C][/ROW]
[ROW][C]23[/C][C]123.57[/C][C]115.2878125[/C][C]8.2821875[/C][/ROW]
[ROW][C]24[/C][C]129.95[/C][C]115.2878125[/C][C]14.6621875[/C][/ROW]
[ROW][C]25[/C][C]124.46[/C][C]115.2878125[/C][C]9.1721875[/C][/ROW]
[ROW][C]26[/C][C]122.34[/C][C]115.2878125[/C][C]7.0521875[/C][/ROW]
[ROW][C]27[/C][C]116.61[/C][C]115.2878125[/C][C]1.32218750000000[/C][/ROW]
[ROW][C]28[/C][C]114.59[/C][C]115.2878125[/C][C]-0.697812499999998[/C][/ROW]
[ROW][C]29[/C][C]112.52[/C][C]115.2878125[/C][C]-2.76781250000001[/C][/ROW]
[ROW][C]30[/C][C]118.67[/C][C]115.2878125[/C][C]3.3821875[/C][/ROW]
[ROW][C]31[/C][C]116.8[/C][C]115.2878125[/C][C]1.51218750000000[/C][/ROW]
[ROW][C]32[/C][C]123.63[/C][C]115.2878125[/C][C]8.3421875[/C][/ROW]
[ROW][C]33[/C][C]128.04[/C][C]133.008235294118[/C][C]-4.96823529411765[/C][/ROW]
[ROW][C]34[/C][C]134.57[/C][C]133.008235294118[/C][C]1.56176470588235[/C][/ROW]
[ROW][C]35[/C][C]130.33[/C][C]133.008235294118[/C][C]-2.67823529411763[/C][/ROW]
[ROW][C]36[/C][C]136.47[/C][C]133.008235294118[/C][C]3.46176470588236[/C][/ROW]
[ROW][C]37[/C][C]139.05[/C][C]133.008235294118[/C][C]6.04176470588237[/C][/ROW]
[ROW][C]38[/C][C]158.21[/C][C]147.710909090909[/C][C]10.4990909090909[/C][/ROW]
[ROW][C]39[/C][C]148.07[/C][C]133.008235294118[/C][C]15.0617647058824[/C][/ROW]
[ROW][C]40[/C][C]137.74[/C][C]133.008235294118[/C][C]4.73176470588237[/C][/ROW]
[ROW][C]41[/C][C]139.74[/C][C]133.008235294118[/C][C]6.73176470588237[/C][/ROW]
[ROW][C]42[/C][C]144.08[/C][C]133.008235294118[/C][C]11.0717647058824[/C][/ROW]
[ROW][C]43[/C][C]145.35[/C][C]133.008235294118[/C][C]12.3417647058824[/C][/ROW]
[ROW][C]44[/C][C]145.77[/C][C]147.710909090909[/C][C]-1.94090909090909[/C][/ROW]
[ROW][C]45[/C][C]140.56[/C][C]147.710909090909[/C][C]-7.1509090909091[/C][/ROW]
[ROW][C]46[/C][C]121.41[/C][C]133.008235294118[/C][C]-11.5982352941176[/C][/ROW]
[ROW][C]47[/C][C]120.44[/C][C]133.008235294118[/C][C]-12.5682352941176[/C][/ROW]
[ROW][C]48[/C][C]116.97[/C][C]133.008235294118[/C][C]-16.0382352941176[/C][/ROW]
[ROW][C]49[/C][C]128.03[/C][C]133.008235294118[/C][C]-4.97823529411764[/C][/ROW]
[ROW][C]50[/C][C]128.51[/C][C]133.008235294118[/C][C]-4.49823529411765[/C][/ROW]
[ROW][C]51[/C][C]127.76[/C][C]133.008235294118[/C][C]-5.24823529411763[/C][/ROW]
[ROW][C]52[/C][C]134.58[/C][C]133.008235294118[/C][C]1.57176470588237[/C][/ROW]
[ROW][C]53[/C][C]147.64[/C][C]147.710909090909[/C][C]-0.0709090909091117[/C][/ROW]
[ROW][C]54[/C][C]144.46[/C][C]147.710909090909[/C][C]-3.25090909090909[/C][/ROW]
[ROW][C]55[/C][C]137.6[/C][C]147.710909090909[/C][C]-10.1109090909091[/C][/ROW]
[ROW][C]56[/C][C]146.87[/C][C]147.710909090909[/C][C]-0.840909090909093[/C][/ROW]
[ROW][C]57[/C][C]145.67[/C][C]147.710909090909[/C][C]-2.04090909090911[/C][/ROW]
[ROW][C]58[/C][C]151.95[/C][C]147.710909090909[/C][C]4.23909090909089[/C][/ROW]
[ROW][C]59[/C][C]150.23[/C][C]147.710909090909[/C][C]2.51909090909089[/C][/ROW]
[ROW][C]60[/C][C]155.86[/C][C]147.710909090909[/C][C]8.14909090909092[/C][/ROW]
[/TABLE]
Source: https://freestatistics.org/blog/index.php?pk=109218&T=2

Globally Unique Identifier (entire table): ba.freestatistics.org/blog/index.php?pk=109218&T=2

As an alternative you can also use a QR Code:  

The GUIDs for individual cells are displayed in the table below:

Actuals, Predictions, and Residuals
#ActualsForecastsResiduals
1107.11115.2878125-8.1778125
2122.23115.28781256.9421875
3134.69115.287812519.4021875
4128.79115.287812513.5021875
5126.16115.287812510.8721875
6119.98115.28781254.6921875
7108.45115.2878125-6.8378125
8108.43115.2878125-6.8578125
998.17115.2878125-17.1178125
10106.09115.2878125-9.1978125
11108.81115.2878125-6.4778125
12103.03115.2878125-12.2578125
13124.36115.28781259.0721875
14118.52115.28781253.23218749999999
15112.2115.2878125-3.0878125
16114.71115.2878125-0.577812500000007
17107.96115.2878125-7.32781250000001
18101.21115.2878125-14.0778125
19102.77115.2878125-12.5178125
20112.13115.2878125-3.15781250000001
21109.36115.2878125-5.9278125
22110.91115.2878125-4.37781250000000
23123.57115.28781258.2821875
24129.95115.287812514.6621875
25124.46115.28781259.1721875
26122.34115.28781257.0521875
27116.61115.28781251.32218750000000
28114.59115.2878125-0.697812499999998
29112.52115.2878125-2.76781250000001
30118.67115.28781253.3821875
31116.8115.28781251.51218750000000
32123.63115.28781258.3421875
33128.04133.008235294118-4.96823529411765
34134.57133.0082352941181.56176470588235
35130.33133.008235294118-2.67823529411763
36136.47133.0082352941183.46176470588236
37139.05133.0082352941186.04176470588237
38158.21147.71090909090910.4990909090909
39148.07133.00823529411815.0617647058824
40137.74133.0082352941184.73176470588237
41139.74133.0082352941186.73176470588237
42144.08133.00823529411811.0717647058824
43145.35133.00823529411812.3417647058824
44145.77147.710909090909-1.94090909090909
45140.56147.710909090909-7.1509090909091
46121.41133.008235294118-11.5982352941176
47120.44133.008235294118-12.5682352941176
48116.97133.008235294118-16.0382352941176
49128.03133.008235294118-4.97823529411764
50128.51133.008235294118-4.49823529411765
51127.76133.008235294118-5.24823529411763
52134.58133.0082352941181.57176470588237
53147.64147.710909090909-0.0709090909091117
54144.46147.710909090909-3.25090909090909
55137.6147.710909090909-10.1109090909091
56146.87147.710909090909-0.840909090909093
57145.67147.710909090909-2.04090909090911
58151.95147.7109090909094.23909090909089
59150.23147.7109090909092.51909090909089
60155.86147.7109090909098.14909090909092


Parameters (Session):
par2 = none ; par4 = no ;
Parameters (R input):
par1 = 1 ; par2 = none ; par3 = ; par4 = no ;
R code (references can be found in the software module):
library(party)
library(Hmisc)
par1 <- as.numeric(par1)
par3 <- as.numeric(par3)
x <- data.frame(t(y))
is.data.frame(x)
x <- x[!is.na(x[,par1]),]
k <- length(x[1,])
n <- length(x[,1])
colnames(x)[par1]
x[,par1]
if (par2 == 'kmeans') {
cl <- kmeans(x[,par1], par3)
print(cl)
clm <- matrix(cbind(cl$centers,1:par3),ncol=2)
clm <- clm[sort.list(clm[,1]),]
for (i in 1:par3) {
cl$cluster[cl$cluster==clm[i,2]] <- paste('C',i,sep='')
}
cl$cluster <- as.factor(cl$cluster)
print(cl$cluster)
x[,par1] <- cl$cluster
}
if (par2 == 'quantiles') {
x[,par1] <- cut2(x[,par1],g=par3)
}
if (par2 == 'hclust') {
hc <- hclust(dist(x[,par1])^2, 'cen')
print(hc)
memb <- cutree(hc, k = par3)
dum <- c(mean(x[memb==1,par1]))
for (i in 2:par3) {
dum <- c(dum, mean(x[memb==i,par1]))
}
hcm <- matrix(cbind(dum,1:par3),ncol=2)
hcm <- hcm[sort.list(hcm[,1]),]
for (i in 1:par3) {
memb[memb==hcm[i,2]] <- paste('C',i,sep='')
}
memb <- as.factor(memb)
print(memb)
x[,par1] <- memb
}
if (par2=='equal') {
ed <- cut(as.numeric(x[,par1]),par3,labels=paste('C',1:par3,sep=''))
x[,par1] <- as.factor(ed)
}
table(x[,par1])
colnames(x)
colnames(x)[par1]
x[,par1]
if (par2 == 'none') {
m <- ctree(as.formula(paste(colnames(x)[par1],' ~ .',sep='')),data = x)
}
load(file='createtable')
if (par2 != 'none') {
m <- ctree(as.formula(paste('as.factor(',colnames(x)[par1],') ~ .',sep='')),data = x)
if (par4=='yes') {
a<-table.start()
a<-table.row.start(a)
a<-table.element(a,'10-Fold Cross Validation',3+2*par3,TRUE)
a<-table.row.end(a)
a<-table.row.start(a)
a<-table.element(a,'',1,TRUE)
a<-table.element(a,'Prediction (training)',par3+1,TRUE)
a<-table.element(a,'Prediction (testing)',par3+1,TRUE)
a<-table.row.end(a)
a<-table.row.start(a)
a<-table.element(a,'Actual',1,TRUE)
for (jjj in 1:par3) a<-table.element(a,paste('C',jjj,sep=''),1,TRUE)
a<-table.element(a,'CV',1,TRUE)
for (jjj in 1:par3) a<-table.element(a,paste('C',jjj,sep=''),1,TRUE)
a<-table.element(a,'CV',1,TRUE)
a<-table.row.end(a)
for (i in 1:10) {
ind <- sample(2, nrow(x), replace=T, prob=c(0.9,0.1))
m.ct <- ctree(as.formula(paste('as.factor(',colnames(x)[par1],') ~ .',sep='')),data =x[ind==1,])
if (i==1) {
m.ct.i.pred <- predict(m.ct, newdata=x[ind==1,])
m.ct.i.actu <- x[ind==1,par1]
m.ct.x.pred <- predict(m.ct, newdata=x[ind==2,])
m.ct.x.actu <- x[ind==2,par1]
} else {
m.ct.i.pred <- c(m.ct.i.pred,predict(m.ct, newdata=x[ind==1,]))
m.ct.i.actu <- c(m.ct.i.actu,x[ind==1,par1])
m.ct.x.pred <- c(m.ct.x.pred,predict(m.ct, newdata=x[ind==2,]))
m.ct.x.actu <- c(m.ct.x.actu,x[ind==2,par1])
}
}
print(m.ct.i.tab <- table(m.ct.i.actu,m.ct.i.pred))
numer <- 0
for (i in 1:par3) {
print(m.ct.i.tab[i,i] / sum(m.ct.i.tab[i,]))
numer <- numer + m.ct.i.tab[i,i]
}
print(m.ct.i.cp <- numer / sum(m.ct.i.tab))
print(m.ct.x.tab <- table(m.ct.x.actu,m.ct.x.pred))
numer <- 0
for (i in 1:par3) {
print(m.ct.x.tab[i,i] / sum(m.ct.x.tab[i,]))
numer <- numer + m.ct.x.tab[i,i]
}
print(m.ct.x.cp <- numer / sum(m.ct.x.tab))
for (i in 1:par3) {
a<-table.row.start(a)
a<-table.element(a,paste('C',i,sep=''),1,TRUE)
for (jjj in 1:par3) a<-table.element(a,m.ct.i.tab[i,jjj])
a<-table.element(a,round(m.ct.i.tab[i,i]/sum(m.ct.i.tab[i,]),4))
for (jjj in 1:par3) a<-table.element(a,m.ct.x.tab[i,jjj])
a<-table.element(a,round(m.ct.x.tab[i,i]/sum(m.ct.x.tab[i,]),4))
a<-table.row.end(a)
}
a<-table.row.start(a)
a<-table.element(a,'Overall',1,TRUE)
for (jjj in 1:par3) a<-table.element(a,'-')
a<-table.element(a,round(m.ct.i.cp,4))
for (jjj in 1:par3) a<-table.element(a,'-')
a<-table.element(a,round(m.ct.x.cp,4))
a<-table.row.end(a)
a<-table.end(a)
table.save(a,file='mytable3.tab')
}
}
m
bitmap(file='test1.png')
plot(m)
dev.off()
bitmap(file='test1a.png')
plot(x[,par1] ~ as.factor(where(m)),main='Response by Terminal Node',xlab='Terminal Node',ylab='Response')
dev.off()
if (par2 == 'none') {
forec <- predict(m)
result <- as.data.frame(cbind(x[,par1],forec,x[,par1]-forec))
colnames(result) <- c('Actuals','Forecasts','Residuals')
print(result)
}
if (par2 != 'none') {
print(cbind(as.factor(x[,par1]),predict(m)))
myt <- table(as.factor(x[,par1]),predict(m))
print(myt)
}
bitmap(file='test2.png')
if(par2=='none') {
op <- par(mfrow=c(2,2))
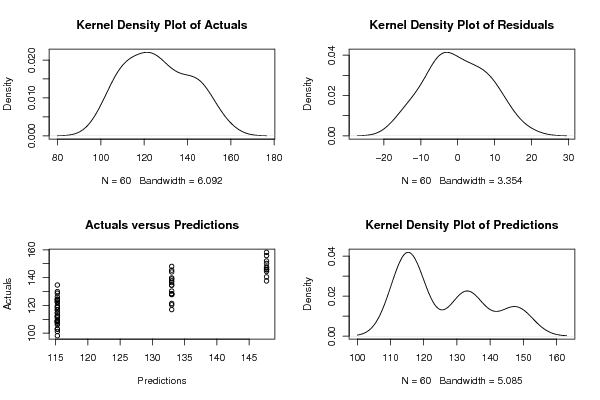
plot(density(result$Actuals),main='Kernel Density Plot of Actuals')
plot(density(result$Residuals),main='Kernel Density Plot of Residuals')
plot(result$Forecasts,result$Actuals,main='Actuals versus Predictions',xlab='Predictions',ylab='Actuals')
plot(density(result$Forecasts),main='Kernel Density Plot of Predictions')
par(op)
}
if(par2!='none') {
plot(myt,main='Confusion Matrix',xlab='Actual',ylab='Predicted')
}
dev.off()
if (par2 == 'none') {
detcoef <- cor(result$Forecasts,result$Actuals)
a<-table.start()
a<-table.row.start(a)
a<-table.element(a,'Goodness of Fit',2,TRUE)
a<-table.row.end(a)
a<-table.row.start(a)
a<-table.element(a,'Correlation',1,TRUE)
a<-table.element(a,round(detcoef,4))
a<-table.row.end(a)
a<-table.row.start(a)
a<-table.element(a,'R-squared',1,TRUE)
a<-table.element(a,round(detcoef*detcoef,4))
a<-table.row.end(a)
a<-table.row.start(a)
a<-table.element(a,'RMSE',1,TRUE)
a<-table.element(a,round(sqrt(mean((result$Residuals)^2)),4))
a<-table.row.end(a)
a<-table.end(a)
table.save(a,file='mytable1.tab')
a<-table.start()
a<-table.row.start(a)
a<-table.element(a,'Actuals, Predictions, and Residuals',4,TRUE)
a<-table.row.end(a)
a<-table.row.start(a)
a<-table.element(a,'#',header=TRUE)
a<-table.element(a,'Actuals',header=TRUE)
a<-table.element(a,'Forecasts',header=TRUE)
a<-table.element(a,'Residuals',header=TRUE)
a<-table.row.end(a)
for (i in 1:length(result$Actuals)) {
a<-table.row.start(a)
a<-table.element(a,i,header=TRUE)
a<-table.element(a,result$Actuals[i])
a<-table.element(a,result$Forecasts[i])
a<-table.element(a,result$Residuals[i])
a<-table.row.end(a)
}
a<-table.end(a)
table.save(a,file='mytable.tab')
}
if (par2 != 'none') {
a<-table.start()
a<-table.row.start(a)
a<-table.element(a,'Confusion Matrix (predicted in columns / actuals in rows)',par3+1,TRUE)
a<-table.row.end(a)
a<-table.row.start(a)
a<-table.element(a,'',1,TRUE)
for (i in 1:par3) {
a<-table.element(a,paste('C',i,sep=''),1,TRUE)
}
a<-table.row.end(a)
for (i in 1:par3) {
a<-table.row.start(a)
a<-table.element(a,paste('C',i,sep=''),1,TRUE)
for (j in 1:par3) {
a<-table.element(a,myt[i,j])
}
a<-table.row.end(a)
}
a<-table.end(a)
table.save(a,file='mytable2.tab')
}