Free Statistics

of Irreproducible Research!

Author's title

Author*The author of this computation has been verified*
R Software Modulerwasp_multipleregression.wasp
Title produced by softwareMultiple Regression
Date of computationMon, 13 Dec 2010 21:38:20 +0000
Cite this page as followsStatistical Computations at FreeStatistics.org, Office for Research Development and Education, URL https://freestatistics.org/blog/index.php?v=date/2010/Dec/13/t1292276252bh2esqkcqhd4zt8.htm/, Retrieved Mon, 06 May 2024 22:39:42 +0000
Statistical Computations at FreeStatistics.org, Office for Research Development and Education, URL https://freestatistics.org/blog/index.php?pk=109216, Retrieved Mon, 06 May 2024 22:39:42 +0000
QR Codes:

Original text written by user:
IsPrivate?No (this computation is public)
User-defined keywords
Estimated Impact117
Family? (F = Feedback message, R = changed R code, M = changed R Module, P = changed Parameters, D = changed Data)
-     [Multiple Regression] [] [2010-12-05 18:56:24] [b98453cac15ba1066b407e146608df68]
- R PD    [Multiple Regression] [Workshop 10; PLC:...] [2010-12-13 21:38:20] [50e0b5177c9c80b42996aa89930b928a] [Current]
Feedback Forum

Post a new message
Dataseries X:
107.11	236.67	8.92	1
122.23	258.1	9.32	2
134.69	241.52	8.9	3
128.79	190.71	8.53	4
126.16	200.32	8.51	5
119.98	223.41	9.03	6
108.45	201.38	9.6	7
108.43	211.83	9.88	8
98.17	224.41	10.81	9
106.09	211.57	11.61	10
108.81	194.77	11.81	11
103.03	201.86	13.93	12
124.36	225	16.19	13
118.52	278.9	18.05	14
112.2	259.74	17.08	15
114.71	230.45	17.46	16
107.96	238.26	16.9	17
101.21	250.14	15.69	18
102.77	263.81	15.86	19
112.13	247.22	12.98	20
109.36	229.81	12.31	21
110.91	224.27	11.51	22
123.57	213.23	11.73	23
129.95	239.57	11.7	24
124.46	249.7	10.9	25
122.34	212.5	10.57	26
116.61	203.27	10.37	27
114.59	192.05	9.59	28
112.52	190.04	9.09	29
118.67	202.05	9.26	30
116.8	211.91	9.9	31
123.63	210.39	9.61	32
128.04	231.25	9.85	33
134.57	224.3	9.99	34
130.33	209.64	9.9	35
136.47	206.05	10.45	36
139.05	229.7	11.66	37
158.21	264.67	13.61	38
148.07	246.29	12.88	39
137.74	260.91	12.52	40
139.74	265.14	10.93	41
144.08	284.52	12.07	42
145.35	287.48	13.21	43
145.77	321.9	13.68	44
140.56	321.59	14.02	45
121.41	282.39	11.7	46
120.44	241	11.83	47
116.97	228.48	11.32	48
128.03	261.59	12.24	49
128.51	270	13.31	50
127.76	262.86	12.93	51
134.58	277.41	13.47	52
147.64	288	15.47	53
144.46	287.14	16.58	54
137.6	337.65	17.8	55
146.87	328.38	21.72	56
145.67	374.41	23.45	57
151.95	344.77	23.16	58
150.23	361.05	22.77	59
155.86	374.22	24.9	60


Summary of computational transaction
Raw Inputview raw input (R code)
Raw Outputview raw output of R engine
Computing time6 seconds
R Server'RServer@AstonUniversity' @ vre.aston.ac.uk

\begin{tabular}{lllllllll}
\hline
Summary of computational transaction \tabularnewline
Raw Input & view raw input (R code)  \tabularnewline
Raw Output & view raw output of R engine  \tabularnewline
Computing time & 6 seconds \tabularnewline
R Server & 'RServer@AstonUniversity' @ vre.aston.ac.uk \tabularnewline
\hline
\end{tabular}
%Source: https://freestatistics.org/blog/index.php?pk=109216&T=0

[TABLE]
[ROW][C]Summary of computational transaction[/C][/ROW]
[ROW][C]Raw Input[/C][C]view raw input (R code) [/C][/ROW]
[ROW][C]Raw Output[/C][C]view raw output of R engine [/C][/ROW]
[ROW][C]Computing time[/C][C]6 seconds[/C][/ROW]
[ROW][C]R Server[/C][C]'RServer@AstonUniversity' @ vre.aston.ac.uk[/C][/ROW]
[/TABLE]
Source: https://freestatistics.org/blog/index.php?pk=109216&T=0

Globally Unique Identifier (entire table): ba.freestatistics.org/blog/index.php?pk=109216&T=0

As an alternative you can also use a QR Code:  

The GUIDs for individual cells are displayed in the table below:

Summary of computational transaction
Raw Inputview raw input (R code)
Raw Outputview raw output of R engine
Computing time6 seconds
R Server'RServer@AstonUniversity' @ vre.aston.ac.uk


Multiple Linear Regression - Estimated Regression Equation
Coffee[t] = + 81.5751802572647 + 0.18546007848443Tea[t] -1.11064247481463Sugar[t] + 0.416890792681842Month[t] + e[t]

\begin{tabular}{lllllllll}
\hline
Multiple Linear Regression - Estimated Regression Equation \tabularnewline
Coffee[t] =  +  81.5751802572647 +  0.18546007848443Tea[t] -1.11064247481463Sugar[t] +  0.416890792681842Month[t]  + e[t] \tabularnewline
\hline
\end{tabular}
%Source: https://freestatistics.org/blog/index.php?pk=109216&T=1

[TABLE]
[ROW][C]Multiple Linear Regression - Estimated Regression Equation[/C][/ROW]
[ROW][C]Coffee[t] =  +  81.5751802572647 +  0.18546007848443Tea[t] -1.11064247481463Sugar[t] +  0.416890792681842Month[t]  + e[t][/C][/ROW]
[/TABLE]
Source: https://freestatistics.org/blog/index.php?pk=109216&T=1

Globally Unique Identifier (entire table): ba.freestatistics.org/blog/index.php?pk=109216&T=1

As an alternative you can also use a QR Code:  

The GUIDs for individual cells are displayed in the table below:

Multiple Linear Regression - Estimated Regression Equation
Coffee[t] = + 81.5751802572647 + 0.18546007848443Tea[t] -1.11064247481463Sugar[t] + 0.416890792681842Month[t] + e[t]


Multiple Linear Regression - Ordinary Least Squares
VariableParameterS.D.T-STATH0: parameter = 02-tail p-value1-tail p-value
(Intercept)81.57518025726478.3812599.73300
Tea0.185460078484430.0562683.2960.0017060.000853
Sugar-1.110642474814630.560667-1.98090.0525180.026259
Month0.4168907926818420.1037654.01760.0001778.9e-05

\begin{tabular}{lllllllll}
\hline
Multiple Linear Regression - Ordinary Least Squares \tabularnewline
Variable & Parameter & S.D. & T-STATH0: parameter = 0 & 2-tail p-value & 1-tail p-value \tabularnewline
(Intercept) & 81.5751802572647 & 8.381259 & 9.733 & 0 & 0 \tabularnewline
Tea & 0.18546007848443 & 0.056268 & 3.296 & 0.001706 & 0.000853 \tabularnewline
Sugar & -1.11064247481463 & 0.560667 & -1.9809 & 0.052518 & 0.026259 \tabularnewline
Month & 0.416890792681842 & 0.103765 & 4.0176 & 0.000177 & 8.9e-05 \tabularnewline
\hline
\end{tabular}
%Source: https://freestatistics.org/blog/index.php?pk=109216&T=2

[TABLE]
[ROW][C]Multiple Linear Regression - Ordinary Least Squares[/C][/ROW]
[ROW][C]Variable[/C][C]Parameter[/C][C]S.D.[/C][C]T-STATH0: parameter = 0[/C][C]2-tail p-value[/C][C]1-tail p-value[/C][/ROW]
[ROW][C](Intercept)[/C][C]81.5751802572647[/C][C]8.381259[/C][C]9.733[/C][C]0[/C][C]0[/C][/ROW]
[ROW][C]Tea[/C][C]0.18546007848443[/C][C]0.056268[/C][C]3.296[/C][C]0.001706[/C][C]0.000853[/C][/ROW]
[ROW][C]Sugar[/C][C]-1.11064247481463[/C][C]0.560667[/C][C]-1.9809[/C][C]0.052518[/C][C]0.026259[/C][/ROW]
[ROW][C]Month[/C][C]0.416890792681842[/C][C]0.103765[/C][C]4.0176[/C][C]0.000177[/C][C]8.9e-05[/C][/ROW]
[/TABLE]
Source: https://freestatistics.org/blog/index.php?pk=109216&T=2

Globally Unique Identifier (entire table): ba.freestatistics.org/blog/index.php?pk=109216&T=2

As an alternative you can also use a QR Code:  

The GUIDs for individual cells are displayed in the table below:

Multiple Linear Regression - Ordinary Least Squares
VariableParameterS.D.T-STATH0: parameter = 02-tail p-value1-tail p-value
(Intercept)81.57518025726478.3812599.73300
Tea0.185460078484430.0562683.2960.0017060.000853
Sugar-1.110642474814630.560667-1.98090.0525180.026259
Month0.4168907926818420.1037654.01760.0001778.9e-05


Multiple Linear Regression - Regression Statistics
Multiple R0.768876611917088
R-squared0.5911712443531
Adjusted R-squared0.569269703872017
F-TEST (value)26.9922220705748
F-TEST (DF numerator)3
F-TEST (DF denominator)56
p-value6.25013374389027e-11
Multiple Linear Regression - Residual Statistics
Residual Standard Deviation10.0744787349589
Sum Squared Residuals5683.72681974376

\begin{tabular}{lllllllll}
\hline
Multiple Linear Regression - Regression Statistics \tabularnewline
Multiple R & 0.768876611917088 \tabularnewline
R-squared & 0.5911712443531 \tabularnewline
Adjusted R-squared & 0.569269703872017 \tabularnewline
F-TEST (value) & 26.9922220705748 \tabularnewline
F-TEST (DF numerator) & 3 \tabularnewline
F-TEST (DF denominator) & 56 \tabularnewline
p-value & 6.25013374389027e-11 \tabularnewline
Multiple Linear Regression - Residual Statistics \tabularnewline
Residual Standard Deviation & 10.0744787349589 \tabularnewline
Sum Squared Residuals & 5683.72681974376 \tabularnewline
\hline
\end{tabular}
%Source: https://freestatistics.org/blog/index.php?pk=109216&T=3

[TABLE]
[ROW][C]Multiple Linear Regression - Regression Statistics[/C][/ROW]
[ROW][C]Multiple R[/C][C]0.768876611917088[/C][/ROW]
[ROW][C]R-squared[/C][C]0.5911712443531[/C][/ROW]
[ROW][C]Adjusted R-squared[/C][C]0.569269703872017[/C][/ROW]
[ROW][C]F-TEST (value)[/C][C]26.9922220705748[/C][/ROW]
[ROW][C]F-TEST (DF numerator)[/C][C]3[/C][/ROW]
[ROW][C]F-TEST (DF denominator)[/C][C]56[/C][/ROW]
[ROW][C]p-value[/C][C]6.25013374389027e-11[/C][/ROW]
[ROW][C]Multiple Linear Regression - Residual Statistics[/C][/ROW]
[ROW][C]Residual Standard Deviation[/C][C]10.0744787349589[/C][/ROW]
[ROW][C]Sum Squared Residuals[/C][C]5683.72681974376[/C][/ROW]
[/TABLE]
Source: https://freestatistics.org/blog/index.php?pk=109216&T=3

Globally Unique Identifier (entire table): ba.freestatistics.org/blog/index.php?pk=109216&T=3

As an alternative you can also use a QR Code:  

The GUIDs for individual cells are displayed in the table below:

Multiple Linear Regression - Regression Statistics
Multiple R0.768876611917088
R-squared0.5911712443531
Adjusted R-squared0.569269703872017
F-TEST (value)26.9922220705748
F-TEST (DF numerator)3
F-TEST (DF denominator)56
p-value6.25013374389027e-11
Multiple Linear Regression - Residual Statistics
Residual Standard Deviation10.0744787349589
Sum Squared Residuals5683.72681974376


Multiple Linear Regression - Actuals, Interpolation, and Residuals
Time or IndexActualsInterpolationForecastResidualsPrediction Error
1107.11115.97797694951-8.86797694951014
2122.23119.9250202341872.30497976581255
3134.69117.7334527650216.9565472349804
4128.79109.13805468558919.6519453144111
5126.16111.35942968200214.8005703179976
6119.98115.4810595999864.49894040001384
7108.45111.179198653012-2.72919865301167
8108.43113.223167372908-4.79316737290771
998.17114.940248451346-16.7702484513461
10106.09112.087317856436-5.99731785643614
11108.81109.166350835617-0.356350835616631
12103.03108.543591538146-5.51359153814608
13124.36110.74197655387713.6180234461234
14118.52119.089370573714-0.569370573713992
15112.2117.030169463204-4.83016946320434
16114.71111.5928904166483.11710958335233
17107.96114.080184208189-6.1201842081891
18101.21118.044218127792-16.8342181277917
19102.77120.807538972637-18.0375389726372
20112.13121.346297390728-9.21629739072846
21109.36119.278458675122-9.91845867512217
22110.91119.556414612852-8.64641461285197
23123.57117.6814847946065.88851520539351
24129.95123.0167133288136.93328667118734
25124.46126.200828696393-1.74082869639347
26122.34120.0851165861432.25488341385666
27116.61119.012339349377-2.40233934937682
28114.59118.214669191819-3.62466919181876
29112.52118.814106464154-6.29410646415421
30118.67121.269563578716-2.59956357871557
31116.8122.804279561373-6.00427956137254
32123.63123.2613573524540.368642647545714
33128.04127.2803911883660.759608811634165
34134.57126.2528444891078.31715551089315
35130.33124.050848353946.27915164605977
36136.47123.19108410371513.2789158962851
37139.05126.65022835802812.3997716419722
38158.21131.38690526942226.8230947305783
39148.07129.20580882617418.8641911738256
40137.74132.7339572572325.00604274276814
41139.74135.7012657168584.03873428314191
42144.08138.446240409285.6337595907205
43145.35138.1459606129877.20403938701339
44145.77144.424385343941.34561465606036
45140.56144.406165070854-3.84616507085434
46121.41140.129711328516-18.7197113285165
47120.44132.726025951002-12.2860259510018
48116.97131.387384223214-14.4173842232141
49128.03136.923067137686-8.89306713768594
50128.51137.71128974237-9.2012897423702
51127.76137.226039715103-9.46603971510276
52134.58139.741627713333-5.16162771333316
53147.64139.9012557875367.73874421246412
54144.46138.9258377656775.53416223432315
55137.6147.355333303333-9.75533330333343
56146.87141.6992906671915.17070933280874
57145.67148.731497391082-3.06149739108214
58151.95143.9734377751827.9765622248183
59150.23147.8427692107682.38723078923222
60155.86148.3365007657347.52349923426561

\begin{tabular}{lllllllll}
\hline
Multiple Linear Regression - Actuals, Interpolation, and Residuals \tabularnewline
Time or Index & Actuals & InterpolationForecast & ResidualsPrediction Error \tabularnewline
1 & 107.11 & 115.97797694951 & -8.86797694951014 \tabularnewline
2 & 122.23 & 119.925020234187 & 2.30497976581255 \tabularnewline
3 & 134.69 & 117.73345276502 & 16.9565472349804 \tabularnewline
4 & 128.79 & 109.138054685589 & 19.6519453144111 \tabularnewline
5 & 126.16 & 111.359429682002 & 14.8005703179976 \tabularnewline
6 & 119.98 & 115.481059599986 & 4.49894040001384 \tabularnewline
7 & 108.45 & 111.179198653012 & -2.72919865301167 \tabularnewline
8 & 108.43 & 113.223167372908 & -4.79316737290771 \tabularnewline
9 & 98.17 & 114.940248451346 & -16.7702484513461 \tabularnewline
10 & 106.09 & 112.087317856436 & -5.99731785643614 \tabularnewline
11 & 108.81 & 109.166350835617 & -0.356350835616631 \tabularnewline
12 & 103.03 & 108.543591538146 & -5.51359153814608 \tabularnewline
13 & 124.36 & 110.741976553877 & 13.6180234461234 \tabularnewline
14 & 118.52 & 119.089370573714 & -0.569370573713992 \tabularnewline
15 & 112.2 & 117.030169463204 & -4.83016946320434 \tabularnewline
16 & 114.71 & 111.592890416648 & 3.11710958335233 \tabularnewline
17 & 107.96 & 114.080184208189 & -6.1201842081891 \tabularnewline
18 & 101.21 & 118.044218127792 & -16.8342181277917 \tabularnewline
19 & 102.77 & 120.807538972637 & -18.0375389726372 \tabularnewline
20 & 112.13 & 121.346297390728 & -9.21629739072846 \tabularnewline
21 & 109.36 & 119.278458675122 & -9.91845867512217 \tabularnewline
22 & 110.91 & 119.556414612852 & -8.64641461285197 \tabularnewline
23 & 123.57 & 117.681484794606 & 5.88851520539351 \tabularnewline
24 & 129.95 & 123.016713328813 & 6.93328667118734 \tabularnewline
25 & 124.46 & 126.200828696393 & -1.74082869639347 \tabularnewline
26 & 122.34 & 120.085116586143 & 2.25488341385666 \tabularnewline
27 & 116.61 & 119.012339349377 & -2.40233934937682 \tabularnewline
28 & 114.59 & 118.214669191819 & -3.62466919181876 \tabularnewline
29 & 112.52 & 118.814106464154 & -6.29410646415421 \tabularnewline
30 & 118.67 & 121.269563578716 & -2.59956357871557 \tabularnewline
31 & 116.8 & 122.804279561373 & -6.00427956137254 \tabularnewline
32 & 123.63 & 123.261357352454 & 0.368642647545714 \tabularnewline
33 & 128.04 & 127.280391188366 & 0.759608811634165 \tabularnewline
34 & 134.57 & 126.252844489107 & 8.31715551089315 \tabularnewline
35 & 130.33 & 124.05084835394 & 6.27915164605977 \tabularnewline
36 & 136.47 & 123.191084103715 & 13.2789158962851 \tabularnewline
37 & 139.05 & 126.650228358028 & 12.3997716419722 \tabularnewline
38 & 158.21 & 131.386905269422 & 26.8230947305783 \tabularnewline
39 & 148.07 & 129.205808826174 & 18.8641911738256 \tabularnewline
40 & 137.74 & 132.733957257232 & 5.00604274276814 \tabularnewline
41 & 139.74 & 135.701265716858 & 4.03873428314191 \tabularnewline
42 & 144.08 & 138.44624040928 & 5.6337595907205 \tabularnewline
43 & 145.35 & 138.145960612987 & 7.20403938701339 \tabularnewline
44 & 145.77 & 144.42438534394 & 1.34561465606036 \tabularnewline
45 & 140.56 & 144.406165070854 & -3.84616507085434 \tabularnewline
46 & 121.41 & 140.129711328516 & -18.7197113285165 \tabularnewline
47 & 120.44 & 132.726025951002 & -12.2860259510018 \tabularnewline
48 & 116.97 & 131.387384223214 & -14.4173842232141 \tabularnewline
49 & 128.03 & 136.923067137686 & -8.89306713768594 \tabularnewline
50 & 128.51 & 137.71128974237 & -9.2012897423702 \tabularnewline
51 & 127.76 & 137.226039715103 & -9.46603971510276 \tabularnewline
52 & 134.58 & 139.741627713333 & -5.16162771333316 \tabularnewline
53 & 147.64 & 139.901255787536 & 7.73874421246412 \tabularnewline
54 & 144.46 & 138.925837765677 & 5.53416223432315 \tabularnewline
55 & 137.6 & 147.355333303333 & -9.75533330333343 \tabularnewline
56 & 146.87 & 141.699290667191 & 5.17070933280874 \tabularnewline
57 & 145.67 & 148.731497391082 & -3.06149739108214 \tabularnewline
58 & 151.95 & 143.973437775182 & 7.9765622248183 \tabularnewline
59 & 150.23 & 147.842769210768 & 2.38723078923222 \tabularnewline
60 & 155.86 & 148.336500765734 & 7.52349923426561 \tabularnewline
\hline
\end{tabular}
%Source: https://freestatistics.org/blog/index.php?pk=109216&T=4

[TABLE]
[ROW][C]Multiple Linear Regression - Actuals, Interpolation, and Residuals[/C][/ROW]
[ROW][C]Time or Index[/C][C]Actuals[/C][C]InterpolationForecast[/C][C]ResidualsPrediction Error[/C][/ROW]
[ROW][C]1[/C][C]107.11[/C][C]115.97797694951[/C][C]-8.86797694951014[/C][/ROW]
[ROW][C]2[/C][C]122.23[/C][C]119.925020234187[/C][C]2.30497976581255[/C][/ROW]
[ROW][C]3[/C][C]134.69[/C][C]117.73345276502[/C][C]16.9565472349804[/C][/ROW]
[ROW][C]4[/C][C]128.79[/C][C]109.138054685589[/C][C]19.6519453144111[/C][/ROW]
[ROW][C]5[/C][C]126.16[/C][C]111.359429682002[/C][C]14.8005703179976[/C][/ROW]
[ROW][C]6[/C][C]119.98[/C][C]115.481059599986[/C][C]4.49894040001384[/C][/ROW]
[ROW][C]7[/C][C]108.45[/C][C]111.179198653012[/C][C]-2.72919865301167[/C][/ROW]
[ROW][C]8[/C][C]108.43[/C][C]113.223167372908[/C][C]-4.79316737290771[/C][/ROW]
[ROW][C]9[/C][C]98.17[/C][C]114.940248451346[/C][C]-16.7702484513461[/C][/ROW]
[ROW][C]10[/C][C]106.09[/C][C]112.087317856436[/C][C]-5.99731785643614[/C][/ROW]
[ROW][C]11[/C][C]108.81[/C][C]109.166350835617[/C][C]-0.356350835616631[/C][/ROW]
[ROW][C]12[/C][C]103.03[/C][C]108.543591538146[/C][C]-5.51359153814608[/C][/ROW]
[ROW][C]13[/C][C]124.36[/C][C]110.741976553877[/C][C]13.6180234461234[/C][/ROW]
[ROW][C]14[/C][C]118.52[/C][C]119.089370573714[/C][C]-0.569370573713992[/C][/ROW]
[ROW][C]15[/C][C]112.2[/C][C]117.030169463204[/C][C]-4.83016946320434[/C][/ROW]
[ROW][C]16[/C][C]114.71[/C][C]111.592890416648[/C][C]3.11710958335233[/C][/ROW]
[ROW][C]17[/C][C]107.96[/C][C]114.080184208189[/C][C]-6.1201842081891[/C][/ROW]
[ROW][C]18[/C][C]101.21[/C][C]118.044218127792[/C][C]-16.8342181277917[/C][/ROW]
[ROW][C]19[/C][C]102.77[/C][C]120.807538972637[/C][C]-18.0375389726372[/C][/ROW]
[ROW][C]20[/C][C]112.13[/C][C]121.346297390728[/C][C]-9.21629739072846[/C][/ROW]
[ROW][C]21[/C][C]109.36[/C][C]119.278458675122[/C][C]-9.91845867512217[/C][/ROW]
[ROW][C]22[/C][C]110.91[/C][C]119.556414612852[/C][C]-8.64641461285197[/C][/ROW]
[ROW][C]23[/C][C]123.57[/C][C]117.681484794606[/C][C]5.88851520539351[/C][/ROW]
[ROW][C]24[/C][C]129.95[/C][C]123.016713328813[/C][C]6.93328667118734[/C][/ROW]
[ROW][C]25[/C][C]124.46[/C][C]126.200828696393[/C][C]-1.74082869639347[/C][/ROW]
[ROW][C]26[/C][C]122.34[/C][C]120.085116586143[/C][C]2.25488341385666[/C][/ROW]
[ROW][C]27[/C][C]116.61[/C][C]119.012339349377[/C][C]-2.40233934937682[/C][/ROW]
[ROW][C]28[/C][C]114.59[/C][C]118.214669191819[/C][C]-3.62466919181876[/C][/ROW]
[ROW][C]29[/C][C]112.52[/C][C]118.814106464154[/C][C]-6.29410646415421[/C][/ROW]
[ROW][C]30[/C][C]118.67[/C][C]121.269563578716[/C][C]-2.59956357871557[/C][/ROW]
[ROW][C]31[/C][C]116.8[/C][C]122.804279561373[/C][C]-6.00427956137254[/C][/ROW]
[ROW][C]32[/C][C]123.63[/C][C]123.261357352454[/C][C]0.368642647545714[/C][/ROW]
[ROW][C]33[/C][C]128.04[/C][C]127.280391188366[/C][C]0.759608811634165[/C][/ROW]
[ROW][C]34[/C][C]134.57[/C][C]126.252844489107[/C][C]8.31715551089315[/C][/ROW]
[ROW][C]35[/C][C]130.33[/C][C]124.05084835394[/C][C]6.27915164605977[/C][/ROW]
[ROW][C]36[/C][C]136.47[/C][C]123.191084103715[/C][C]13.2789158962851[/C][/ROW]
[ROW][C]37[/C][C]139.05[/C][C]126.650228358028[/C][C]12.3997716419722[/C][/ROW]
[ROW][C]38[/C][C]158.21[/C][C]131.386905269422[/C][C]26.8230947305783[/C][/ROW]
[ROW][C]39[/C][C]148.07[/C][C]129.205808826174[/C][C]18.8641911738256[/C][/ROW]
[ROW][C]40[/C][C]137.74[/C][C]132.733957257232[/C][C]5.00604274276814[/C][/ROW]
[ROW][C]41[/C][C]139.74[/C][C]135.701265716858[/C][C]4.03873428314191[/C][/ROW]
[ROW][C]42[/C][C]144.08[/C][C]138.44624040928[/C][C]5.6337595907205[/C][/ROW]
[ROW][C]43[/C][C]145.35[/C][C]138.145960612987[/C][C]7.20403938701339[/C][/ROW]
[ROW][C]44[/C][C]145.77[/C][C]144.42438534394[/C][C]1.34561465606036[/C][/ROW]
[ROW][C]45[/C][C]140.56[/C][C]144.406165070854[/C][C]-3.84616507085434[/C][/ROW]
[ROW][C]46[/C][C]121.41[/C][C]140.129711328516[/C][C]-18.7197113285165[/C][/ROW]
[ROW][C]47[/C][C]120.44[/C][C]132.726025951002[/C][C]-12.2860259510018[/C][/ROW]
[ROW][C]48[/C][C]116.97[/C][C]131.387384223214[/C][C]-14.4173842232141[/C][/ROW]
[ROW][C]49[/C][C]128.03[/C][C]136.923067137686[/C][C]-8.89306713768594[/C][/ROW]
[ROW][C]50[/C][C]128.51[/C][C]137.71128974237[/C][C]-9.2012897423702[/C][/ROW]
[ROW][C]51[/C][C]127.76[/C][C]137.226039715103[/C][C]-9.46603971510276[/C][/ROW]
[ROW][C]52[/C][C]134.58[/C][C]139.741627713333[/C][C]-5.16162771333316[/C][/ROW]
[ROW][C]53[/C][C]147.64[/C][C]139.901255787536[/C][C]7.73874421246412[/C][/ROW]
[ROW][C]54[/C][C]144.46[/C][C]138.925837765677[/C][C]5.53416223432315[/C][/ROW]
[ROW][C]55[/C][C]137.6[/C][C]147.355333303333[/C][C]-9.75533330333343[/C][/ROW]
[ROW][C]56[/C][C]146.87[/C][C]141.699290667191[/C][C]5.17070933280874[/C][/ROW]
[ROW][C]57[/C][C]145.67[/C][C]148.731497391082[/C][C]-3.06149739108214[/C][/ROW]
[ROW][C]58[/C][C]151.95[/C][C]143.973437775182[/C][C]7.9765622248183[/C][/ROW]
[ROW][C]59[/C][C]150.23[/C][C]147.842769210768[/C][C]2.38723078923222[/C][/ROW]
[ROW][C]60[/C][C]155.86[/C][C]148.336500765734[/C][C]7.52349923426561[/C][/ROW]
[/TABLE]
Source: https://freestatistics.org/blog/index.php?pk=109216&T=4

Globally Unique Identifier (entire table): ba.freestatistics.org/blog/index.php?pk=109216&T=4

As an alternative you can also use a QR Code:  

The GUIDs for individual cells are displayed in the table below:

Multiple Linear Regression - Actuals, Interpolation, and Residuals
Time or IndexActualsInterpolationForecastResidualsPrediction Error
1107.11115.97797694951-8.86797694951014
2122.23119.9250202341872.30497976581255
3134.69117.7334527650216.9565472349804
4128.79109.13805468558919.6519453144111
5126.16111.35942968200214.8005703179976
6119.98115.4810595999864.49894040001384
7108.45111.179198653012-2.72919865301167
8108.43113.223167372908-4.79316737290771
998.17114.940248451346-16.7702484513461
10106.09112.087317856436-5.99731785643614
11108.81109.166350835617-0.356350835616631
12103.03108.543591538146-5.51359153814608
13124.36110.74197655387713.6180234461234
14118.52119.089370573714-0.569370573713992
15112.2117.030169463204-4.83016946320434
16114.71111.5928904166483.11710958335233
17107.96114.080184208189-6.1201842081891
18101.21118.044218127792-16.8342181277917
19102.77120.807538972637-18.0375389726372
20112.13121.346297390728-9.21629739072846
21109.36119.278458675122-9.91845867512217
22110.91119.556414612852-8.64641461285197
23123.57117.6814847946065.88851520539351
24129.95123.0167133288136.93328667118734
25124.46126.200828696393-1.74082869639347
26122.34120.0851165861432.25488341385666
27116.61119.012339349377-2.40233934937682
28114.59118.214669191819-3.62466919181876
29112.52118.814106464154-6.29410646415421
30118.67121.269563578716-2.59956357871557
31116.8122.804279561373-6.00427956137254
32123.63123.2613573524540.368642647545714
33128.04127.2803911883660.759608811634165
34134.57126.2528444891078.31715551089315
35130.33124.050848353946.27915164605977
36136.47123.19108410371513.2789158962851
37139.05126.65022835802812.3997716419722
38158.21131.38690526942226.8230947305783
39148.07129.20580882617418.8641911738256
40137.74132.7339572572325.00604274276814
41139.74135.7012657168584.03873428314191
42144.08138.446240409285.6337595907205
43145.35138.1459606129877.20403938701339
44145.77144.424385343941.34561465606036
45140.56144.406165070854-3.84616507085434
46121.41140.129711328516-18.7197113285165
47120.44132.726025951002-12.2860259510018
48116.97131.387384223214-14.4173842232141
49128.03136.923067137686-8.89306713768594
50128.51137.71128974237-9.2012897423702
51127.76137.226039715103-9.46603971510276
52134.58139.741627713333-5.16162771333316
53147.64139.9012557875367.73874421246412
54144.46138.9258377656775.53416223432315
55137.6147.355333303333-9.75533330333343
56146.87141.6992906671915.17070933280874
57145.67148.731497391082-3.06149739108214
58151.95143.9734377751827.9765622248183
59150.23147.8427692107682.38723078923222
60155.86148.3365007657347.52349923426561


Goldfeld-Quandt test for Heteroskedasticity
p-valuesAlternative Hypothesis
breakpoint indexgreater2-sidedless
70.653703913189470.692592173621060.34629608681053
80.4883468958885480.9766937917770960.511653104111452
90.3757210706660690.7514421413321390.624278929333931
100.603868876673990.7922622466520190.39613112332601
110.5923909461345140.8152181077309710.407609053865486
120.5452392338693720.9095215322612560.454760766130628
130.7833479728453070.4333040543093870.216652027154693
140.725290184203280.549419631593440.27470981579672
150.6396361736120310.7207276527759380.360363826387969
160.5593758141095280.8812483717809450.440624185890472
170.4696364874690330.9392729749380660.530363512530967
180.4338393578219710.8676787156439420.566160642178029
190.4611160215541010.9222320431082010.538883978445899
200.5675126682645980.8649746634708050.432487331735402
210.598703548990220.802592902019560.40129645100978
220.6383617143356350.723276571328730.361638285664365
230.7076920951618820.5846158096762350.292307904838118
240.75493584635910.4901283072817990.2450641536409
250.7335759910782410.5328480178435180.266424008921759
260.6886538684983520.6226922630032950.311346131501648
270.6700081270755930.6599837458488140.329991872924407
280.6675175914310910.6649648171378170.332482408568909
290.7149728690356520.5700542619286960.285027130964348
300.7284619843055780.5430760313888440.271538015694422
310.8448503994432190.3102992011135620.155149600556781
320.8826042205339220.2347915589321550.117395779466078
330.913292121324120.173415757351760.0867078786758799
340.9172191835082560.1655616329834880.082780816491744
350.9206362129169220.1587275741661560.079363787083078
360.9205880425553950.158823914889210.079411957444605
370.9243443401116550.1513113197766890.0756556598883447
380.973010081247540.05397983750491990.02698991875246
390.9735848073137480.0528303853725050.0264151926862525
400.9573761004164440.08524779916711210.0426238995835561
410.9391123959963220.1217752080073570.0608876040036784
420.9276442386368740.1447115227262520.0723557613631259
430.938079767711210.1238404645775810.0619202322887903
440.956049038643470.08790192271305850.0439509613565293
450.9933387740433980.0133224519132050.0066612259566025
460.9946777017890670.01064459642186620.00532229821093311
470.989957306957270.02008538608545950.0100426930427298
480.9960172774795520.007965445040896020.00398272252044801
490.9899173198092130.02016536038157340.0100826801907867
500.9756963006198620.04860739876027530.0243036993801377
510.9860457759029090.02790844819418230.0139542240970912
520.9756118907514690.04877621849706250.0243881092485312
530.9950498258881760.009900348223648470.00495017411182423

\begin{tabular}{lllllllll}
\hline
Goldfeld-Quandt test for Heteroskedasticity \tabularnewline
p-values & Alternative Hypothesis \tabularnewline
breakpoint index & greater & 2-sided & less \tabularnewline
7 & 0.65370391318947 & 0.69259217362106 & 0.34629608681053 \tabularnewline
8 & 0.488346895888548 & 0.976693791777096 & 0.511653104111452 \tabularnewline
9 & 0.375721070666069 & 0.751442141332139 & 0.624278929333931 \tabularnewline
10 & 0.60386887667399 & 0.792262246652019 & 0.39613112332601 \tabularnewline
11 & 0.592390946134514 & 0.815218107730971 & 0.407609053865486 \tabularnewline
12 & 0.545239233869372 & 0.909521532261256 & 0.454760766130628 \tabularnewline
13 & 0.783347972845307 & 0.433304054309387 & 0.216652027154693 \tabularnewline
14 & 0.72529018420328 & 0.54941963159344 & 0.27470981579672 \tabularnewline
15 & 0.639636173612031 & 0.720727652775938 & 0.360363826387969 \tabularnewline
16 & 0.559375814109528 & 0.881248371780945 & 0.440624185890472 \tabularnewline
17 & 0.469636487469033 & 0.939272974938066 & 0.530363512530967 \tabularnewline
18 & 0.433839357821971 & 0.867678715643942 & 0.566160642178029 \tabularnewline
19 & 0.461116021554101 & 0.922232043108201 & 0.538883978445899 \tabularnewline
20 & 0.567512668264598 & 0.864974663470805 & 0.432487331735402 \tabularnewline
21 & 0.59870354899022 & 0.80259290201956 & 0.40129645100978 \tabularnewline
22 & 0.638361714335635 & 0.72327657132873 & 0.361638285664365 \tabularnewline
23 & 0.707692095161882 & 0.584615809676235 & 0.292307904838118 \tabularnewline
24 & 0.7549358463591 & 0.490128307281799 & 0.2450641536409 \tabularnewline
25 & 0.733575991078241 & 0.532848017843518 & 0.266424008921759 \tabularnewline
26 & 0.688653868498352 & 0.622692263003295 & 0.311346131501648 \tabularnewline
27 & 0.670008127075593 & 0.659983745848814 & 0.329991872924407 \tabularnewline
28 & 0.667517591431091 & 0.664964817137817 & 0.332482408568909 \tabularnewline
29 & 0.714972869035652 & 0.570054261928696 & 0.285027130964348 \tabularnewline
30 & 0.728461984305578 & 0.543076031388844 & 0.271538015694422 \tabularnewline
31 & 0.844850399443219 & 0.310299201113562 & 0.155149600556781 \tabularnewline
32 & 0.882604220533922 & 0.234791558932155 & 0.117395779466078 \tabularnewline
33 & 0.91329212132412 & 0.17341575735176 & 0.0867078786758799 \tabularnewline
34 & 0.917219183508256 & 0.165561632983488 & 0.082780816491744 \tabularnewline
35 & 0.920636212916922 & 0.158727574166156 & 0.079363787083078 \tabularnewline
36 & 0.920588042555395 & 0.15882391488921 & 0.079411957444605 \tabularnewline
37 & 0.924344340111655 & 0.151311319776689 & 0.0756556598883447 \tabularnewline
38 & 0.97301008124754 & 0.0539798375049199 & 0.02698991875246 \tabularnewline
39 & 0.973584807313748 & 0.052830385372505 & 0.0264151926862525 \tabularnewline
40 & 0.957376100416444 & 0.0852477991671121 & 0.0426238995835561 \tabularnewline
41 & 0.939112395996322 & 0.121775208007357 & 0.0608876040036784 \tabularnewline
42 & 0.927644238636874 & 0.144711522726252 & 0.0723557613631259 \tabularnewline
43 & 0.93807976771121 & 0.123840464577581 & 0.0619202322887903 \tabularnewline
44 & 0.95604903864347 & 0.0879019227130585 & 0.0439509613565293 \tabularnewline
45 & 0.993338774043398 & 0.013322451913205 & 0.0066612259566025 \tabularnewline
46 & 0.994677701789067 & 0.0106445964218662 & 0.00532229821093311 \tabularnewline
47 & 0.98995730695727 & 0.0200853860854595 & 0.0100426930427298 \tabularnewline
48 & 0.996017277479552 & 0.00796544504089602 & 0.00398272252044801 \tabularnewline
49 & 0.989917319809213 & 0.0201653603815734 & 0.0100826801907867 \tabularnewline
50 & 0.975696300619862 & 0.0486073987602753 & 0.0243036993801377 \tabularnewline
51 & 0.986045775902909 & 0.0279084481941823 & 0.0139542240970912 \tabularnewline
52 & 0.975611890751469 & 0.0487762184970625 & 0.0243881092485312 \tabularnewline
53 & 0.995049825888176 & 0.00990034822364847 & 0.00495017411182423 \tabularnewline
\hline
\end{tabular}
%Source: https://freestatistics.org/blog/index.php?pk=109216&T=5

[TABLE]
[ROW][C]Goldfeld-Quandt test for Heteroskedasticity[/C][/ROW]
[ROW][C]p-values[/C][C]Alternative Hypothesis[/C][/ROW]
[ROW][C]breakpoint index[/C][C]greater[/C][C]2-sided[/C][C]less[/C][/ROW]
[ROW][C]7[/C][C]0.65370391318947[/C][C]0.69259217362106[/C][C]0.34629608681053[/C][/ROW]
[ROW][C]8[/C][C]0.488346895888548[/C][C]0.976693791777096[/C][C]0.511653104111452[/C][/ROW]
[ROW][C]9[/C][C]0.375721070666069[/C][C]0.751442141332139[/C][C]0.624278929333931[/C][/ROW]
[ROW][C]10[/C][C]0.60386887667399[/C][C]0.792262246652019[/C][C]0.39613112332601[/C][/ROW]
[ROW][C]11[/C][C]0.592390946134514[/C][C]0.815218107730971[/C][C]0.407609053865486[/C][/ROW]
[ROW][C]12[/C][C]0.545239233869372[/C][C]0.909521532261256[/C][C]0.454760766130628[/C][/ROW]
[ROW][C]13[/C][C]0.783347972845307[/C][C]0.433304054309387[/C][C]0.216652027154693[/C][/ROW]
[ROW][C]14[/C][C]0.72529018420328[/C][C]0.54941963159344[/C][C]0.27470981579672[/C][/ROW]
[ROW][C]15[/C][C]0.639636173612031[/C][C]0.720727652775938[/C][C]0.360363826387969[/C][/ROW]
[ROW][C]16[/C][C]0.559375814109528[/C][C]0.881248371780945[/C][C]0.440624185890472[/C][/ROW]
[ROW][C]17[/C][C]0.469636487469033[/C][C]0.939272974938066[/C][C]0.530363512530967[/C][/ROW]
[ROW][C]18[/C][C]0.433839357821971[/C][C]0.867678715643942[/C][C]0.566160642178029[/C][/ROW]
[ROW][C]19[/C][C]0.461116021554101[/C][C]0.922232043108201[/C][C]0.538883978445899[/C][/ROW]
[ROW][C]20[/C][C]0.567512668264598[/C][C]0.864974663470805[/C][C]0.432487331735402[/C][/ROW]
[ROW][C]21[/C][C]0.59870354899022[/C][C]0.80259290201956[/C][C]0.40129645100978[/C][/ROW]
[ROW][C]22[/C][C]0.638361714335635[/C][C]0.72327657132873[/C][C]0.361638285664365[/C][/ROW]
[ROW][C]23[/C][C]0.707692095161882[/C][C]0.584615809676235[/C][C]0.292307904838118[/C][/ROW]
[ROW][C]24[/C][C]0.7549358463591[/C][C]0.490128307281799[/C][C]0.2450641536409[/C][/ROW]
[ROW][C]25[/C][C]0.733575991078241[/C][C]0.532848017843518[/C][C]0.266424008921759[/C][/ROW]
[ROW][C]26[/C][C]0.688653868498352[/C][C]0.622692263003295[/C][C]0.311346131501648[/C][/ROW]
[ROW][C]27[/C][C]0.670008127075593[/C][C]0.659983745848814[/C][C]0.329991872924407[/C][/ROW]
[ROW][C]28[/C][C]0.667517591431091[/C][C]0.664964817137817[/C][C]0.332482408568909[/C][/ROW]
[ROW][C]29[/C][C]0.714972869035652[/C][C]0.570054261928696[/C][C]0.285027130964348[/C][/ROW]
[ROW][C]30[/C][C]0.728461984305578[/C][C]0.543076031388844[/C][C]0.271538015694422[/C][/ROW]
[ROW][C]31[/C][C]0.844850399443219[/C][C]0.310299201113562[/C][C]0.155149600556781[/C][/ROW]
[ROW][C]32[/C][C]0.882604220533922[/C][C]0.234791558932155[/C][C]0.117395779466078[/C][/ROW]
[ROW][C]33[/C][C]0.91329212132412[/C][C]0.17341575735176[/C][C]0.0867078786758799[/C][/ROW]
[ROW][C]34[/C][C]0.917219183508256[/C][C]0.165561632983488[/C][C]0.082780816491744[/C][/ROW]
[ROW][C]35[/C][C]0.920636212916922[/C][C]0.158727574166156[/C][C]0.079363787083078[/C][/ROW]
[ROW][C]36[/C][C]0.920588042555395[/C][C]0.15882391488921[/C][C]0.079411957444605[/C][/ROW]
[ROW][C]37[/C][C]0.924344340111655[/C][C]0.151311319776689[/C][C]0.0756556598883447[/C][/ROW]
[ROW][C]38[/C][C]0.97301008124754[/C][C]0.0539798375049199[/C][C]0.02698991875246[/C][/ROW]
[ROW][C]39[/C][C]0.973584807313748[/C][C]0.052830385372505[/C][C]0.0264151926862525[/C][/ROW]
[ROW][C]40[/C][C]0.957376100416444[/C][C]0.0852477991671121[/C][C]0.0426238995835561[/C][/ROW]
[ROW][C]41[/C][C]0.939112395996322[/C][C]0.121775208007357[/C][C]0.0608876040036784[/C][/ROW]
[ROW][C]42[/C][C]0.927644238636874[/C][C]0.144711522726252[/C][C]0.0723557613631259[/C][/ROW]
[ROW][C]43[/C][C]0.93807976771121[/C][C]0.123840464577581[/C][C]0.0619202322887903[/C][/ROW]
[ROW][C]44[/C][C]0.95604903864347[/C][C]0.0879019227130585[/C][C]0.0439509613565293[/C][/ROW]
[ROW][C]45[/C][C]0.993338774043398[/C][C]0.013322451913205[/C][C]0.0066612259566025[/C][/ROW]
[ROW][C]46[/C][C]0.994677701789067[/C][C]0.0106445964218662[/C][C]0.00532229821093311[/C][/ROW]
[ROW][C]47[/C][C]0.98995730695727[/C][C]0.0200853860854595[/C][C]0.0100426930427298[/C][/ROW]
[ROW][C]48[/C][C]0.996017277479552[/C][C]0.00796544504089602[/C][C]0.00398272252044801[/C][/ROW]
[ROW][C]49[/C][C]0.989917319809213[/C][C]0.0201653603815734[/C][C]0.0100826801907867[/C][/ROW]
[ROW][C]50[/C][C]0.975696300619862[/C][C]0.0486073987602753[/C][C]0.0243036993801377[/C][/ROW]
[ROW][C]51[/C][C]0.986045775902909[/C][C]0.0279084481941823[/C][C]0.0139542240970912[/C][/ROW]
[ROW][C]52[/C][C]0.975611890751469[/C][C]0.0487762184970625[/C][C]0.0243881092485312[/C][/ROW]
[ROW][C]53[/C][C]0.995049825888176[/C][C]0.00990034822364847[/C][C]0.00495017411182423[/C][/ROW]
[/TABLE]
Source: https://freestatistics.org/blog/index.php?pk=109216&T=5

Globally Unique Identifier (entire table): ba.freestatistics.org/blog/index.php?pk=109216&T=5

As an alternative you can also use a QR Code:  

The GUIDs for individual cells are displayed in the table below:

Goldfeld-Quandt test for Heteroskedasticity
p-valuesAlternative Hypothesis
breakpoint indexgreater2-sidedless
70.653703913189470.692592173621060.34629608681053
80.4883468958885480.9766937917770960.511653104111452
90.3757210706660690.7514421413321390.624278929333931
100.603868876673990.7922622466520190.39613112332601
110.5923909461345140.8152181077309710.407609053865486
120.5452392338693720.9095215322612560.454760766130628
130.7833479728453070.4333040543093870.216652027154693
140.725290184203280.549419631593440.27470981579672
150.6396361736120310.7207276527759380.360363826387969
160.5593758141095280.8812483717809450.440624185890472
170.4696364874690330.9392729749380660.530363512530967
180.4338393578219710.8676787156439420.566160642178029
190.4611160215541010.9222320431082010.538883978445899
200.5675126682645980.8649746634708050.432487331735402
210.598703548990220.802592902019560.40129645100978
220.6383617143356350.723276571328730.361638285664365
230.7076920951618820.5846158096762350.292307904838118
240.75493584635910.4901283072817990.2450641536409
250.7335759910782410.5328480178435180.266424008921759
260.6886538684983520.6226922630032950.311346131501648
270.6700081270755930.6599837458488140.329991872924407
280.6675175914310910.6649648171378170.332482408568909
290.7149728690356520.5700542619286960.285027130964348
300.7284619843055780.5430760313888440.271538015694422
310.8448503994432190.3102992011135620.155149600556781
320.8826042205339220.2347915589321550.117395779466078
330.913292121324120.173415757351760.0867078786758799
340.9172191835082560.1655616329834880.082780816491744
350.9206362129169220.1587275741661560.079363787083078
360.9205880425553950.158823914889210.079411957444605
370.9243443401116550.1513113197766890.0756556598883447
380.973010081247540.05397983750491990.02698991875246
390.9735848073137480.0528303853725050.0264151926862525
400.9573761004164440.08524779916711210.0426238995835561
410.9391123959963220.1217752080073570.0608876040036784
420.9276442386368740.1447115227262520.0723557613631259
430.938079767711210.1238404645775810.0619202322887903
440.956049038643470.08790192271305850.0439509613565293
450.9933387740433980.0133224519132050.0066612259566025
460.9946777017890670.01064459642186620.00532229821093311
470.989957306957270.02008538608545950.0100426930427298
480.9960172774795520.007965445040896020.00398272252044801
490.9899173198092130.02016536038157340.0100826801907867
500.9756963006198620.04860739876027530.0243036993801377
510.9860457759029090.02790844819418230.0139542240970912
520.9756118907514690.04877621849706250.0243881092485312
530.9950498258881760.009900348223648470.00495017411182423


Meta Analysis of Goldfeld-Quandt test for Heteroskedasticity
Description# significant tests% significant testsOK/NOK
1% type I error level20.0425531914893617NOK
5% type I error level90.191489361702128NOK
10% type I error level130.276595744680851NOK

\begin{tabular}{lllllllll}
\hline
Meta Analysis of Goldfeld-Quandt test for Heteroskedasticity \tabularnewline
Description & # significant tests & % significant tests & OK/NOK \tabularnewline
1% type I error level & 2 & 0.0425531914893617 & NOK \tabularnewline
5% type I error level & 9 & 0.191489361702128 & NOK \tabularnewline
10% type I error level & 13 & 0.276595744680851 & NOK \tabularnewline
\hline
\end{tabular}
%Source: https://freestatistics.org/blog/index.php?pk=109216&T=6

[TABLE]
[ROW][C]Meta Analysis of Goldfeld-Quandt test for Heteroskedasticity[/C][/ROW]
[ROW][C]Description[/C][C]# significant tests[/C][C]% significant tests[/C][C]OK/NOK[/C][/ROW]
[ROW][C]1% type I error level[/C][C]2[/C][C]0.0425531914893617[/C][C]NOK[/C][/ROW]
[ROW][C]5% type I error level[/C][C]9[/C][C]0.191489361702128[/C][C]NOK[/C][/ROW]
[ROW][C]10% type I error level[/C][C]13[/C][C]0.276595744680851[/C][C]NOK[/C][/ROW]
[/TABLE]
Source: https://freestatistics.org/blog/index.php?pk=109216&T=6

Globally Unique Identifier (entire table): ba.freestatistics.org/blog/index.php?pk=109216&T=6

As an alternative you can also use a QR Code:  

The GUIDs for individual cells are displayed in the table below:

Meta Analysis of Goldfeld-Quandt test for Heteroskedasticity
Description# significant tests% significant testsOK/NOK
1% type I error level20.0425531914893617NOK
5% type I error level90.191489361702128NOK
10% type I error level130.276595744680851NOK


Parameters (Session):
par1 = 1 ; par2 = Do not include Seasonal Dummies ; par3 = No Linear Trend ;
Parameters (R input):
par1 = 1 ; par2 = Do not include Seasonal Dummies ; par3 = No Linear Trend ;
R code (references can be found in the software module):
library(lattice)
library(lmtest)
n25 <- 25 #minimum number of obs. for Goldfeld-Quandt test
par1 <- as.numeric(par1)
x <- t(y)
k <- length(x[1,])
n <- length(x[,1])
x1 <- cbind(x[,par1], x[,1:k!=par1])
mycolnames <- c(colnames(x)[par1], colnames(x)[1:k!=par1])
colnames(x1) <- mycolnames #colnames(x)[par1]
x <- x1
if (par3 == 'First Differences'){
x2 <- array(0, dim=c(n-1,k), dimnames=list(1:(n-1), paste('(1-B)',colnames(x),sep='')))
for (i in 1:n-1) {
for (j in 1:k) {
x2[i,j] <- x[i+1,j] - x[i,j]
}
}
x <- x2
}
if (par2 == 'Include Monthly Dummies'){
x2 <- array(0, dim=c(n,11), dimnames=list(1:n, paste('M', seq(1:11), sep ='')))
for (i in 1:11){
x2[seq(i,n,12),i] <- 1
}
x <- cbind(x, x2)
}
if (par2 == 'Include Quarterly Dummies'){
x2 <- array(0, dim=c(n,3), dimnames=list(1:n, paste('Q', seq(1:3), sep ='')))
for (i in 1:3){
x2[seq(i,n,4),i] <- 1
}
x <- cbind(x, x2)
}
k <- length(x[1,])
if (par3 == 'Linear Trend'){
x <- cbind(x, c(1:n))
colnames(x)[k+1] <- 't'
}
x
k <- length(x[1,])
df <- as.data.frame(x)
(mylm <- lm(df))
(mysum <- summary(mylm))
if (n > n25) {
kp3 <- k + 3
nmkm3 <- n - k - 3
gqarr <- array(NA, dim=c(nmkm3-kp3+1,3))
numgqtests <- 0
numsignificant1 <- 0
numsignificant5 <- 0
numsignificant10 <- 0
for (mypoint in kp3:nmkm3) {
j <- 0
numgqtests <- numgqtests + 1
for (myalt in c('greater', 'two.sided', 'less')) {
j <- j + 1
gqarr[mypoint-kp3+1,j] <- gqtest(mylm, point=mypoint, alternative=myalt)$p.value
}
if (gqarr[mypoint-kp3+1,2] < 0.01) numsignificant1 <- numsignificant1 + 1
if (gqarr[mypoint-kp3+1,2] < 0.05) numsignificant5 <- numsignificant5 + 1
if (gqarr[mypoint-kp3+1,2] < 0.10) numsignificant10 <- numsignificant10 + 1
}
gqarr
}
bitmap(file='test0.png')
plot(x[,1], type='l', main='Actuals and Interpolation', ylab='value of Actuals and Interpolation (dots)', xlab='time or index')
points(x[,1]-mysum$resid)
grid()
dev.off()
bitmap(file='test1.png')
plot(mysum$resid, type='b', pch=19, main='Residuals', ylab='value of Residuals', xlab='time or index')
grid()
dev.off()
bitmap(file='test2.png')
hist(mysum$resid, main='Residual Histogram', xlab='values of Residuals')
grid()
dev.off()
bitmap(file='test3.png')
densityplot(~mysum$resid,col='black',main='Residual Density Plot', xlab='values of Residuals')
dev.off()
bitmap(file='test4.png')
qqnorm(mysum$resid, main='Residual Normal Q-Q Plot')
qqline(mysum$resid)
grid()
dev.off()
(myerror <- as.ts(mysum$resid))
bitmap(file='test5.png')
dum <- cbind(lag(myerror,k=1),myerror)
dum
dum1 <- dum[2:length(myerror),]
dum1
z <- as.data.frame(dum1)
z
plot(z,main=paste('Residual Lag plot, lowess, and regression line'), ylab='values of Residuals', xlab='lagged values of Residuals')
lines(lowess(z))
abline(lm(z))
grid()
dev.off()
bitmap(file='test6.png')
acf(mysum$resid, lag.max=length(mysum$resid)/2, main='Residual Autocorrelation Function')
grid()
dev.off()
bitmap(file='test7.png')
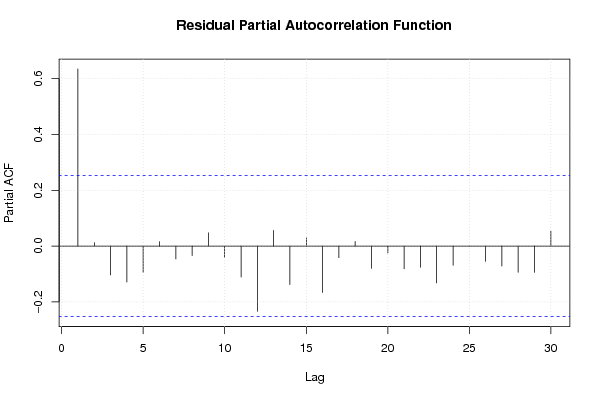
pacf(mysum$resid, lag.max=length(mysum$resid)/2, main='Residual Partial Autocorrelation Function')
grid()
dev.off()
bitmap(file='test8.png')
opar <- par(mfrow = c(2,2), oma = c(0, 0, 1.1, 0))
plot(mylm, las = 1, sub='Residual Diagnostics')
par(opar)
dev.off()
if (n > n25) {
bitmap(file='test9.png')
plot(kp3:nmkm3,gqarr[,2], main='Goldfeld-Quandt test',ylab='2-sided p-value',xlab='breakpoint')
grid()
dev.off()
}
load(file='createtable')
a<-table.start()
a<-table.row.start(a)
a<-table.element(a, 'Multiple Linear Regression - Estimated Regression Equation', 1, TRUE)
a<-table.row.end(a)
myeq <- colnames(x)[1]
myeq <- paste(myeq, '[t] = ', sep='')
for (i in 1:k){
if (mysum$coefficients[i,1] > 0) myeq <- paste(myeq, '+', '')
myeq <- paste(myeq, mysum$coefficients[i,1], sep=' ')
if (rownames(mysum$coefficients)[i] != '(Intercept)') {
myeq <- paste(myeq, rownames(mysum$coefficients)[i], sep='')
if (rownames(mysum$coefficients)[i] != 't') myeq <- paste(myeq, '[t]', sep='')
}
}
myeq <- paste(myeq, ' + e[t]')
a<-table.row.start(a)
a<-table.element(a, myeq)
a<-table.row.end(a)
a<-table.end(a)
table.save(a,file='mytable1.tab')
a<-table.start()
a<-table.row.start(a)
a<-table.element(a,hyperlink('ols1.htm','Multiple Linear Regression - Ordinary Least Squares',''), 6, TRUE)
a<-table.row.end(a)
a<-table.row.start(a)
a<-table.element(a,'Variable',header=TRUE)
a<-table.element(a,'Parameter',header=TRUE)
a<-table.element(a,'S.D.',header=TRUE)
a<-table.element(a,'T-STAT
H0: parameter = 0',header=TRUE)
a<-table.element(a,'2-tail p-value',header=TRUE)
a<-table.element(a,'1-tail p-value',header=TRUE)
a<-table.row.end(a)
for (i in 1:k){
a<-table.row.start(a)
a<-table.element(a,rownames(mysum$coefficients)[i],header=TRUE)
a<-table.element(a,mysum$coefficients[i,1])
a<-table.element(a, round(mysum$coefficients[i,2],6))
a<-table.element(a, round(mysum$coefficients[i,3],4))
a<-table.element(a, round(mysum$coefficients[i,4],6))
a<-table.element(a, round(mysum$coefficients[i,4]/2,6))
a<-table.row.end(a)
}
a<-table.end(a)
table.save(a,file='mytable2.tab')
a<-table.start()
a<-table.row.start(a)
a<-table.element(a, 'Multiple Linear Regression - Regression Statistics', 2, TRUE)
a<-table.row.end(a)
a<-table.row.start(a)
a<-table.element(a, 'Multiple R',1,TRUE)
a<-table.element(a, sqrt(mysum$r.squared))
a<-table.row.end(a)
a<-table.row.start(a)
a<-table.element(a, 'R-squared',1,TRUE)
a<-table.element(a, mysum$r.squared)
a<-table.row.end(a)
a<-table.row.start(a)
a<-table.element(a, 'Adjusted R-squared',1,TRUE)
a<-table.element(a, mysum$adj.r.squared)
a<-table.row.end(a)
a<-table.row.start(a)
a<-table.element(a, 'F-TEST (value)',1,TRUE)
a<-table.element(a, mysum$fstatistic[1])
a<-table.row.end(a)
a<-table.row.start(a)
a<-table.element(a, 'F-TEST (DF numerator)',1,TRUE)
a<-table.element(a, mysum$fstatistic[2])
a<-table.row.end(a)
a<-table.row.start(a)
a<-table.element(a, 'F-TEST (DF denominator)',1,TRUE)
a<-table.element(a, mysum$fstatistic[3])
a<-table.row.end(a)
a<-table.row.start(a)
a<-table.element(a, 'p-value',1,TRUE)
a<-table.element(a, 1-pf(mysum$fstatistic[1],mysum$fstatistic[2],mysum$fstatistic[3]))
a<-table.row.end(a)
a<-table.row.start(a)
a<-table.element(a, 'Multiple Linear Regression - Residual Statistics', 2, TRUE)
a<-table.row.end(a)
a<-table.row.start(a)
a<-table.element(a, 'Residual Standard Deviation',1,TRUE)
a<-table.element(a, mysum$sigma)
a<-table.row.end(a)
a<-table.row.start(a)
a<-table.element(a, 'Sum Squared Residuals',1,TRUE)
a<-table.element(a, sum(myerror*myerror))
a<-table.row.end(a)
a<-table.end(a)
table.save(a,file='mytable3.tab')
a<-table.start()
a<-table.row.start(a)
a<-table.element(a, 'Multiple Linear Regression - Actuals, Interpolation, and Residuals', 4, TRUE)
a<-table.row.end(a)
a<-table.row.start(a)
a<-table.element(a, 'Time or Index', 1, TRUE)
a<-table.element(a, 'Actuals', 1, TRUE)
a<-table.element(a, 'Interpolation
Forecast', 1, TRUE)
a<-table.element(a, 'Residuals
Prediction Error', 1, TRUE)
a<-table.row.end(a)
for (i in 1:n) {
a<-table.row.start(a)
a<-table.element(a,i, 1, TRUE)
a<-table.element(a,x[i])
a<-table.element(a,x[i]-mysum$resid[i])
a<-table.element(a,mysum$resid[i])
a<-table.row.end(a)
}
a<-table.end(a)
table.save(a,file='mytable4.tab')
if (n > n25) {
a<-table.start()
a<-table.row.start(a)
a<-table.element(a,'Goldfeld-Quandt test for Heteroskedasticity',4,TRUE)
a<-table.row.end(a)
a<-table.row.start(a)
a<-table.element(a,'p-values',header=TRUE)
a<-table.element(a,'Alternative Hypothesis',3,header=TRUE)
a<-table.row.end(a)
a<-table.row.start(a)
a<-table.element(a,'breakpoint index',header=TRUE)
a<-table.element(a,'greater',header=TRUE)
a<-table.element(a,'2-sided',header=TRUE)
a<-table.element(a,'less',header=TRUE)
a<-table.row.end(a)
for (mypoint in kp3:nmkm3) {
a<-table.row.start(a)
a<-table.element(a,mypoint,header=TRUE)
a<-table.element(a,gqarr[mypoint-kp3+1,1])
a<-table.element(a,gqarr[mypoint-kp3+1,2])
a<-table.element(a,gqarr[mypoint-kp3+1,3])
a<-table.row.end(a)
}
a<-table.end(a)
table.save(a,file='mytable5.tab')
a<-table.start()
a<-table.row.start(a)
a<-table.element(a,'Meta Analysis of Goldfeld-Quandt test for Heteroskedasticity',4,TRUE)
a<-table.row.end(a)
a<-table.row.start(a)
a<-table.element(a,'Description',header=TRUE)
a<-table.element(a,'# significant tests',header=TRUE)
a<-table.element(a,'% significant tests',header=TRUE)
a<-table.element(a,'OK/NOK',header=TRUE)
a<-table.row.end(a)
a<-table.row.start(a)
a<-table.element(a,'1% type I error level',header=TRUE)
a<-table.element(a,numsignificant1)
a<-table.element(a,numsignificant1/numgqtests)
if (numsignificant1/numgqtests < 0.01) dum <- 'OK' else dum <- 'NOK'
a<-table.element(a,dum)
a<-table.row.end(a)
a<-table.row.start(a)
a<-table.element(a,'5% type I error level',header=TRUE)
a<-table.element(a,numsignificant5)
a<-table.element(a,numsignificant5/numgqtests)
if (numsignificant5/numgqtests < 0.05) dum <- 'OK' else dum <- 'NOK'
a<-table.element(a,dum)
a<-table.row.end(a)
a<-table.row.start(a)
a<-table.element(a,'10% type I error level',header=TRUE)
a<-table.element(a,numsignificant10)
a<-table.element(a,numsignificant10/numgqtests)
if (numsignificant10/numgqtests < 0.1) dum <- 'OK' else dum <- 'NOK'
a<-table.element(a,dum)
a<-table.row.end(a)
a<-table.end(a)
table.save(a,file='mytable6.tab')
}