Free Statistics

of Irreproducible Research!

Author's title

Author*The author of this computation has been verified*
R Software Modulerwasp_multipleregression.wasp
Title produced by softwareMultiple Regression
Date of computationMon, 13 Dec 2010 21:17:36 +0000
Cite this page as followsStatistical Computations at FreeStatistics.org, Office for Research Development and Education, URL https://freestatistics.org/blog/index.php?v=date/2010/Dec/13/t1292274933jcnlgfp12pdo9ls.htm/, Retrieved Tue, 07 May 2024 04:15:48 +0000
Statistical Computations at FreeStatistics.org, Office for Research Development and Education, URL https://freestatistics.org/blog/index.php?pk=109209, Retrieved Tue, 07 May 2024 04:15:48 +0000
QR Codes:

Original text written by user:
IsPrivate?No (this computation is public)
User-defined keywords
Estimated Impact140
Family? (F = Feedback message, R = changed R code, M = changed R Module, P = changed Parameters, D = changed Data)
-     [Multiple Regression] [] [2010-12-05 18:56:24] [b98453cac15ba1066b407e146608df68]
-   PD    [Multiple Regression] [MR] [2010-12-13 21:17:36] [8bf9de033bd61652831a8b7489bc3566] [Current]
Feedback Forum

Post a new message
Dataseries X:
2649.2	31077	
2579.4	31293	
2504.6	30236	
2462.3	30160	
2467.4	32436	
2446.7	30695	
2656.3	27525	
2626.2	26434	
2482.6	25739	
2539.9	25204	
2502.7	24977	
2466.9	24320	
2513.2	22680	
2443.3	22052	
2293.4	21467	
2070.8	21383	
2029.6	21777	
2052 	21928	
1864.4	21814	
1670.1	22937	
1811 	 23595	
1905.4	20830	
1862.8	19650
2014.5	19195	
2197.8	19644	
2962.3	18483	
3047 	 18079	
3032.6	19178	
3504.4	18391	
3801.1	18441	
3857.6	18584	
3674.4	20108	
3721 	20148	
3844.5	19394	
4116.7	17745	
4105.2	17696	
4435.2	17032	
4296.5	16438	
4202.5	15683	
4562.8	15594	
4621.4	15713	
4697 	 15937	
4591.3	16171	
4357 	 15928	
4502.6	16348	
4443.9	15579	
4290.9	15305
4199.8	15648	
4138.5	14954	
3970.1	15137	
3862.3	15839	
3701.6	16050	
3570.12 	15168 	
3801.06 	17064 	
3895.51 	16005 	
3917.96 	14886 	
3813.06 	14931 	
3667.03 	14544 	
3494.17 	13812 	
3364	 13031	
3295.3	12574	
3277.0	11964	
3257.2	11451	
3161.7	11346	
3097.3	11353	
3061.3	10702	
3119.3	10646	
3106.22 	10556 	
3080.58 	10463 	
2981.85 	10407 	


Summary of computational transaction
Raw Inputview raw input (R code)
Raw Outputview raw output of R engine
Computing time8 seconds
R Server'George Udny Yule' @ 72.249.76.132

\begin{tabular}{lllllllll}
\hline
Summary of computational transaction \tabularnewline
Raw Input & view raw input (R code)  \tabularnewline
Raw Output & view raw output of R engine  \tabularnewline
Computing time & 8 seconds \tabularnewline
R Server & 'George Udny Yule' @ 72.249.76.132 \tabularnewline
\hline
\end{tabular}
%Source: https://freestatistics.org/blog/index.php?pk=109209&T=0

[TABLE]
[ROW][C]Summary of computational transaction[/C][/ROW]
[ROW][C]Raw Input[/C][C]view raw input (R code) [/C][/ROW]
[ROW][C]Raw Output[/C][C]view raw output of R engine [/C][/ROW]
[ROW][C]Computing time[/C][C]8 seconds[/C][/ROW]
[ROW][C]R Server[/C][C]'George Udny Yule' @ 72.249.76.132[/C][/ROW]
[/TABLE]
Source: https://freestatistics.org/blog/index.php?pk=109209&T=0

Globally Unique Identifier (entire table): ba.freestatistics.org/blog/index.php?pk=109209&T=0

As an alternative you can also use a QR Code:  

The GUIDs for individual cells are displayed in the table below:

Summary of computational transaction
Raw Inputview raw input (R code)
Raw Outputview raw output of R engine
Computing time8 seconds
R Server'George Udny Yule' @ 72.249.76.132


Multiple Linear Regression - Estimated Regression Equation
Bel20[t] = + 4765.30342448302 -0.081675043345911Goudprijs[t] + e[t]

\begin{tabular}{lllllllll}
\hline
Multiple Linear Regression - Estimated Regression Equation \tabularnewline
Bel20[t] =  +  4765.30342448302 -0.081675043345911Goudprijs[t]  + e[t] \tabularnewline
\hline
\end{tabular}
%Source: https://freestatistics.org/blog/index.php?pk=109209&T=1

[TABLE]
[ROW][C]Multiple Linear Regression - Estimated Regression Equation[/C][/ROW]
[ROW][C]Bel20[t] =  +  4765.30342448302 -0.081675043345911Goudprijs[t]  + e[t][/C][/ROW]
[/TABLE]
Source: https://freestatistics.org/blog/index.php?pk=109209&T=1

Globally Unique Identifier (entire table): ba.freestatistics.org/blog/index.php?pk=109209&T=1

As an alternative you can also use a QR Code:  

The GUIDs for individual cells are displayed in the table below:

Multiple Linear Regression - Estimated Regression Equation
Bel20[t] = + 4765.30342448302 -0.081675043345911Goudprijs[t] + e[t]


Multiple Linear Regression - Ordinary Least Squares
VariableParameterS.D.T-STATH0: parameter = 02-tail p-value1-tail p-value
(Intercept)4765.30342448302301.41617715.809700
Goudprijs-0.0816750433459110.015442-5.28921e-061e-06

\begin{tabular}{lllllllll}
\hline
Multiple Linear Regression - Ordinary Least Squares \tabularnewline
Variable & Parameter & S.D. & T-STATH0: parameter = 0 & 2-tail p-value & 1-tail p-value \tabularnewline
(Intercept) & 4765.30342448302 & 301.416177 & 15.8097 & 0 & 0 \tabularnewline
Goudprijs & -0.081675043345911 & 0.015442 & -5.2892 & 1e-06 & 1e-06 \tabularnewline
\hline
\end{tabular}
%Source: https://freestatistics.org/blog/index.php?pk=109209&T=2

[TABLE]
[ROW][C]Multiple Linear Regression - Ordinary Least Squares[/C][/ROW]
[ROW][C]Variable[/C][C]Parameter[/C][C]S.D.[/C][C]T-STATH0: parameter = 0[/C][C]2-tail p-value[/C][C]1-tail p-value[/C][/ROW]
[ROW][C](Intercept)[/C][C]4765.30342448302[/C][C]301.416177[/C][C]15.8097[/C][C]0[/C][C]0[/C][/ROW]
[ROW][C]Goudprijs[/C][C]-0.081675043345911[/C][C]0.015442[/C][C]-5.2892[/C][C]1e-06[/C][C]1e-06[/C][/ROW]
[/TABLE]
Source: https://freestatistics.org/blog/index.php?pk=109209&T=2

Globally Unique Identifier (entire table): ba.freestatistics.org/blog/index.php?pk=109209&T=2

As an alternative you can also use a QR Code:  

The GUIDs for individual cells are displayed in the table below:

Multiple Linear Regression - Ordinary Least Squares
VariableParameterS.D.T-STATH0: parameter = 02-tail p-value1-tail p-value
(Intercept)4765.30342448302301.41617715.809700
Goudprijs-0.0816750433459110.015442-5.28921e-061e-06


Multiple Linear Regression - Regression Statistics
Multiple R0.539896177404536
R-squared0.29148788237603
Adjusted R-squared0.281068586528619
F-TEST (value)27.9757755845325
F-TEST (DF numerator)1
F-TEST (DF denominator)68
p-value1.41125002617315e-06
Multiple Linear Regression - Residual Statistics
Residual Standard Deviation719.60904727157
Sum Squared Residuals35212928.3022266

\begin{tabular}{lllllllll}
\hline
Multiple Linear Regression - Regression Statistics \tabularnewline
Multiple R & 0.539896177404536 \tabularnewline
R-squared & 0.29148788237603 \tabularnewline
Adjusted R-squared & 0.281068586528619 \tabularnewline
F-TEST (value) & 27.9757755845325 \tabularnewline
F-TEST (DF numerator) & 1 \tabularnewline
F-TEST (DF denominator) & 68 \tabularnewline
p-value & 1.41125002617315e-06 \tabularnewline
Multiple Linear Regression - Residual Statistics \tabularnewline
Residual Standard Deviation & 719.60904727157 \tabularnewline
Sum Squared Residuals & 35212928.3022266 \tabularnewline
\hline
\end{tabular}
%Source: https://freestatistics.org/blog/index.php?pk=109209&T=3

[TABLE]
[ROW][C]Multiple Linear Regression - Regression Statistics[/C][/ROW]
[ROW][C]Multiple R[/C][C]0.539896177404536[/C][/ROW]
[ROW][C]R-squared[/C][C]0.29148788237603[/C][/ROW]
[ROW][C]Adjusted R-squared[/C][C]0.281068586528619[/C][/ROW]
[ROW][C]F-TEST (value)[/C][C]27.9757755845325[/C][/ROW]
[ROW][C]F-TEST (DF numerator)[/C][C]1[/C][/ROW]
[ROW][C]F-TEST (DF denominator)[/C][C]68[/C][/ROW]
[ROW][C]p-value[/C][C]1.41125002617315e-06[/C][/ROW]
[ROW][C]Multiple Linear Regression - Residual Statistics[/C][/ROW]
[ROW][C]Residual Standard Deviation[/C][C]719.60904727157[/C][/ROW]
[ROW][C]Sum Squared Residuals[/C][C]35212928.3022266[/C][/ROW]
[/TABLE]
Source: https://freestatistics.org/blog/index.php?pk=109209&T=3

Globally Unique Identifier (entire table): ba.freestatistics.org/blog/index.php?pk=109209&T=3

As an alternative you can also use a QR Code:  

The GUIDs for individual cells are displayed in the table below:

Multiple Linear Regression - Regression Statistics
Multiple R0.539896177404536
R-squared0.29148788237603
Adjusted R-squared0.281068586528619
F-TEST (value)27.9757755845325
F-TEST (DF numerator)1
F-TEST (DF denominator)68
p-value1.41125002617315e-06
Multiple Linear Regression - Residual Statistics
Residual Standard Deviation719.60904727157
Sum Squared Residuals35212928.3022266


Multiple Linear Regression - Actuals, Interpolation, and Residuals
Time or IndexActualsInterpolationForecastResidualsPrediction Error
12649.22227.08810242213422.111897577871
22579.42209.44629305942369.953706940576
32504.62295.77681387605208.823186123949
42462.32301.98411717034160.315882829660
52467.42116.09171851505351.308281484953
62446.72258.28796898028188.412031019722
72656.32517.19785638682139.102143613184
82626.22606.3053286772119.8946713227949
92482.62663.06948380261-180.469483802613
102539.92706.76563199268-166.865631992675
112502.72725.30586683220-222.605866832197
122466.92778.96637031046-312.066370310461
132513.22912.91344139775-399.713441397755
142443.32964.20536861899-520.905368618987
152293.43011.98526897634-718.585268976345
162070.83018.8459726174-948.045972617401
172029.62986.66600553911-957.066005539113
1820522974.33307399388-922.33307399388
191864.42983.64402893531-1119.24402893531
201670.12891.92295525786-1221.82295525786
2118112838.18077673625-1027.18077673625
221905.43064.01227158769-1158.61227158769
231862.83160.38882273587-1297.58882273587
242014.53197.55096745825-1183.05096745825
252197.83160.87887299594-963.07887299594
262962.33255.70359832054-293.403598320543
2730473288.70031583229-241.700315832291
283032.63198.93944319514-166.339443195135
293504.43263.21770230837241.182297691633
303801.13259.13395014107541.966049858928
313857.63247.45441894261610.145581057394
323674.43122.98165288344551.418347116562
3337213119.7146511496601.285348850399
343844.53181.29763383242663.202366167582
354116.73315.97978030983800.720219690174
364105.23319.98185743378785.218142566225
374435.23374.214086215461060.98591378454
384296.53422.72906196293873.770938037069
394202.53484.39371968909718.106280310906
404562.83491.662798546881071.13720145312
414621.43481.943468388721139.45653161128
4246973463.648258679231233.35174132077
434591.33444.536298536291146.76370146371
4443573464.38333406935892.616665930654
454502.63430.079815864061072.52018413594
464443.93492.88792419707951.01207580293
474290.93515.26688607385775.633113926151
484199.83487.2523462062712.5476537938
494138.53543.93482628826594.565173711737
503970.13528.98829335596441.111706644038
513862.33471.65241292713390.647587072868
523701.63454.41897878114247.181021218855
533570.123526.4563670122443.6636329877617
543801.063371.60048482839429.459515171609
553895.513458.09435573171437.415644268290
563917.963549.48872923579368.471270764215
573813.063545.81335228522267.246647714781
583667.033577.4215940600989.6084059399136
593494.173637.20772578929-143.037725789293
6033643700.99593464245-336.99593464245
613295.33738.32142945153-443.021429451531
6232773788.14320589254-511.143205892537
633257.23830.04250312899-572.84250312899
643161.73838.61838268031-676.91838268031
653097.33838.04665737689-740.746657376889
663061.33891.21711059508-829.917110595077
673119.33895.79091302245-776.490913022448
683106.223903.14166692358-796.92166692358
693080.583910.73744595475-830.15744595475
702981.853915.31124838212-933.46124838212

\begin{tabular}{lllllllll}
\hline
Multiple Linear Regression - Actuals, Interpolation, and Residuals \tabularnewline
Time or Index & Actuals & InterpolationForecast & ResidualsPrediction Error \tabularnewline
1 & 2649.2 & 2227.08810242213 & 422.111897577871 \tabularnewline
2 & 2579.4 & 2209.44629305942 & 369.953706940576 \tabularnewline
3 & 2504.6 & 2295.77681387605 & 208.823186123949 \tabularnewline
4 & 2462.3 & 2301.98411717034 & 160.315882829660 \tabularnewline
5 & 2467.4 & 2116.09171851505 & 351.308281484953 \tabularnewline
6 & 2446.7 & 2258.28796898028 & 188.412031019722 \tabularnewline
7 & 2656.3 & 2517.19785638682 & 139.102143613184 \tabularnewline
8 & 2626.2 & 2606.30532867721 & 19.8946713227949 \tabularnewline
9 & 2482.6 & 2663.06948380261 & -180.469483802613 \tabularnewline
10 & 2539.9 & 2706.76563199268 & -166.865631992675 \tabularnewline
11 & 2502.7 & 2725.30586683220 & -222.605866832197 \tabularnewline
12 & 2466.9 & 2778.96637031046 & -312.066370310461 \tabularnewline
13 & 2513.2 & 2912.91344139775 & -399.713441397755 \tabularnewline
14 & 2443.3 & 2964.20536861899 & -520.905368618987 \tabularnewline
15 & 2293.4 & 3011.98526897634 & -718.585268976345 \tabularnewline
16 & 2070.8 & 3018.8459726174 & -948.045972617401 \tabularnewline
17 & 2029.6 & 2986.66600553911 & -957.066005539113 \tabularnewline
18 & 2052 & 2974.33307399388 & -922.33307399388 \tabularnewline
19 & 1864.4 & 2983.64402893531 & -1119.24402893531 \tabularnewline
20 & 1670.1 & 2891.92295525786 & -1221.82295525786 \tabularnewline
21 & 1811 & 2838.18077673625 & -1027.18077673625 \tabularnewline
22 & 1905.4 & 3064.01227158769 & -1158.61227158769 \tabularnewline
23 & 1862.8 & 3160.38882273587 & -1297.58882273587 \tabularnewline
24 & 2014.5 & 3197.55096745825 & -1183.05096745825 \tabularnewline
25 & 2197.8 & 3160.87887299594 & -963.07887299594 \tabularnewline
26 & 2962.3 & 3255.70359832054 & -293.403598320543 \tabularnewline
27 & 3047 & 3288.70031583229 & -241.700315832291 \tabularnewline
28 & 3032.6 & 3198.93944319514 & -166.339443195135 \tabularnewline
29 & 3504.4 & 3263.21770230837 & 241.182297691633 \tabularnewline
30 & 3801.1 & 3259.13395014107 & 541.966049858928 \tabularnewline
31 & 3857.6 & 3247.45441894261 & 610.145581057394 \tabularnewline
32 & 3674.4 & 3122.98165288344 & 551.418347116562 \tabularnewline
33 & 3721 & 3119.7146511496 & 601.285348850399 \tabularnewline
34 & 3844.5 & 3181.29763383242 & 663.202366167582 \tabularnewline
35 & 4116.7 & 3315.97978030983 & 800.720219690174 \tabularnewline
36 & 4105.2 & 3319.98185743378 & 785.218142566225 \tabularnewline
37 & 4435.2 & 3374.21408621546 & 1060.98591378454 \tabularnewline
38 & 4296.5 & 3422.72906196293 & 873.770938037069 \tabularnewline
39 & 4202.5 & 3484.39371968909 & 718.106280310906 \tabularnewline
40 & 4562.8 & 3491.66279854688 & 1071.13720145312 \tabularnewline
41 & 4621.4 & 3481.94346838872 & 1139.45653161128 \tabularnewline
42 & 4697 & 3463.64825867923 & 1233.35174132077 \tabularnewline
43 & 4591.3 & 3444.53629853629 & 1146.76370146371 \tabularnewline
44 & 4357 & 3464.38333406935 & 892.616665930654 \tabularnewline
45 & 4502.6 & 3430.07981586406 & 1072.52018413594 \tabularnewline
46 & 4443.9 & 3492.88792419707 & 951.01207580293 \tabularnewline
47 & 4290.9 & 3515.26688607385 & 775.633113926151 \tabularnewline
48 & 4199.8 & 3487.2523462062 & 712.5476537938 \tabularnewline
49 & 4138.5 & 3543.93482628826 & 594.565173711737 \tabularnewline
50 & 3970.1 & 3528.98829335596 & 441.111706644038 \tabularnewline
51 & 3862.3 & 3471.65241292713 & 390.647587072868 \tabularnewline
52 & 3701.6 & 3454.41897878114 & 247.181021218855 \tabularnewline
53 & 3570.12 & 3526.45636701224 & 43.6636329877617 \tabularnewline
54 & 3801.06 & 3371.60048482839 & 429.459515171609 \tabularnewline
55 & 3895.51 & 3458.09435573171 & 437.415644268290 \tabularnewline
56 & 3917.96 & 3549.48872923579 & 368.471270764215 \tabularnewline
57 & 3813.06 & 3545.81335228522 & 267.246647714781 \tabularnewline
58 & 3667.03 & 3577.42159406009 & 89.6084059399136 \tabularnewline
59 & 3494.17 & 3637.20772578929 & -143.037725789293 \tabularnewline
60 & 3364 & 3700.99593464245 & -336.99593464245 \tabularnewline
61 & 3295.3 & 3738.32142945153 & -443.021429451531 \tabularnewline
62 & 3277 & 3788.14320589254 & -511.143205892537 \tabularnewline
63 & 3257.2 & 3830.04250312899 & -572.84250312899 \tabularnewline
64 & 3161.7 & 3838.61838268031 & -676.91838268031 \tabularnewline
65 & 3097.3 & 3838.04665737689 & -740.746657376889 \tabularnewline
66 & 3061.3 & 3891.21711059508 & -829.917110595077 \tabularnewline
67 & 3119.3 & 3895.79091302245 & -776.490913022448 \tabularnewline
68 & 3106.22 & 3903.14166692358 & -796.92166692358 \tabularnewline
69 & 3080.58 & 3910.73744595475 & -830.15744595475 \tabularnewline
70 & 2981.85 & 3915.31124838212 & -933.46124838212 \tabularnewline
\hline
\end{tabular}
%Source: https://freestatistics.org/blog/index.php?pk=109209&T=4

[TABLE]
[ROW][C]Multiple Linear Regression - Actuals, Interpolation, and Residuals[/C][/ROW]
[ROW][C]Time or Index[/C][C]Actuals[/C][C]InterpolationForecast[/C][C]ResidualsPrediction Error[/C][/ROW]
[ROW][C]1[/C][C]2649.2[/C][C]2227.08810242213[/C][C]422.111897577871[/C][/ROW]
[ROW][C]2[/C][C]2579.4[/C][C]2209.44629305942[/C][C]369.953706940576[/C][/ROW]
[ROW][C]3[/C][C]2504.6[/C][C]2295.77681387605[/C][C]208.823186123949[/C][/ROW]
[ROW][C]4[/C][C]2462.3[/C][C]2301.98411717034[/C][C]160.315882829660[/C][/ROW]
[ROW][C]5[/C][C]2467.4[/C][C]2116.09171851505[/C][C]351.308281484953[/C][/ROW]
[ROW][C]6[/C][C]2446.7[/C][C]2258.28796898028[/C][C]188.412031019722[/C][/ROW]
[ROW][C]7[/C][C]2656.3[/C][C]2517.19785638682[/C][C]139.102143613184[/C][/ROW]
[ROW][C]8[/C][C]2626.2[/C][C]2606.30532867721[/C][C]19.8946713227949[/C][/ROW]
[ROW][C]9[/C][C]2482.6[/C][C]2663.06948380261[/C][C]-180.469483802613[/C][/ROW]
[ROW][C]10[/C][C]2539.9[/C][C]2706.76563199268[/C][C]-166.865631992675[/C][/ROW]
[ROW][C]11[/C][C]2502.7[/C][C]2725.30586683220[/C][C]-222.605866832197[/C][/ROW]
[ROW][C]12[/C][C]2466.9[/C][C]2778.96637031046[/C][C]-312.066370310461[/C][/ROW]
[ROW][C]13[/C][C]2513.2[/C][C]2912.91344139775[/C][C]-399.713441397755[/C][/ROW]
[ROW][C]14[/C][C]2443.3[/C][C]2964.20536861899[/C][C]-520.905368618987[/C][/ROW]
[ROW][C]15[/C][C]2293.4[/C][C]3011.98526897634[/C][C]-718.585268976345[/C][/ROW]
[ROW][C]16[/C][C]2070.8[/C][C]3018.8459726174[/C][C]-948.045972617401[/C][/ROW]
[ROW][C]17[/C][C]2029.6[/C][C]2986.66600553911[/C][C]-957.066005539113[/C][/ROW]
[ROW][C]18[/C][C]2052[/C][C]2974.33307399388[/C][C]-922.33307399388[/C][/ROW]
[ROW][C]19[/C][C]1864.4[/C][C]2983.64402893531[/C][C]-1119.24402893531[/C][/ROW]
[ROW][C]20[/C][C]1670.1[/C][C]2891.92295525786[/C][C]-1221.82295525786[/C][/ROW]
[ROW][C]21[/C][C]1811[/C][C]2838.18077673625[/C][C]-1027.18077673625[/C][/ROW]
[ROW][C]22[/C][C]1905.4[/C][C]3064.01227158769[/C][C]-1158.61227158769[/C][/ROW]
[ROW][C]23[/C][C]1862.8[/C][C]3160.38882273587[/C][C]-1297.58882273587[/C][/ROW]
[ROW][C]24[/C][C]2014.5[/C][C]3197.55096745825[/C][C]-1183.05096745825[/C][/ROW]
[ROW][C]25[/C][C]2197.8[/C][C]3160.87887299594[/C][C]-963.07887299594[/C][/ROW]
[ROW][C]26[/C][C]2962.3[/C][C]3255.70359832054[/C][C]-293.403598320543[/C][/ROW]
[ROW][C]27[/C][C]3047[/C][C]3288.70031583229[/C][C]-241.700315832291[/C][/ROW]
[ROW][C]28[/C][C]3032.6[/C][C]3198.93944319514[/C][C]-166.339443195135[/C][/ROW]
[ROW][C]29[/C][C]3504.4[/C][C]3263.21770230837[/C][C]241.182297691633[/C][/ROW]
[ROW][C]30[/C][C]3801.1[/C][C]3259.13395014107[/C][C]541.966049858928[/C][/ROW]
[ROW][C]31[/C][C]3857.6[/C][C]3247.45441894261[/C][C]610.145581057394[/C][/ROW]
[ROW][C]32[/C][C]3674.4[/C][C]3122.98165288344[/C][C]551.418347116562[/C][/ROW]
[ROW][C]33[/C][C]3721[/C][C]3119.7146511496[/C][C]601.285348850399[/C][/ROW]
[ROW][C]34[/C][C]3844.5[/C][C]3181.29763383242[/C][C]663.202366167582[/C][/ROW]
[ROW][C]35[/C][C]4116.7[/C][C]3315.97978030983[/C][C]800.720219690174[/C][/ROW]
[ROW][C]36[/C][C]4105.2[/C][C]3319.98185743378[/C][C]785.218142566225[/C][/ROW]
[ROW][C]37[/C][C]4435.2[/C][C]3374.21408621546[/C][C]1060.98591378454[/C][/ROW]
[ROW][C]38[/C][C]4296.5[/C][C]3422.72906196293[/C][C]873.770938037069[/C][/ROW]
[ROW][C]39[/C][C]4202.5[/C][C]3484.39371968909[/C][C]718.106280310906[/C][/ROW]
[ROW][C]40[/C][C]4562.8[/C][C]3491.66279854688[/C][C]1071.13720145312[/C][/ROW]
[ROW][C]41[/C][C]4621.4[/C][C]3481.94346838872[/C][C]1139.45653161128[/C][/ROW]
[ROW][C]42[/C][C]4697[/C][C]3463.64825867923[/C][C]1233.35174132077[/C][/ROW]
[ROW][C]43[/C][C]4591.3[/C][C]3444.53629853629[/C][C]1146.76370146371[/C][/ROW]
[ROW][C]44[/C][C]4357[/C][C]3464.38333406935[/C][C]892.616665930654[/C][/ROW]
[ROW][C]45[/C][C]4502.6[/C][C]3430.07981586406[/C][C]1072.52018413594[/C][/ROW]
[ROW][C]46[/C][C]4443.9[/C][C]3492.88792419707[/C][C]951.01207580293[/C][/ROW]
[ROW][C]47[/C][C]4290.9[/C][C]3515.26688607385[/C][C]775.633113926151[/C][/ROW]
[ROW][C]48[/C][C]4199.8[/C][C]3487.2523462062[/C][C]712.5476537938[/C][/ROW]
[ROW][C]49[/C][C]4138.5[/C][C]3543.93482628826[/C][C]594.565173711737[/C][/ROW]
[ROW][C]50[/C][C]3970.1[/C][C]3528.98829335596[/C][C]441.111706644038[/C][/ROW]
[ROW][C]51[/C][C]3862.3[/C][C]3471.65241292713[/C][C]390.647587072868[/C][/ROW]
[ROW][C]52[/C][C]3701.6[/C][C]3454.41897878114[/C][C]247.181021218855[/C][/ROW]
[ROW][C]53[/C][C]3570.12[/C][C]3526.45636701224[/C][C]43.6636329877617[/C][/ROW]
[ROW][C]54[/C][C]3801.06[/C][C]3371.60048482839[/C][C]429.459515171609[/C][/ROW]
[ROW][C]55[/C][C]3895.51[/C][C]3458.09435573171[/C][C]437.415644268290[/C][/ROW]
[ROW][C]56[/C][C]3917.96[/C][C]3549.48872923579[/C][C]368.471270764215[/C][/ROW]
[ROW][C]57[/C][C]3813.06[/C][C]3545.81335228522[/C][C]267.246647714781[/C][/ROW]
[ROW][C]58[/C][C]3667.03[/C][C]3577.42159406009[/C][C]89.6084059399136[/C][/ROW]
[ROW][C]59[/C][C]3494.17[/C][C]3637.20772578929[/C][C]-143.037725789293[/C][/ROW]
[ROW][C]60[/C][C]3364[/C][C]3700.99593464245[/C][C]-336.99593464245[/C][/ROW]
[ROW][C]61[/C][C]3295.3[/C][C]3738.32142945153[/C][C]-443.021429451531[/C][/ROW]
[ROW][C]62[/C][C]3277[/C][C]3788.14320589254[/C][C]-511.143205892537[/C][/ROW]
[ROW][C]63[/C][C]3257.2[/C][C]3830.04250312899[/C][C]-572.84250312899[/C][/ROW]
[ROW][C]64[/C][C]3161.7[/C][C]3838.61838268031[/C][C]-676.91838268031[/C][/ROW]
[ROW][C]65[/C][C]3097.3[/C][C]3838.04665737689[/C][C]-740.746657376889[/C][/ROW]
[ROW][C]66[/C][C]3061.3[/C][C]3891.21711059508[/C][C]-829.917110595077[/C][/ROW]
[ROW][C]67[/C][C]3119.3[/C][C]3895.79091302245[/C][C]-776.490913022448[/C][/ROW]
[ROW][C]68[/C][C]3106.22[/C][C]3903.14166692358[/C][C]-796.92166692358[/C][/ROW]
[ROW][C]69[/C][C]3080.58[/C][C]3910.73744595475[/C][C]-830.15744595475[/C][/ROW]
[ROW][C]70[/C][C]2981.85[/C][C]3915.31124838212[/C][C]-933.46124838212[/C][/ROW]
[/TABLE]
Source: https://freestatistics.org/blog/index.php?pk=109209&T=4

Globally Unique Identifier (entire table): ba.freestatistics.org/blog/index.php?pk=109209&T=4

As an alternative you can also use a QR Code:  

The GUIDs for individual cells are displayed in the table below:

Multiple Linear Regression - Actuals, Interpolation, and Residuals
Time or IndexActualsInterpolationForecastResidualsPrediction Error
12649.22227.08810242213422.111897577871
22579.42209.44629305942369.953706940576
32504.62295.77681387605208.823186123949
42462.32301.98411717034160.315882829660
52467.42116.09171851505351.308281484953
62446.72258.28796898028188.412031019722
72656.32517.19785638682139.102143613184
82626.22606.3053286772119.8946713227949
92482.62663.06948380261-180.469483802613
102539.92706.76563199268-166.865631992675
112502.72725.30586683220-222.605866832197
122466.92778.96637031046-312.066370310461
132513.22912.91344139775-399.713441397755
142443.32964.20536861899-520.905368618987
152293.43011.98526897634-718.585268976345
162070.83018.8459726174-948.045972617401
172029.62986.66600553911-957.066005539113
1820522974.33307399388-922.33307399388
191864.42983.64402893531-1119.24402893531
201670.12891.92295525786-1221.82295525786
2118112838.18077673625-1027.18077673625
221905.43064.01227158769-1158.61227158769
231862.83160.38882273587-1297.58882273587
242014.53197.55096745825-1183.05096745825
252197.83160.87887299594-963.07887299594
262962.33255.70359832054-293.403598320543
2730473288.70031583229-241.700315832291
283032.63198.93944319514-166.339443195135
293504.43263.21770230837241.182297691633
303801.13259.13395014107541.966049858928
313857.63247.45441894261610.145581057394
323674.43122.98165288344551.418347116562
3337213119.7146511496601.285348850399
343844.53181.29763383242663.202366167582
354116.73315.97978030983800.720219690174
364105.23319.98185743378785.218142566225
374435.23374.214086215461060.98591378454
384296.53422.72906196293873.770938037069
394202.53484.39371968909718.106280310906
404562.83491.662798546881071.13720145312
414621.43481.943468388721139.45653161128
4246973463.648258679231233.35174132077
434591.33444.536298536291146.76370146371
4443573464.38333406935892.616665930654
454502.63430.079815864061072.52018413594
464443.93492.88792419707951.01207580293
474290.93515.26688607385775.633113926151
484199.83487.2523462062712.5476537938
494138.53543.93482628826594.565173711737
503970.13528.98829335596441.111706644038
513862.33471.65241292713390.647587072868
523701.63454.41897878114247.181021218855
533570.123526.4563670122443.6636329877617
543801.063371.60048482839429.459515171609
553895.513458.09435573171437.415644268290
563917.963549.48872923579368.471270764215
573813.063545.81335228522267.246647714781
583667.033577.4215940600989.6084059399136
593494.173637.20772578929-143.037725789293
6033643700.99593464245-336.99593464245
613295.33738.32142945153-443.021429451531
6232773788.14320589254-511.143205892537
633257.23830.04250312899-572.84250312899
643161.73838.61838268031-676.91838268031
653097.33838.04665737689-740.746657376889
663061.33891.21711059508-829.917110595077
673119.33895.79091302245-776.490913022448
683106.223903.14166692358-796.92166692358
693080.583910.73744595475-830.15744595475
702981.853915.31124838212-933.46124838212


Goldfeld-Quandt test for Heteroskedasticity
p-valuesAlternative Hypothesis
breakpoint indexgreater2-sidedless
50.002717822522978930.005435645045957850.997282177477021
60.0004150891981442240.0008301783962884490.999584910801856
76.68518771421995e-050.0001337037542843990.999933148122858
86.89900309341026e-061.37980061868205e-050.999993100996907
92.22126770705098e-064.44253541410196e-060.999997778732293
102.53784292155581e-075.07568584311163e-070.999999746215708
113.24732413134827e-086.49464826269653e-080.999999967526759
124.9143344232158e-099.8286688464316e-090.999999995085666
134.81655077028751e-109.63310154057503e-100.999999999518345
146.98408639029019e-111.39681727805804e-100.99999999993016
158.25195391093207e-111.65039078218641e-100.99999999991748
161.87646094775231e-093.75292189550463e-090.99999999812354
176.24599451275262e-091.24919890255052e-080.999999993754006
186.3583802258866e-091.27167604517732e-080.99999999364162
193.11472950128520e-086.22945900257039e-080.999999968852705
207.9197403583946e-071.58394807167892e-060.999999208025964
212.76752853902068e-065.53505707804136e-060.999997232471461
223.89737589362887e-067.79475178725774e-060.999996102624106
238.86779339765293e-061.77355867953059e-050.999991132206602
242.5134035825225e-055.026807165045e-050.999974865964175
250.0001546900710266570.0003093801420533150.999845309928973
260.0108728383920840.0217456767841680.989127161607916
270.09323990378516890.1864798075703380.906760096214831
280.3291690120071370.6583380240142750.670830987992863
290.703501276267520.592997447464960.29649872373248
300.9144343046142330.1711313907715330.0855656953857666
310.9736948892380280.05261022152394380.0263051107619719
320.9952226387742830.009554722451433930.00477736122571697
330.9996882964826780.0006234070346440840.000311703517322042
340.9999881742206982.36515586048543e-051.18257793024272e-05
350.9999966324411266.7351177476962e-063.3675588738481e-06
360.999998905151892.18969622156121e-061.09484811078060e-06
370.9999992723215871.45535682619666e-067.27678413098331e-07
380.9999991253013751.74939725070256e-068.74698625351279e-07
390.9999985709143542.85817129294742e-061.42908564647371e-06
400.9999993493041931.30139161501156e-066.50695807505778e-07
410.9999997861336574.27732686701193e-072.13866343350597e-07
420.9999999626823627.4635276161619e-083.73176380808095e-08
430.999999985948772.81024586127777e-081.40512293063889e-08
440.9999999828918233.42163538686300e-081.71081769343150e-08
450.9999999906778961.86442086833993e-089.32210434169965e-09
460.9999999987486542.50269238949582e-091.25134619474791e-09
470.9999999998007523.98495372887314e-101.99247686443657e-10
480.9999999999171931.65613181862986e-108.2806590931493e-11
490.9999999999971355.73107512732147e-122.86553756366074e-12
500.999999999998792.4199652667224e-121.2099826333612e-12
510.999999999992931.41415934540421e-117.07079672702105e-12
520.9999999999751294.97425056713071e-112.48712528356536e-11
530.9999999999452061.09587845250076e-105.47939226250381e-11
540.999999999993771.24601356693217e-116.23006783466084e-12
550.999999999949041.01919167268810e-105.09595836344052e-11
560.9999999999843593.12830561633148e-111.56415280816574e-11
570.9999999999807743.84528040195124e-111.92264020097562e-11
580.9999999999061541.87692099076313e-109.38460495381565e-11
590.9999999987829522.43409558434155e-091.21704779217078e-09
600.999999984611593.07768201524078e-081.53884100762039e-08
610.9999998557974292.88405142925528e-071.44202571462764e-07
620.9999983041164653.39176707099134e-061.69588353549567e-06
630.9999945424296731.09151406548946e-055.45757032744732e-06
640.9999395496516010.0001209006967974926.0450348398746e-05
650.9994575151690320.001084969661936090.000542484830968046

\begin{tabular}{lllllllll}
\hline
Goldfeld-Quandt test for Heteroskedasticity \tabularnewline
p-values & Alternative Hypothesis \tabularnewline
breakpoint index & greater & 2-sided & less \tabularnewline
5 & 0.00271782252297893 & 0.00543564504595785 & 0.997282177477021 \tabularnewline
6 & 0.000415089198144224 & 0.000830178396288449 & 0.999584910801856 \tabularnewline
7 & 6.68518771421995e-05 & 0.000133703754284399 & 0.999933148122858 \tabularnewline
8 & 6.89900309341026e-06 & 1.37980061868205e-05 & 0.999993100996907 \tabularnewline
9 & 2.22126770705098e-06 & 4.44253541410196e-06 & 0.999997778732293 \tabularnewline
10 & 2.53784292155581e-07 & 5.07568584311163e-07 & 0.999999746215708 \tabularnewline
11 & 3.24732413134827e-08 & 6.49464826269653e-08 & 0.999999967526759 \tabularnewline
12 & 4.9143344232158e-09 & 9.8286688464316e-09 & 0.999999995085666 \tabularnewline
13 & 4.81655077028751e-10 & 9.63310154057503e-10 & 0.999999999518345 \tabularnewline
14 & 6.98408639029019e-11 & 1.39681727805804e-10 & 0.99999999993016 \tabularnewline
15 & 8.25195391093207e-11 & 1.65039078218641e-10 & 0.99999999991748 \tabularnewline
16 & 1.87646094775231e-09 & 3.75292189550463e-09 & 0.99999999812354 \tabularnewline
17 & 6.24599451275262e-09 & 1.24919890255052e-08 & 0.999999993754006 \tabularnewline
18 & 6.3583802258866e-09 & 1.27167604517732e-08 & 0.99999999364162 \tabularnewline
19 & 3.11472950128520e-08 & 6.22945900257039e-08 & 0.999999968852705 \tabularnewline
20 & 7.9197403583946e-07 & 1.58394807167892e-06 & 0.999999208025964 \tabularnewline
21 & 2.76752853902068e-06 & 5.53505707804136e-06 & 0.999997232471461 \tabularnewline
22 & 3.89737589362887e-06 & 7.79475178725774e-06 & 0.999996102624106 \tabularnewline
23 & 8.86779339765293e-06 & 1.77355867953059e-05 & 0.999991132206602 \tabularnewline
24 & 2.5134035825225e-05 & 5.026807165045e-05 & 0.999974865964175 \tabularnewline
25 & 0.000154690071026657 & 0.000309380142053315 & 0.999845309928973 \tabularnewline
26 & 0.010872838392084 & 0.021745676784168 & 0.989127161607916 \tabularnewline
27 & 0.0932399037851689 & 0.186479807570338 & 0.906760096214831 \tabularnewline
28 & 0.329169012007137 & 0.658338024014275 & 0.670830987992863 \tabularnewline
29 & 0.70350127626752 & 0.59299744746496 & 0.29649872373248 \tabularnewline
30 & 0.914434304614233 & 0.171131390771533 & 0.0855656953857666 \tabularnewline
31 & 0.973694889238028 & 0.0526102215239438 & 0.0263051107619719 \tabularnewline
32 & 0.995222638774283 & 0.00955472245143393 & 0.00477736122571697 \tabularnewline
33 & 0.999688296482678 & 0.000623407034644084 & 0.000311703517322042 \tabularnewline
34 & 0.999988174220698 & 2.36515586048543e-05 & 1.18257793024272e-05 \tabularnewline
35 & 0.999996632441126 & 6.7351177476962e-06 & 3.3675588738481e-06 \tabularnewline
36 & 0.99999890515189 & 2.18969622156121e-06 & 1.09484811078060e-06 \tabularnewline
37 & 0.999999272321587 & 1.45535682619666e-06 & 7.27678413098331e-07 \tabularnewline
38 & 0.999999125301375 & 1.74939725070256e-06 & 8.74698625351279e-07 \tabularnewline
39 & 0.999998570914354 & 2.85817129294742e-06 & 1.42908564647371e-06 \tabularnewline
40 & 0.999999349304193 & 1.30139161501156e-06 & 6.50695807505778e-07 \tabularnewline
41 & 0.999999786133657 & 4.27732686701193e-07 & 2.13866343350597e-07 \tabularnewline
42 & 0.999999962682362 & 7.4635276161619e-08 & 3.73176380808095e-08 \tabularnewline
43 & 0.99999998594877 & 2.81024586127777e-08 & 1.40512293063889e-08 \tabularnewline
44 & 0.999999982891823 & 3.42163538686300e-08 & 1.71081769343150e-08 \tabularnewline
45 & 0.999999990677896 & 1.86442086833993e-08 & 9.32210434169965e-09 \tabularnewline
46 & 0.999999998748654 & 2.50269238949582e-09 & 1.25134619474791e-09 \tabularnewline
47 & 0.999999999800752 & 3.98495372887314e-10 & 1.99247686443657e-10 \tabularnewline
48 & 0.999999999917193 & 1.65613181862986e-10 & 8.2806590931493e-11 \tabularnewline
49 & 0.999999999997135 & 5.73107512732147e-12 & 2.86553756366074e-12 \tabularnewline
50 & 0.99999999999879 & 2.4199652667224e-12 & 1.2099826333612e-12 \tabularnewline
51 & 0.99999999999293 & 1.41415934540421e-11 & 7.07079672702105e-12 \tabularnewline
52 & 0.999999999975129 & 4.97425056713071e-11 & 2.48712528356536e-11 \tabularnewline
53 & 0.999999999945206 & 1.09587845250076e-10 & 5.47939226250381e-11 \tabularnewline
54 & 0.99999999999377 & 1.24601356693217e-11 & 6.23006783466084e-12 \tabularnewline
55 & 0.99999999994904 & 1.01919167268810e-10 & 5.09595836344052e-11 \tabularnewline
56 & 0.999999999984359 & 3.12830561633148e-11 & 1.56415280816574e-11 \tabularnewline
57 & 0.999999999980774 & 3.84528040195124e-11 & 1.92264020097562e-11 \tabularnewline
58 & 0.999999999906154 & 1.87692099076313e-10 & 9.38460495381565e-11 \tabularnewline
59 & 0.999999998782952 & 2.43409558434155e-09 & 1.21704779217078e-09 \tabularnewline
60 & 0.99999998461159 & 3.07768201524078e-08 & 1.53884100762039e-08 \tabularnewline
61 & 0.999999855797429 & 2.88405142925528e-07 & 1.44202571462764e-07 \tabularnewline
62 & 0.999998304116465 & 3.39176707099134e-06 & 1.69588353549567e-06 \tabularnewline
63 & 0.999994542429673 & 1.09151406548946e-05 & 5.45757032744732e-06 \tabularnewline
64 & 0.999939549651601 & 0.000120900696797492 & 6.0450348398746e-05 \tabularnewline
65 & 0.999457515169032 & 0.00108496966193609 & 0.000542484830968046 \tabularnewline
\hline
\end{tabular}
%Source: https://freestatistics.org/blog/index.php?pk=109209&T=5

[TABLE]
[ROW][C]Goldfeld-Quandt test for Heteroskedasticity[/C][/ROW]
[ROW][C]p-values[/C][C]Alternative Hypothesis[/C][/ROW]
[ROW][C]breakpoint index[/C][C]greater[/C][C]2-sided[/C][C]less[/C][/ROW]
[ROW][C]5[/C][C]0.00271782252297893[/C][C]0.00543564504595785[/C][C]0.997282177477021[/C][/ROW]
[ROW][C]6[/C][C]0.000415089198144224[/C][C]0.000830178396288449[/C][C]0.999584910801856[/C][/ROW]
[ROW][C]7[/C][C]6.68518771421995e-05[/C][C]0.000133703754284399[/C][C]0.999933148122858[/C][/ROW]
[ROW][C]8[/C][C]6.89900309341026e-06[/C][C]1.37980061868205e-05[/C][C]0.999993100996907[/C][/ROW]
[ROW][C]9[/C][C]2.22126770705098e-06[/C][C]4.44253541410196e-06[/C][C]0.999997778732293[/C][/ROW]
[ROW][C]10[/C][C]2.53784292155581e-07[/C][C]5.07568584311163e-07[/C][C]0.999999746215708[/C][/ROW]
[ROW][C]11[/C][C]3.24732413134827e-08[/C][C]6.49464826269653e-08[/C][C]0.999999967526759[/C][/ROW]
[ROW][C]12[/C][C]4.9143344232158e-09[/C][C]9.8286688464316e-09[/C][C]0.999999995085666[/C][/ROW]
[ROW][C]13[/C][C]4.81655077028751e-10[/C][C]9.63310154057503e-10[/C][C]0.999999999518345[/C][/ROW]
[ROW][C]14[/C][C]6.98408639029019e-11[/C][C]1.39681727805804e-10[/C][C]0.99999999993016[/C][/ROW]
[ROW][C]15[/C][C]8.25195391093207e-11[/C][C]1.65039078218641e-10[/C][C]0.99999999991748[/C][/ROW]
[ROW][C]16[/C][C]1.87646094775231e-09[/C][C]3.75292189550463e-09[/C][C]0.99999999812354[/C][/ROW]
[ROW][C]17[/C][C]6.24599451275262e-09[/C][C]1.24919890255052e-08[/C][C]0.999999993754006[/C][/ROW]
[ROW][C]18[/C][C]6.3583802258866e-09[/C][C]1.27167604517732e-08[/C][C]0.99999999364162[/C][/ROW]
[ROW][C]19[/C][C]3.11472950128520e-08[/C][C]6.22945900257039e-08[/C][C]0.999999968852705[/C][/ROW]
[ROW][C]20[/C][C]7.9197403583946e-07[/C][C]1.58394807167892e-06[/C][C]0.999999208025964[/C][/ROW]
[ROW][C]21[/C][C]2.76752853902068e-06[/C][C]5.53505707804136e-06[/C][C]0.999997232471461[/C][/ROW]
[ROW][C]22[/C][C]3.89737589362887e-06[/C][C]7.79475178725774e-06[/C][C]0.999996102624106[/C][/ROW]
[ROW][C]23[/C][C]8.86779339765293e-06[/C][C]1.77355867953059e-05[/C][C]0.999991132206602[/C][/ROW]
[ROW][C]24[/C][C]2.5134035825225e-05[/C][C]5.026807165045e-05[/C][C]0.999974865964175[/C][/ROW]
[ROW][C]25[/C][C]0.000154690071026657[/C][C]0.000309380142053315[/C][C]0.999845309928973[/C][/ROW]
[ROW][C]26[/C][C]0.010872838392084[/C][C]0.021745676784168[/C][C]0.989127161607916[/C][/ROW]
[ROW][C]27[/C][C]0.0932399037851689[/C][C]0.186479807570338[/C][C]0.906760096214831[/C][/ROW]
[ROW][C]28[/C][C]0.329169012007137[/C][C]0.658338024014275[/C][C]0.670830987992863[/C][/ROW]
[ROW][C]29[/C][C]0.70350127626752[/C][C]0.59299744746496[/C][C]0.29649872373248[/C][/ROW]
[ROW][C]30[/C][C]0.914434304614233[/C][C]0.171131390771533[/C][C]0.0855656953857666[/C][/ROW]
[ROW][C]31[/C][C]0.973694889238028[/C][C]0.0526102215239438[/C][C]0.0263051107619719[/C][/ROW]
[ROW][C]32[/C][C]0.995222638774283[/C][C]0.00955472245143393[/C][C]0.00477736122571697[/C][/ROW]
[ROW][C]33[/C][C]0.999688296482678[/C][C]0.000623407034644084[/C][C]0.000311703517322042[/C][/ROW]
[ROW][C]34[/C][C]0.999988174220698[/C][C]2.36515586048543e-05[/C][C]1.18257793024272e-05[/C][/ROW]
[ROW][C]35[/C][C]0.999996632441126[/C][C]6.7351177476962e-06[/C][C]3.3675588738481e-06[/C][/ROW]
[ROW][C]36[/C][C]0.99999890515189[/C][C]2.18969622156121e-06[/C][C]1.09484811078060e-06[/C][/ROW]
[ROW][C]37[/C][C]0.999999272321587[/C][C]1.45535682619666e-06[/C][C]7.27678413098331e-07[/C][/ROW]
[ROW][C]38[/C][C]0.999999125301375[/C][C]1.74939725070256e-06[/C][C]8.74698625351279e-07[/C][/ROW]
[ROW][C]39[/C][C]0.999998570914354[/C][C]2.85817129294742e-06[/C][C]1.42908564647371e-06[/C][/ROW]
[ROW][C]40[/C][C]0.999999349304193[/C][C]1.30139161501156e-06[/C][C]6.50695807505778e-07[/C][/ROW]
[ROW][C]41[/C][C]0.999999786133657[/C][C]4.27732686701193e-07[/C][C]2.13866343350597e-07[/C][/ROW]
[ROW][C]42[/C][C]0.999999962682362[/C][C]7.4635276161619e-08[/C][C]3.73176380808095e-08[/C][/ROW]
[ROW][C]43[/C][C]0.99999998594877[/C][C]2.81024586127777e-08[/C][C]1.40512293063889e-08[/C][/ROW]
[ROW][C]44[/C][C]0.999999982891823[/C][C]3.42163538686300e-08[/C][C]1.71081769343150e-08[/C][/ROW]
[ROW][C]45[/C][C]0.999999990677896[/C][C]1.86442086833993e-08[/C][C]9.32210434169965e-09[/C][/ROW]
[ROW][C]46[/C][C]0.999999998748654[/C][C]2.50269238949582e-09[/C][C]1.25134619474791e-09[/C][/ROW]
[ROW][C]47[/C][C]0.999999999800752[/C][C]3.98495372887314e-10[/C][C]1.99247686443657e-10[/C][/ROW]
[ROW][C]48[/C][C]0.999999999917193[/C][C]1.65613181862986e-10[/C][C]8.2806590931493e-11[/C][/ROW]
[ROW][C]49[/C][C]0.999999999997135[/C][C]5.73107512732147e-12[/C][C]2.86553756366074e-12[/C][/ROW]
[ROW][C]50[/C][C]0.99999999999879[/C][C]2.4199652667224e-12[/C][C]1.2099826333612e-12[/C][/ROW]
[ROW][C]51[/C][C]0.99999999999293[/C][C]1.41415934540421e-11[/C][C]7.07079672702105e-12[/C][/ROW]
[ROW][C]52[/C][C]0.999999999975129[/C][C]4.97425056713071e-11[/C][C]2.48712528356536e-11[/C][/ROW]
[ROW][C]53[/C][C]0.999999999945206[/C][C]1.09587845250076e-10[/C][C]5.47939226250381e-11[/C][/ROW]
[ROW][C]54[/C][C]0.99999999999377[/C][C]1.24601356693217e-11[/C][C]6.23006783466084e-12[/C][/ROW]
[ROW][C]55[/C][C]0.99999999994904[/C][C]1.01919167268810e-10[/C][C]5.09595836344052e-11[/C][/ROW]
[ROW][C]56[/C][C]0.999999999984359[/C][C]3.12830561633148e-11[/C][C]1.56415280816574e-11[/C][/ROW]
[ROW][C]57[/C][C]0.999999999980774[/C][C]3.84528040195124e-11[/C][C]1.92264020097562e-11[/C][/ROW]
[ROW][C]58[/C][C]0.999999999906154[/C][C]1.87692099076313e-10[/C][C]9.38460495381565e-11[/C][/ROW]
[ROW][C]59[/C][C]0.999999998782952[/C][C]2.43409558434155e-09[/C][C]1.21704779217078e-09[/C][/ROW]
[ROW][C]60[/C][C]0.99999998461159[/C][C]3.07768201524078e-08[/C][C]1.53884100762039e-08[/C][/ROW]
[ROW][C]61[/C][C]0.999999855797429[/C][C]2.88405142925528e-07[/C][C]1.44202571462764e-07[/C][/ROW]
[ROW][C]62[/C][C]0.999998304116465[/C][C]3.39176707099134e-06[/C][C]1.69588353549567e-06[/C][/ROW]
[ROW][C]63[/C][C]0.999994542429673[/C][C]1.09151406548946e-05[/C][C]5.45757032744732e-06[/C][/ROW]
[ROW][C]64[/C][C]0.999939549651601[/C][C]0.000120900696797492[/C][C]6.0450348398746e-05[/C][/ROW]
[ROW][C]65[/C][C]0.999457515169032[/C][C]0.00108496966193609[/C][C]0.000542484830968046[/C][/ROW]
[/TABLE]
Source: https://freestatistics.org/blog/index.php?pk=109209&T=5

Globally Unique Identifier (entire table): ba.freestatistics.org/blog/index.php?pk=109209&T=5

As an alternative you can also use a QR Code:  

The GUIDs for individual cells are displayed in the table below:

Goldfeld-Quandt test for Heteroskedasticity
p-valuesAlternative Hypothesis
breakpoint indexgreater2-sidedless
50.002717822522978930.005435645045957850.997282177477021
60.0004150891981442240.0008301783962884490.999584910801856
76.68518771421995e-050.0001337037542843990.999933148122858
86.89900309341026e-061.37980061868205e-050.999993100996907
92.22126770705098e-064.44253541410196e-060.999997778732293
102.53784292155581e-075.07568584311163e-070.999999746215708
113.24732413134827e-086.49464826269653e-080.999999967526759
124.9143344232158e-099.8286688464316e-090.999999995085666
134.81655077028751e-109.63310154057503e-100.999999999518345
146.98408639029019e-111.39681727805804e-100.99999999993016
158.25195391093207e-111.65039078218641e-100.99999999991748
161.87646094775231e-093.75292189550463e-090.99999999812354
176.24599451275262e-091.24919890255052e-080.999999993754006
186.3583802258866e-091.27167604517732e-080.99999999364162
193.11472950128520e-086.22945900257039e-080.999999968852705
207.9197403583946e-071.58394807167892e-060.999999208025964
212.76752853902068e-065.53505707804136e-060.999997232471461
223.89737589362887e-067.79475178725774e-060.999996102624106
238.86779339765293e-061.77355867953059e-050.999991132206602
242.5134035825225e-055.026807165045e-050.999974865964175
250.0001546900710266570.0003093801420533150.999845309928973
260.0108728383920840.0217456767841680.989127161607916
270.09323990378516890.1864798075703380.906760096214831
280.3291690120071370.6583380240142750.670830987992863
290.703501276267520.592997447464960.29649872373248
300.9144343046142330.1711313907715330.0855656953857666
310.9736948892380280.05261022152394380.0263051107619719
320.9952226387742830.009554722451433930.00477736122571697
330.9996882964826780.0006234070346440840.000311703517322042
340.9999881742206982.36515586048543e-051.18257793024272e-05
350.9999966324411266.7351177476962e-063.3675588738481e-06
360.999998905151892.18969622156121e-061.09484811078060e-06
370.9999992723215871.45535682619666e-067.27678413098331e-07
380.9999991253013751.74939725070256e-068.74698625351279e-07
390.9999985709143542.85817129294742e-061.42908564647371e-06
400.9999993493041931.30139161501156e-066.50695807505778e-07
410.9999997861336574.27732686701193e-072.13866343350597e-07
420.9999999626823627.4635276161619e-083.73176380808095e-08
430.999999985948772.81024586127777e-081.40512293063889e-08
440.9999999828918233.42163538686300e-081.71081769343150e-08
450.9999999906778961.86442086833993e-089.32210434169965e-09
460.9999999987486542.50269238949582e-091.25134619474791e-09
470.9999999998007523.98495372887314e-101.99247686443657e-10
480.9999999999171931.65613181862986e-108.2806590931493e-11
490.9999999999971355.73107512732147e-122.86553756366074e-12
500.999999999998792.4199652667224e-121.2099826333612e-12
510.999999999992931.41415934540421e-117.07079672702105e-12
520.9999999999751294.97425056713071e-112.48712528356536e-11
530.9999999999452061.09587845250076e-105.47939226250381e-11
540.999999999993771.24601356693217e-116.23006783466084e-12
550.999999999949041.01919167268810e-105.09595836344052e-11
560.9999999999843593.12830561633148e-111.56415280816574e-11
570.9999999999807743.84528040195124e-111.92264020097562e-11
580.9999999999061541.87692099076313e-109.38460495381565e-11
590.9999999987829522.43409558434155e-091.21704779217078e-09
600.999999984611593.07768201524078e-081.53884100762039e-08
610.9999998557974292.88405142925528e-071.44202571462764e-07
620.9999983041164653.39176707099134e-061.69588353549567e-06
630.9999945424296731.09151406548946e-055.45757032744732e-06
640.9999395496516010.0001209006967974926.0450348398746e-05
650.9994575151690320.001084969661936090.000542484830968046


Meta Analysis of Goldfeld-Quandt test for Heteroskedasticity
Description# significant tests% significant testsOK/NOK
1% type I error level550.901639344262295NOK
5% type I error level560.918032786885246NOK
10% type I error level570.934426229508197NOK

\begin{tabular}{lllllllll}
\hline
Meta Analysis of Goldfeld-Quandt test for Heteroskedasticity \tabularnewline
Description & # significant tests & % significant tests & OK/NOK \tabularnewline
1% type I error level & 55 & 0.901639344262295 & NOK \tabularnewline
5% type I error level & 56 & 0.918032786885246 & NOK \tabularnewline
10% type I error level & 57 & 0.934426229508197 & NOK \tabularnewline
\hline
\end{tabular}
%Source: https://freestatistics.org/blog/index.php?pk=109209&T=6

[TABLE]
[ROW][C]Meta Analysis of Goldfeld-Quandt test for Heteroskedasticity[/C][/ROW]
[ROW][C]Description[/C][C]# significant tests[/C][C]% significant tests[/C][C]OK/NOK[/C][/ROW]
[ROW][C]1% type I error level[/C][C]55[/C][C]0.901639344262295[/C][C]NOK[/C][/ROW]
[ROW][C]5% type I error level[/C][C]56[/C][C]0.918032786885246[/C][C]NOK[/C][/ROW]
[ROW][C]10% type I error level[/C][C]57[/C][C]0.934426229508197[/C][C]NOK[/C][/ROW]
[/TABLE]
Source: https://freestatistics.org/blog/index.php?pk=109209&T=6

Globally Unique Identifier (entire table): ba.freestatistics.org/blog/index.php?pk=109209&T=6

As an alternative you can also use a QR Code:  

The GUIDs for individual cells are displayed in the table below:

Meta Analysis of Goldfeld-Quandt test for Heteroskedasticity
Description# significant tests% significant testsOK/NOK
1% type I error level550.901639344262295NOK
5% type I error level560.918032786885246NOK
10% type I error level570.934426229508197NOK


Parameters (Session):
par1 = pearson ;
Parameters (R input):
par1 = 1 ; par2 = Do not include Seasonal Dummies ; par3 = No Linear Trend ;
R code (references can be found in the software module):
library(lattice)
library(lmtest)
n25 <- 25 #minimum number of obs. for Goldfeld-Quandt test
par1 <- as.numeric(par1)
x <- t(y)
k <- length(x[1,])
n <- length(x[,1])
x1 <- cbind(x[,par1], x[,1:k!=par1])
mycolnames <- c(colnames(x)[par1], colnames(x)[1:k!=par1])
colnames(x1) <- mycolnames #colnames(x)[par1]
x <- x1
if (par3 == 'First Differences'){
x2 <- array(0, dim=c(n-1,k), dimnames=list(1:(n-1), paste('(1-B)',colnames(x),sep='')))
for (i in 1:n-1) {
for (j in 1:k) {
x2[i,j] <- x[i+1,j] - x[i,j]
}
}
x <- x2
}
if (par2 == 'Include Monthly Dummies'){
x2 <- array(0, dim=c(n,11), dimnames=list(1:n, paste('M', seq(1:11), sep ='')))
for (i in 1:11){
x2[seq(i,n,12),i] <- 1
}
x <- cbind(x, x2)
}
if (par2 == 'Include Quarterly Dummies'){
x2 <- array(0, dim=c(n,3), dimnames=list(1:n, paste('Q', seq(1:3), sep ='')))
for (i in 1:3){
x2[seq(i,n,4),i] <- 1
}
x <- cbind(x, x2)
}
k <- length(x[1,])
if (par3 == 'Linear Trend'){
x <- cbind(x, c(1:n))
colnames(x)[k+1] <- 't'
}
x
k <- length(x[1,])
df <- as.data.frame(x)
(mylm <- lm(df))
(mysum <- summary(mylm))
if (n > n25) {
kp3 <- k + 3
nmkm3 <- n - k - 3
gqarr <- array(NA, dim=c(nmkm3-kp3+1,3))
numgqtests <- 0
numsignificant1 <- 0
numsignificant5 <- 0
numsignificant10 <- 0
for (mypoint in kp3:nmkm3) {
j <- 0
numgqtests <- numgqtests + 1
for (myalt in c('greater', 'two.sided', 'less')) {
j <- j + 1
gqarr[mypoint-kp3+1,j] <- gqtest(mylm, point=mypoint, alternative=myalt)$p.value
}
if (gqarr[mypoint-kp3+1,2] < 0.01) numsignificant1 <- numsignificant1 + 1
if (gqarr[mypoint-kp3+1,2] < 0.05) numsignificant5 <- numsignificant5 + 1
if (gqarr[mypoint-kp3+1,2] < 0.10) numsignificant10 <- numsignificant10 + 1
}
gqarr
}
bitmap(file='test0.png')
plot(x[,1], type='l', main='Actuals and Interpolation', ylab='value of Actuals and Interpolation (dots)', xlab='time or index')
points(x[,1]-mysum$resid)
grid()
dev.off()
bitmap(file='test1.png')
plot(mysum$resid, type='b', pch=19, main='Residuals', ylab='value of Residuals', xlab='time or index')
grid()
dev.off()
bitmap(file='test2.png')
hist(mysum$resid, main='Residual Histogram', xlab='values of Residuals')
grid()
dev.off()
bitmap(file='test3.png')
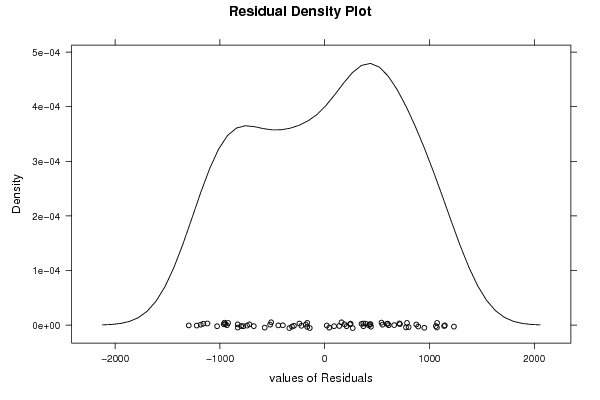
densityplot(~mysum$resid,col='black',main='Residual Density Plot', xlab='values of Residuals')
dev.off()
bitmap(file='test4.png')
qqnorm(mysum$resid, main='Residual Normal Q-Q Plot')
qqline(mysum$resid)
grid()
dev.off()
(myerror <- as.ts(mysum$resid))
bitmap(file='test5.png')
dum <- cbind(lag(myerror,k=1),myerror)
dum
dum1 <- dum[2:length(myerror),]
dum1
z <- as.data.frame(dum1)
z
plot(z,main=paste('Residual Lag plot, lowess, and regression line'), ylab='values of Residuals', xlab='lagged values of Residuals')
lines(lowess(z))
abline(lm(z))
grid()
dev.off()
bitmap(file='test6.png')
acf(mysum$resid, lag.max=length(mysum$resid)/2, main='Residual Autocorrelation Function')
grid()
dev.off()
bitmap(file='test7.png')
pacf(mysum$resid, lag.max=length(mysum$resid)/2, main='Residual Partial Autocorrelation Function')
grid()
dev.off()
bitmap(file='test8.png')
opar <- par(mfrow = c(2,2), oma = c(0, 0, 1.1, 0))
plot(mylm, las = 1, sub='Residual Diagnostics')
par(opar)
dev.off()
if (n > n25) {
bitmap(file='test9.png')
plot(kp3:nmkm3,gqarr[,2], main='Goldfeld-Quandt test',ylab='2-sided p-value',xlab='breakpoint')
grid()
dev.off()
}
load(file='createtable')
a<-table.start()
a<-table.row.start(a)
a<-table.element(a, 'Multiple Linear Regression - Estimated Regression Equation', 1, TRUE)
a<-table.row.end(a)
myeq <- colnames(x)[1]
myeq <- paste(myeq, '[t] = ', sep='')
for (i in 1:k){
if (mysum$coefficients[i,1] > 0) myeq <- paste(myeq, '+', '')
myeq <- paste(myeq, mysum$coefficients[i,1], sep=' ')
if (rownames(mysum$coefficients)[i] != '(Intercept)') {
myeq <- paste(myeq, rownames(mysum$coefficients)[i], sep='')
if (rownames(mysum$coefficients)[i] != 't') myeq <- paste(myeq, '[t]', sep='')
}
}
myeq <- paste(myeq, ' + e[t]')
a<-table.row.start(a)
a<-table.element(a, myeq)
a<-table.row.end(a)
a<-table.end(a)
table.save(a,file='mytable1.tab')
a<-table.start()
a<-table.row.start(a)
a<-table.element(a,hyperlink('ols1.htm','Multiple Linear Regression - Ordinary Least Squares',''), 6, TRUE)
a<-table.row.end(a)
a<-table.row.start(a)
a<-table.element(a,'Variable',header=TRUE)
a<-table.element(a,'Parameter',header=TRUE)
a<-table.element(a,'S.D.',header=TRUE)
a<-table.element(a,'T-STAT
H0: parameter = 0',header=TRUE)
a<-table.element(a,'2-tail p-value',header=TRUE)
a<-table.element(a,'1-tail p-value',header=TRUE)
a<-table.row.end(a)
for (i in 1:k){
a<-table.row.start(a)
a<-table.element(a,rownames(mysum$coefficients)[i],header=TRUE)
a<-table.element(a,mysum$coefficients[i,1])
a<-table.element(a, round(mysum$coefficients[i,2],6))
a<-table.element(a, round(mysum$coefficients[i,3],4))
a<-table.element(a, round(mysum$coefficients[i,4],6))
a<-table.element(a, round(mysum$coefficients[i,4]/2,6))
a<-table.row.end(a)
}
a<-table.end(a)
table.save(a,file='mytable2.tab')
a<-table.start()
a<-table.row.start(a)
a<-table.element(a, 'Multiple Linear Regression - Regression Statistics', 2, TRUE)
a<-table.row.end(a)
a<-table.row.start(a)
a<-table.element(a, 'Multiple R',1,TRUE)
a<-table.element(a, sqrt(mysum$r.squared))
a<-table.row.end(a)
a<-table.row.start(a)
a<-table.element(a, 'R-squared',1,TRUE)
a<-table.element(a, mysum$r.squared)
a<-table.row.end(a)
a<-table.row.start(a)
a<-table.element(a, 'Adjusted R-squared',1,TRUE)
a<-table.element(a, mysum$adj.r.squared)
a<-table.row.end(a)
a<-table.row.start(a)
a<-table.element(a, 'F-TEST (value)',1,TRUE)
a<-table.element(a, mysum$fstatistic[1])
a<-table.row.end(a)
a<-table.row.start(a)
a<-table.element(a, 'F-TEST (DF numerator)',1,TRUE)
a<-table.element(a, mysum$fstatistic[2])
a<-table.row.end(a)
a<-table.row.start(a)
a<-table.element(a, 'F-TEST (DF denominator)',1,TRUE)
a<-table.element(a, mysum$fstatistic[3])
a<-table.row.end(a)
a<-table.row.start(a)
a<-table.element(a, 'p-value',1,TRUE)
a<-table.element(a, 1-pf(mysum$fstatistic[1],mysum$fstatistic[2],mysum$fstatistic[3]))
a<-table.row.end(a)
a<-table.row.start(a)
a<-table.element(a, 'Multiple Linear Regression - Residual Statistics', 2, TRUE)
a<-table.row.end(a)
a<-table.row.start(a)
a<-table.element(a, 'Residual Standard Deviation',1,TRUE)
a<-table.element(a, mysum$sigma)
a<-table.row.end(a)
a<-table.row.start(a)
a<-table.element(a, 'Sum Squared Residuals',1,TRUE)
a<-table.element(a, sum(myerror*myerror))
a<-table.row.end(a)
a<-table.end(a)
table.save(a,file='mytable3.tab')
a<-table.start()
a<-table.row.start(a)
a<-table.element(a, 'Multiple Linear Regression - Actuals, Interpolation, and Residuals', 4, TRUE)
a<-table.row.end(a)
a<-table.row.start(a)
a<-table.element(a, 'Time or Index', 1, TRUE)
a<-table.element(a, 'Actuals', 1, TRUE)
a<-table.element(a, 'Interpolation
Forecast', 1, TRUE)
a<-table.element(a, 'Residuals
Prediction Error', 1, TRUE)
a<-table.row.end(a)
for (i in 1:n) {
a<-table.row.start(a)
a<-table.element(a,i, 1, TRUE)
a<-table.element(a,x[i])
a<-table.element(a,x[i]-mysum$resid[i])
a<-table.element(a,mysum$resid[i])
a<-table.row.end(a)
}
a<-table.end(a)
table.save(a,file='mytable4.tab')
if (n > n25) {
a<-table.start()
a<-table.row.start(a)
a<-table.element(a,'Goldfeld-Quandt test for Heteroskedasticity',4,TRUE)
a<-table.row.end(a)
a<-table.row.start(a)
a<-table.element(a,'p-values',header=TRUE)
a<-table.element(a,'Alternative Hypothesis',3,header=TRUE)
a<-table.row.end(a)
a<-table.row.start(a)
a<-table.element(a,'breakpoint index',header=TRUE)
a<-table.element(a,'greater',header=TRUE)
a<-table.element(a,'2-sided',header=TRUE)
a<-table.element(a,'less',header=TRUE)
a<-table.row.end(a)
for (mypoint in kp3:nmkm3) {
a<-table.row.start(a)
a<-table.element(a,mypoint,header=TRUE)
a<-table.element(a,gqarr[mypoint-kp3+1,1])
a<-table.element(a,gqarr[mypoint-kp3+1,2])
a<-table.element(a,gqarr[mypoint-kp3+1,3])
a<-table.row.end(a)
}
a<-table.end(a)
table.save(a,file='mytable5.tab')
a<-table.start()
a<-table.row.start(a)
a<-table.element(a,'Meta Analysis of Goldfeld-Quandt test for Heteroskedasticity',4,TRUE)
a<-table.row.end(a)
a<-table.row.start(a)
a<-table.element(a,'Description',header=TRUE)
a<-table.element(a,'# significant tests',header=TRUE)
a<-table.element(a,'% significant tests',header=TRUE)
a<-table.element(a,'OK/NOK',header=TRUE)
a<-table.row.end(a)
a<-table.row.start(a)
a<-table.element(a,'1% type I error level',header=TRUE)
a<-table.element(a,numsignificant1)
a<-table.element(a,numsignificant1/numgqtests)
if (numsignificant1/numgqtests < 0.01) dum <- 'OK' else dum <- 'NOK'
a<-table.element(a,dum)
a<-table.row.end(a)
a<-table.row.start(a)
a<-table.element(a,'5% type I error level',header=TRUE)
a<-table.element(a,numsignificant5)
a<-table.element(a,numsignificant5/numgqtests)
if (numsignificant5/numgqtests < 0.05) dum <- 'OK' else dum <- 'NOK'
a<-table.element(a,dum)
a<-table.row.end(a)
a<-table.row.start(a)
a<-table.element(a,'10% type I error level',header=TRUE)
a<-table.element(a,numsignificant10)
a<-table.element(a,numsignificant10/numgqtests)
if (numsignificant10/numgqtests < 0.1) dum <- 'OK' else dum <- 'NOK'
a<-table.element(a,dum)
a<-table.row.end(a)
a<-table.end(a)
table.save(a,file='mytable6.tab')
}