| Multiple Linear Regression - Estimated Regression Equation |
| SWS[t] = + 13.3314877028357 -0.00118099576118958L[t] + 3.33203879623901e-06Wb[t] -1.29400146501444e-06Wbr[t] -0.0138038212724133Tg[t] + 1.41477355759408P[t] + 0.224417796700898S[t] -2.79911484965773D[t] + e[t] |
| Multiple Linear Regression - Ordinary Least Squares | |||||
| Variable | Parameter | S.D. | T-STAT H0: parameter = 0 | 2-tail p-value | 1-tail p-value |
| (Intercept) | 13.3314877028357 | 1.256475 | 10.6102 | 0 | 0 |
| L | -0.00118099576118958 | 0.043509 | -0.0271 | 0.978504 | 0.489252 |
| Wb | 3.33203879623901e-06 | 6e-06 | 0.5985 | 0.5535 | 0.27675 |
| Wbr | -1.29400146501444e-06 | 3e-06 | -0.3872 | 0.700988 | 0.350494 |
| Tg | -0.0138038212724133 | 0.006563 | -2.1034 | 0.042903 | 0.021452 |
| P | 1.41477355759408 | 1.02735 | 1.3771 | 0.177478 | 0.088739 |
| S | 0.224417796700898 | 0.643644 | 0.3487 | 0.729489 | 0.364744 |
| D | -2.79911484965773 | 1.27563 | -2.1943 | 0.035145 | 0.017572 |
| Multiple Linear Regression - Regression Statistics | |
| Multiple R | 0.735121557008726 |
| R-squared | 0.540403703578934 |
| Adjusted R-squared | 0.445780936668714 |
| F-TEST (value) | 5.71113825166075 |
| F-TEST (DF numerator) | 7 |
| F-TEST (DF denominator) | 34 |
| p-value | 0.000201404658730864 |
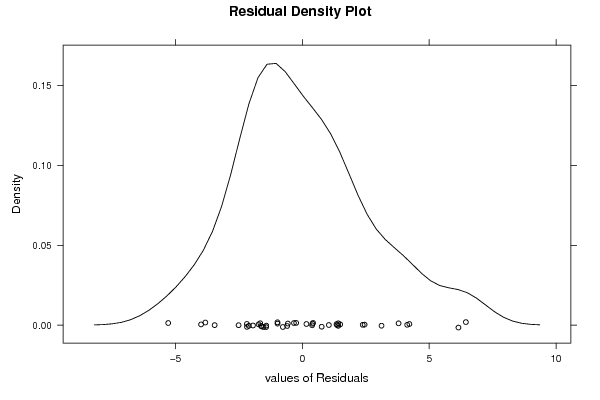
| Multiple Linear Regression - Residual Statistics | |
| Residual Standard Deviation | 2.85681421218203 |
| Sum Squared Residuals | 277.487173059458 |
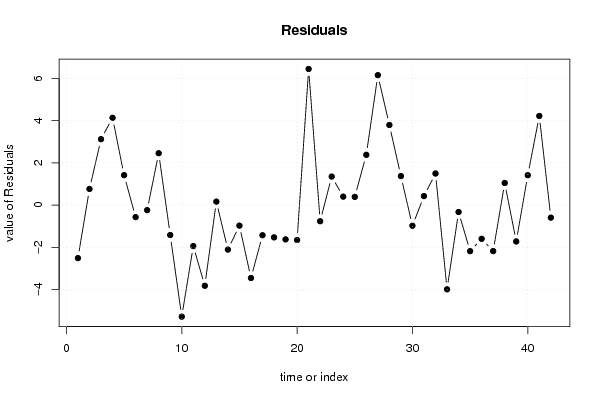
| Multiple Linear Regression - Actuals, Interpolation, and Residuals | |||
| Time or Index | Actuals | Interpolation Forecast | Residuals Prediction Error |
| 1 | 6.3 | 8.81259827810611 | -2.51259827810611 |
| 2 | 2.1 | 1.33677884954285 | 0.763221150457153 |
| 3 | 9.1 | 5.97809875312846 | 3.12190124687154 |
| 4 | 15.8 | 11.6656799799287 | 4.13432002007128 |
| 5 | 5.2 | 3.78365126797027 | 1.41634873202973 |
| 6 | 10.9 | 11.4711426732218 | -0.571142673221754 |
| 7 | 8.3 | 8.54207402576392 | -0.242074025763916 |
| 8 | 11 | 8.5454068332525 | 2.45459316674749 |
| 9 | 3.2 | 4.6196019961882 | -1.4196019961882 |
| 10 | 6.3 | 11.5863673300192 | -5.28636733001916 |
| 11 | 8.6 | 10.5437300081865 | -1.94373000818653 |
| 12 | 6.6 | 10.4228808894292 | -3.82288088942923 |
| 13 | 9.5 | 9.33709620393844 | 0.162903796061559 |
| 14 | 3.3 | 5.40863878710834 | -2.10863878710834 |
| 15 | 11 | 11.9756352923667 | -0.975635292366696 |
| 16 | 4.7 | 8.1554672017685 | -3.45546720176851 |
| 17 | 10.4 | 11.8304533111139 | -1.43045331111393 |
| 18 | 7.4 | 8.93086238025928 | -1.53086238025928 |
| 19 | 2.1 | 3.72788172673247 | -1.62788172673247 |
| 20 | 7.7 | 9.35771443922992 | -1.65771443922992 |
| 21 | 17.9 | 11.4527390656055 | 6.44726093439453 |
| 22 | 6.1 | 6.86634882316743 | -0.766348823167428 |
| 23 | 11.9 | 10.5511624266344 | 1.34883757336558 |
| 24 | 10.8 | 10.4009114686238 | 0.399088531376247 |
| 25 | 13.8 | 13.4122991877162 | 0.387700812283833 |
| 26 | 14.3 | 11.9198896598944 | 2.38011034010558 |
| 27 | 15.2 | 9.04647614075257 | 6.15352385924743 |
| 28 | 10 | 6.20579821018418 | 3.79420178981582 |
| 29 | 11.9 | 10.5278512950316 | 1.37214870496842 |
| 30 | 6.5 | 7.47929857468038 | -0.979298574680377 |
| 31 | 7.5 | 7.07536652213968 | 0.424633477860317 |
| 32 | 10.6 | 9.10592506462683 | 1.49407493537317 |
| 33 | 7.4 | 11.3910852533132 | -3.99108525331317 |
| 34 | 8.4 | 8.7290145446377 | -0.329014544637693 |
| 35 | 5.7 | 7.88409676656642 | -2.18409676656642 |
| 36 | 4.9 | 6.49917496808762 | -1.59917496808762 |
| 37 | 3.2 | 5.38235119547753 | -2.18235119547753 |
| 38 | 11 | 9.95331358924676 | 1.04668641075324 |
| 39 | 4.9 | 6.62400776022691 | -1.72400776022691 |
| 40 | 13.2 | 11.7858337292948 | 1.41416627070516 |
| 41 | 9.7 | 5.4791387167939 | 4.2208612832061 |
| 42 | 12.8 | 13.3961568100430 | -0.596156810042984 |
| Goldfeld-Quandt test for Heteroskedasticity | |||
| p-values | Alternative Hypothesis | ||
| breakpoint index | greater | 2-sided | less |
| 11 | 0.924119303665596 | 0.151761392668808 | 0.075880696334404 |
| 12 | 0.915295342418858 | 0.169409315162283 | 0.0847046575811417 |
| 13 | 0.856081289276153 | 0.287837421447694 | 0.143918710723847 |
| 14 | 0.81811061380804 | 0.363778772383921 | 0.181889386191960 |
| 15 | 0.738423658065606 | 0.523152683868788 | 0.261576341934394 |
| 16 | 0.844454435801692 | 0.311091128396616 | 0.155545564198308 |
| 17 | 0.845984850004117 | 0.308030299991765 | 0.154015149995882 |
| 18 | 0.806056024412164 | 0.387887951175671 | 0.193943975587836 |
| 19 | 0.782421215062412 | 0.435157569875176 | 0.217578784937588 |
| 20 | 0.732550909058076 | 0.534898181883849 | 0.267449090941924 |
| 21 | 0.880217548748907 | 0.239564902502186 | 0.119782451251093 |
| 22 | 0.832582911879114 | 0.334834176241773 | 0.167417088120886 |
| 23 | 0.766617371328701 | 0.466765257342597 | 0.233382628671299 |
| 24 | 0.67549810878963 | 0.649003782420741 | 0.324501891210371 |
| 25 | 0.56751389497413 | 0.86497221005174 | 0.43248610502587 |
| 26 | 0.469355066815525 | 0.93871013363105 | 0.530644933184475 |
| 27 | 0.848150563054493 | 0.303698873891014 | 0.151849436945507 |
| 28 | 0.924880474243729 | 0.150239051512542 | 0.0751195257562708 |
| 29 | 0.852477923786558 | 0.295044152426885 | 0.147522076213442 |
| 30 | 0.750441243141576 | 0.499117513716849 | 0.249558756858424 |
| 31 | 0.916301819386176 | 0.167396361227647 | 0.0836981806138235 |
| Meta Analysis of Goldfeld-Quandt test for Heteroskedasticity | |||
| Description | # significant tests | % significant tests | OK/NOK |
| 1% type I error level | 0 | 0 | OK |
| 5% type I error level | 0 | 0 | OK |
| 10% type I error level | 0 | 0 | OK |