Free Statistics

of Irreproducible Research!

Author's title

Author*The author of this computation has been verified*
R Software Modulerwasp_arimabackwardselection.wasp
Title produced by softwareARIMA Backward Selection
Date of computationMon, 13 Dec 2010 20:34:12 +0000
Cite this page as followsStatistical Computations at FreeStatistics.org, Office for Research Development and Education, URL https://freestatistics.org/blog/index.php?v=date/2010/Dec/13/t1292272454ffjohkjb9l1tcvy.htm/, Retrieved Tue, 07 May 2024 00:41:27 +0000
Statistical Computations at FreeStatistics.org, Office for Research Development and Education, URL https://freestatistics.org/blog/index.php?pk=109176, Retrieved Tue, 07 May 2024 00:41:27 +0000
QR Codes:

Original text written by user:
IsPrivate?No (this computation is public)
User-defined keywords
Estimated Impact154
Family? (F = Feedback message, R = changed R code, M = changed R Module, P = changed Parameters, D = changed Data)
-     [(Partial) Autocorrelation Function] [] [2010-12-13 08:35:23] [21eff0c210342db4afbdafe426a7c254]
-   PD  [(Partial) Autocorrelation Function] [] [2010-12-13 09:29:04] [21eff0c210342db4afbdafe426a7c254]
-    D    [(Partial) Autocorrelation Function] [] [2010-12-13 10:05:17] [21eff0c210342db4afbdafe426a7c254]
- RM D      [ARIMA Backward Selection] [] [2010-12-13 10:38:31] [21eff0c210342db4afbdafe426a7c254]
-   P           [ARIMA Backward Selection] [] [2010-12-13 20:34:12] [81d69fb83507cea26168920232cdff1b] [Current]
Feedback Forum

Post a new message
Dataseries X:
113
95.4
86.2
111.7
97.5
99.7
111.5
91.8
86.3
88.7
95.1
105.1
104.5
89.1
82.6
102.7
91.8
94.1
103.1
93.2
91
94.3
99.4
115.7
116.8
99.8
96
115.9
109.1
117.3
109.8
112.8
110.7
100
113.3
122.4
112.5
104.2
92.5
117.2
109.3
106.1
118.8
105.3
106
102
112.9
116.5
114.8
100.5
85.4
114.6
109.9
100.7
115.5
100.7
99
102.3


Summary of computational transaction
Raw Inputview raw input (R code)
Raw Outputview raw output of R engine
Computing time11 seconds
R Server'Sir Ronald Aylmer Fisher' @ 193.190.124.24

\begin{tabular}{lllllllll}
\hline
Summary of computational transaction \tabularnewline
Raw Input & view raw input (R code)  \tabularnewline
Raw Output & view raw output of R engine  \tabularnewline
Computing time & 11 seconds \tabularnewline
R Server & 'Sir Ronald Aylmer Fisher' @ 193.190.124.24 \tabularnewline
\hline
\end{tabular}
%Source: https://freestatistics.org/blog/index.php?pk=109176&T=0

[TABLE]
[ROW][C]Summary of computational transaction[/C][/ROW]
[ROW][C]Raw Input[/C][C]view raw input (R code) [/C][/ROW]
[ROW][C]Raw Output[/C][C]view raw output of R engine [/C][/ROW]
[ROW][C]Computing time[/C][C]11 seconds[/C][/ROW]
[ROW][C]R Server[/C][C]'Sir Ronald Aylmer Fisher' @ 193.190.124.24[/C][/ROW]
[/TABLE]
Source: https://freestatistics.org/blog/index.php?pk=109176&T=0

Globally Unique Identifier (entire table): ba.freestatistics.org/blog/index.php?pk=109176&T=0

As an alternative you can also use a QR Code:  

The GUIDs for individual cells are displayed in the table below:

Summary of computational transaction
Raw Inputview raw input (R code)
Raw Outputview raw output of R engine
Computing time11 seconds
R Server'Sir Ronald Aylmer Fisher' @ 193.190.124.24


ARIMA Parameter Estimation and Backward Selection
Iterationar1ar2ar3ma1sar1sar2sma1
Estimates ( 1 )-0.10720.14640.488-0.6281-0.0364-0.3299-0.829
(p-val)(0.7315 )(0.5477 )(0.0051 )(0.0545 )(0.9598 )(0.4187 )(0.7515 )
Estimates ( 2 )-0.10840.14630.4895-0.62710-0.31-1.0012
(p-val)(0.7227 )(0.5451 )(0.0041 )(0.0503 )(NA )(0.0999 )(0.6115 )
Estimates ( 3 )00.2030.5099-0.71920-0.3236-0.9965
(p-val)(NA )(0.1771 )(5e-04 )(0 )(NA )(0.0773 )(0.3689 )
Estimates ( 4 )00.21030.5121-0.70390-0.15550
(p-val)(NA )(0.1045 )(1e-04 )(0 )(NA )(0.5006 )(NA )
Estimates ( 5 )00.21270.5254-0.7097000
(p-val)(NA )(0.0917 )(0 )(0 )(NA )(NA )(NA )
Estimates ( 6 )000.5092-0.6431000
(p-val)(NA )(NA )(2e-04 )(0 )(NA )(NA )(NA )
Estimates ( 7 )NANANANANANANA
(p-val)(NA )(NA )(NA )(NA )(NA )(NA )(NA )
Estimates ( 8 )NANANANANANANA
(p-val)(NA )(NA )(NA )(NA )(NA )(NA )(NA )
Estimates ( 9 )NANANANANANANA
(p-val)(NA )(NA )(NA )(NA )(NA )(NA )(NA )
Estimates ( 10 )NANANANANANANA
(p-val)(NA )(NA )(NA )(NA )(NA )(NA )(NA )
Estimates ( 11 )NANANANANANANA
(p-val)(NA )(NA )(NA )(NA )(NA )(NA )(NA )
Estimates ( 12 )NANANANANANANA
(p-val)(NA )(NA )(NA )(NA )(NA )(NA )(NA )
Estimates ( 13 )NANANANANANANA
(p-val)(NA )(NA )(NA )(NA )(NA )(NA )(NA )

\begin{tabular}{lllllllll}
\hline
ARIMA Parameter Estimation and Backward Selection \tabularnewline
Iteration & ar1 & ar2 & ar3 & ma1 & sar1 & sar2 & sma1 \tabularnewline
Estimates ( 1 ) & -0.1072 & 0.1464 & 0.488 & -0.6281 & -0.0364 & -0.3299 & -0.829 \tabularnewline
(p-val) & (0.7315 ) & (0.5477 ) & (0.0051 ) & (0.0545 ) & (0.9598 ) & (0.4187 ) & (0.7515 ) \tabularnewline
Estimates ( 2 ) & -0.1084 & 0.1463 & 0.4895 & -0.6271 & 0 & -0.31 & -1.0012 \tabularnewline
(p-val) & (0.7227 ) & (0.5451 ) & (0.0041 ) & (0.0503 ) & (NA ) & (0.0999 ) & (0.6115 ) \tabularnewline
Estimates ( 3 ) & 0 & 0.203 & 0.5099 & -0.7192 & 0 & -0.3236 & -0.9965 \tabularnewline
(p-val) & (NA ) & (0.1771 ) & (5e-04 ) & (0 ) & (NA ) & (0.0773 ) & (0.3689 ) \tabularnewline
Estimates ( 4 ) & 0 & 0.2103 & 0.5121 & -0.7039 & 0 & -0.1555 & 0 \tabularnewline
(p-val) & (NA ) & (0.1045 ) & (1e-04 ) & (0 ) & (NA ) & (0.5006 ) & (NA ) \tabularnewline
Estimates ( 5 ) & 0 & 0.2127 & 0.5254 & -0.7097 & 0 & 0 & 0 \tabularnewline
(p-val) & (NA ) & (0.0917 ) & (0 ) & (0 ) & (NA ) & (NA ) & (NA ) \tabularnewline
Estimates ( 6 ) & 0 & 0 & 0.5092 & -0.6431 & 0 & 0 & 0 \tabularnewline
(p-val) & (NA ) & (NA ) & (2e-04 ) & (0 ) & (NA ) & (NA ) & (NA ) \tabularnewline
Estimates ( 7 ) & NA & NA & NA & NA & NA & NA & NA \tabularnewline
(p-val) & (NA ) & (NA ) & (NA ) & (NA ) & (NA ) & (NA ) & (NA ) \tabularnewline
Estimates ( 8 ) & NA & NA & NA & NA & NA & NA & NA \tabularnewline
(p-val) & (NA ) & (NA ) & (NA ) & (NA ) & (NA ) & (NA ) & (NA ) \tabularnewline
Estimates ( 9 ) & NA & NA & NA & NA & NA & NA & NA \tabularnewline
(p-val) & (NA ) & (NA ) & (NA ) & (NA ) & (NA ) & (NA ) & (NA ) \tabularnewline
Estimates ( 10 ) & NA & NA & NA & NA & NA & NA & NA \tabularnewline
(p-val) & (NA ) & (NA ) & (NA ) & (NA ) & (NA ) & (NA ) & (NA ) \tabularnewline
Estimates ( 11 ) & NA & NA & NA & NA & NA & NA & NA \tabularnewline
(p-val) & (NA ) & (NA ) & (NA ) & (NA ) & (NA ) & (NA ) & (NA ) \tabularnewline
Estimates ( 12 ) & NA & NA & NA & NA & NA & NA & NA \tabularnewline
(p-val) & (NA ) & (NA ) & (NA ) & (NA ) & (NA ) & (NA ) & (NA ) \tabularnewline
Estimates ( 13 ) & NA & NA & NA & NA & NA & NA & NA \tabularnewline
(p-val) & (NA ) & (NA ) & (NA ) & (NA ) & (NA ) & (NA ) & (NA ) \tabularnewline
\hline
\end{tabular}
%Source: https://freestatistics.org/blog/index.php?pk=109176&T=1

[TABLE]
[ROW][C]ARIMA Parameter Estimation and Backward Selection[/C][/ROW]
[ROW][C]Iteration[/C][C]ar1[/C][C]ar2[/C][C]ar3[/C][C]ma1[/C][C]sar1[/C][C]sar2[/C][C]sma1[/C][/ROW]
[ROW][C]Estimates ( 1 )[/C][C]-0.1072[/C][C]0.1464[/C][C]0.488[/C][C]-0.6281[/C][C]-0.0364[/C][C]-0.3299[/C][C]-0.829[/C][/ROW]
[ROW][C](p-val)[/C][C](0.7315 )[/C][C](0.5477 )[/C][C](0.0051 )[/C][C](0.0545 )[/C][C](0.9598 )[/C][C](0.4187 )[/C][C](0.7515 )[/C][/ROW]
[ROW][C]Estimates ( 2 )[/C][C]-0.1084[/C][C]0.1463[/C][C]0.4895[/C][C]-0.6271[/C][C]0[/C][C]-0.31[/C][C]-1.0012[/C][/ROW]
[ROW][C](p-val)[/C][C](0.7227 )[/C][C](0.5451 )[/C][C](0.0041 )[/C][C](0.0503 )[/C][C](NA )[/C][C](0.0999 )[/C][C](0.6115 )[/C][/ROW]
[ROW][C]Estimates ( 3 )[/C][C]0[/C][C]0.203[/C][C]0.5099[/C][C]-0.7192[/C][C]0[/C][C]-0.3236[/C][C]-0.9965[/C][/ROW]
[ROW][C](p-val)[/C][C](NA )[/C][C](0.1771 )[/C][C](5e-04 )[/C][C](0 )[/C][C](NA )[/C][C](0.0773 )[/C][C](0.3689 )[/C][/ROW]
[ROW][C]Estimates ( 4 )[/C][C]0[/C][C]0.2103[/C][C]0.5121[/C][C]-0.7039[/C][C]0[/C][C]-0.1555[/C][C]0[/C][/ROW]
[ROW][C](p-val)[/C][C](NA )[/C][C](0.1045 )[/C][C](1e-04 )[/C][C](0 )[/C][C](NA )[/C][C](0.5006 )[/C][C](NA )[/C][/ROW]
[ROW][C]Estimates ( 5 )[/C][C]0[/C][C]0.2127[/C][C]0.5254[/C][C]-0.7097[/C][C]0[/C][C]0[/C][C]0[/C][/ROW]
[ROW][C](p-val)[/C][C](NA )[/C][C](0.0917 )[/C][C](0 )[/C][C](0 )[/C][C](NA )[/C][C](NA )[/C][C](NA )[/C][/ROW]
[ROW][C]Estimates ( 6 )[/C][C]0[/C][C]0[/C][C]0.5092[/C][C]-0.6431[/C][C]0[/C][C]0[/C][C]0[/C][/ROW]
[ROW][C](p-val)[/C][C](NA )[/C][C](NA )[/C][C](2e-04 )[/C][C](0 )[/C][C](NA )[/C][C](NA )[/C][C](NA )[/C][/ROW]
[ROW][C]Estimates ( 7 )[/C][C]NA[/C][C]NA[/C][C]NA[/C][C]NA[/C][C]NA[/C][C]NA[/C][C]NA[/C][/ROW]
[ROW][C](p-val)[/C][C](NA )[/C][C](NA )[/C][C](NA )[/C][C](NA )[/C][C](NA )[/C][C](NA )[/C][C](NA )[/C][/ROW]
[ROW][C]Estimates ( 8 )[/C][C]NA[/C][C]NA[/C][C]NA[/C][C]NA[/C][C]NA[/C][C]NA[/C][C]NA[/C][/ROW]
[ROW][C](p-val)[/C][C](NA )[/C][C](NA )[/C][C](NA )[/C][C](NA )[/C][C](NA )[/C][C](NA )[/C][C](NA )[/C][/ROW]
[ROW][C]Estimates ( 9 )[/C][C]NA[/C][C]NA[/C][C]NA[/C][C]NA[/C][C]NA[/C][C]NA[/C][C]NA[/C][/ROW]
[ROW][C](p-val)[/C][C](NA )[/C][C](NA )[/C][C](NA )[/C][C](NA )[/C][C](NA )[/C][C](NA )[/C][C](NA )[/C][/ROW]
[ROW][C]Estimates ( 10 )[/C][C]NA[/C][C]NA[/C][C]NA[/C][C]NA[/C][C]NA[/C][C]NA[/C][C]NA[/C][/ROW]
[ROW][C](p-val)[/C][C](NA )[/C][C](NA )[/C][C](NA )[/C][C](NA )[/C][C](NA )[/C][C](NA )[/C][C](NA )[/C][/ROW]
[ROW][C]Estimates ( 11 )[/C][C]NA[/C][C]NA[/C][C]NA[/C][C]NA[/C][C]NA[/C][C]NA[/C][C]NA[/C][/ROW]
[ROW][C](p-val)[/C][C](NA )[/C][C](NA )[/C][C](NA )[/C][C](NA )[/C][C](NA )[/C][C](NA )[/C][C](NA )[/C][/ROW]
[ROW][C]Estimates ( 12 )[/C][C]NA[/C][C]NA[/C][C]NA[/C][C]NA[/C][C]NA[/C][C]NA[/C][C]NA[/C][/ROW]
[ROW][C](p-val)[/C][C](NA )[/C][C](NA )[/C][C](NA )[/C][C](NA )[/C][C](NA )[/C][C](NA )[/C][C](NA )[/C][/ROW]
[ROW][C]Estimates ( 13 )[/C][C]NA[/C][C]NA[/C][C]NA[/C][C]NA[/C][C]NA[/C][C]NA[/C][C]NA[/C][/ROW]
[ROW][C](p-val)[/C][C](NA )[/C][C](NA )[/C][C](NA )[/C][C](NA )[/C][C](NA )[/C][C](NA )[/C][C](NA )[/C][/ROW]
[/TABLE]
Source: https://freestatistics.org/blog/index.php?pk=109176&T=1

Globally Unique Identifier (entire table): ba.freestatistics.org/blog/index.php?pk=109176&T=1

As an alternative you can also use a QR Code:  

The GUIDs for individual cells are displayed in the table below:

ARIMA Parameter Estimation and Backward Selection
Iterationar1ar2ar3ma1sar1sar2sma1
Estimates ( 1 )-0.10720.14640.488-0.6281-0.0364-0.3299-0.829
(p-val)(0.7315 )(0.5477 )(0.0051 )(0.0545 )(0.9598 )(0.4187 )(0.7515 )
Estimates ( 2 )-0.10840.14630.4895-0.62710-0.31-1.0012
(p-val)(0.7227 )(0.5451 )(0.0041 )(0.0503 )(NA )(0.0999 )(0.6115 )
Estimates ( 3 )00.2030.5099-0.71920-0.3236-0.9965
(p-val)(NA )(0.1771 )(5e-04 )(0 )(NA )(0.0773 )(0.3689 )
Estimates ( 4 )00.21030.5121-0.70390-0.15550
(p-val)(NA )(0.1045 )(1e-04 )(0 )(NA )(0.5006 )(NA )
Estimates ( 5 )00.21270.5254-0.7097000
(p-val)(NA )(0.0917 )(0 )(0 )(NA )(NA )(NA )
Estimates ( 6 )000.5092-0.6431000
(p-val)(NA )(NA )(2e-04 )(0 )(NA )(NA )(NA )
Estimates ( 7 )NANANANANANANA
(p-val)(NA )(NA )(NA )(NA )(NA )(NA )(NA )
Estimates ( 8 )NANANANANANANA
(p-val)(NA )(NA )(NA )(NA )(NA )(NA )(NA )
Estimates ( 9 )NANANANANANANA
(p-val)(NA )(NA )(NA )(NA )(NA )(NA )(NA )
Estimates ( 10 )NANANANANANANA
(p-val)(NA )(NA )(NA )(NA )(NA )(NA )(NA )
Estimates ( 11 )NANANANANANANA
(p-val)(NA )(NA )(NA )(NA )(NA )(NA )(NA )
Estimates ( 12 )NANANANANANANA
(p-val)(NA )(NA )(NA )(NA )(NA )(NA )(NA )
Estimates ( 13 )NANANANANANANA
(p-val)(NA )(NA )(NA )(NA )(NA )(NA )(NA )


Estimated ARIMA Residuals
Value
-42.2891101550361
498.577728358688
768.642510207061
-576.251410628844
-12.7885549415054
-25.0577856579802
-219.825430724223
1456.29076238206
1757.42872564041
1374.06791377581
-419.123765171822
864.153280357195
934.075710451965
-258.720915690716
-682.951771595782
-43.8398944212243
847.98295867199
1730.61486034217
-2633.87494992926
127.945022362916
15.6078380627920
-1582.89450243840
-632.636987468136
-1167.11832436315
-2297.09360766388
-428.69982639139
-597.520758605484
1494.27499881603
142.779440277396
-1830.9685034316
2809.30006300802
-1021.65362604389
260.03745949591
-3.02832106878068
1312.40310978882
-1014.36112193205
570.17876127987
-335.214344688118
-461.54104321829
-410.112249810274
1223.24449467236
-254.812463814422
-340.416339083675
-536.303312440004
-285.292290630241
1150.41343973000

\begin{tabular}{lllllllll}
\hline
Estimated ARIMA Residuals \tabularnewline
Value \tabularnewline
-42.2891101550361 \tabularnewline
498.577728358688 \tabularnewline
768.642510207061 \tabularnewline
-576.251410628844 \tabularnewline
-12.7885549415054 \tabularnewline
-25.0577856579802 \tabularnewline
-219.825430724223 \tabularnewline
1456.29076238206 \tabularnewline
1757.42872564041 \tabularnewline
1374.06791377581 \tabularnewline
-419.123765171822 \tabularnewline
864.153280357195 \tabularnewline
934.075710451965 \tabularnewline
-258.720915690716 \tabularnewline
-682.951771595782 \tabularnewline
-43.8398944212243 \tabularnewline
847.98295867199 \tabularnewline
1730.61486034217 \tabularnewline
-2633.87494992926 \tabularnewline
127.945022362916 \tabularnewline
15.6078380627920 \tabularnewline
-1582.89450243840 \tabularnewline
-632.636987468136 \tabularnewline
-1167.11832436315 \tabularnewline
-2297.09360766388 \tabularnewline
-428.69982639139 \tabularnewline
-597.520758605484 \tabularnewline
1494.27499881603 \tabularnewline
142.779440277396 \tabularnewline
-1830.9685034316 \tabularnewline
2809.30006300802 \tabularnewline
-1021.65362604389 \tabularnewline
260.03745949591 \tabularnewline
-3.02832106878068 \tabularnewline
1312.40310978882 \tabularnewline
-1014.36112193205 \tabularnewline
570.17876127987 \tabularnewline
-335.214344688118 \tabularnewline
-461.54104321829 \tabularnewline
-410.112249810274 \tabularnewline
1223.24449467236 \tabularnewline
-254.812463814422 \tabularnewline
-340.416339083675 \tabularnewline
-536.303312440004 \tabularnewline
-285.292290630241 \tabularnewline
1150.41343973000 \tabularnewline
\hline
\end{tabular}
%Source: https://freestatistics.org/blog/index.php?pk=109176&T=2

[TABLE]
[ROW][C]Estimated ARIMA Residuals[/C][/ROW]
[ROW][C]Value[/C][/ROW]
[ROW][C]-42.2891101550361[/C][/ROW]
[ROW][C]498.577728358688[/C][/ROW]
[ROW][C]768.642510207061[/C][/ROW]
[ROW][C]-576.251410628844[/C][/ROW]
[ROW][C]-12.7885549415054[/C][/ROW]
[ROW][C]-25.0577856579802[/C][/ROW]
[ROW][C]-219.825430724223[/C][/ROW]
[ROW][C]1456.29076238206[/C][/ROW]
[ROW][C]1757.42872564041[/C][/ROW]
[ROW][C]1374.06791377581[/C][/ROW]
[ROW][C]-419.123765171822[/C][/ROW]
[ROW][C]864.153280357195[/C][/ROW]
[ROW][C]934.075710451965[/C][/ROW]
[ROW][C]-258.720915690716[/C][/ROW]
[ROW][C]-682.951771595782[/C][/ROW]
[ROW][C]-43.8398944212243[/C][/ROW]
[ROW][C]847.98295867199[/C][/ROW]
[ROW][C]1730.61486034217[/C][/ROW]
[ROW][C]-2633.87494992926[/C][/ROW]
[ROW][C]127.945022362916[/C][/ROW]
[ROW][C]15.6078380627920[/C][/ROW]
[ROW][C]-1582.89450243840[/C][/ROW]
[ROW][C]-632.636987468136[/C][/ROW]
[ROW][C]-1167.11832436315[/C][/ROW]
[ROW][C]-2297.09360766388[/C][/ROW]
[ROW][C]-428.69982639139[/C][/ROW]
[ROW][C]-597.520758605484[/C][/ROW]
[ROW][C]1494.27499881603[/C][/ROW]
[ROW][C]142.779440277396[/C][/ROW]
[ROW][C]-1830.9685034316[/C][/ROW]
[ROW][C]2809.30006300802[/C][/ROW]
[ROW][C]-1021.65362604389[/C][/ROW]
[ROW][C]260.03745949591[/C][/ROW]
[ROW][C]-3.02832106878068[/C][/ROW]
[ROW][C]1312.40310978882[/C][/ROW]
[ROW][C]-1014.36112193205[/C][/ROW]
[ROW][C]570.17876127987[/C][/ROW]
[ROW][C]-335.214344688118[/C][/ROW]
[ROW][C]-461.54104321829[/C][/ROW]
[ROW][C]-410.112249810274[/C][/ROW]
[ROW][C]1223.24449467236[/C][/ROW]
[ROW][C]-254.812463814422[/C][/ROW]
[ROW][C]-340.416339083675[/C][/ROW]
[ROW][C]-536.303312440004[/C][/ROW]
[ROW][C]-285.292290630241[/C][/ROW]
[ROW][C]1150.41343973000[/C][/ROW]
[/TABLE]
Source: https://freestatistics.org/blog/index.php?pk=109176&T=2

Globally Unique Identifier (entire table): ba.freestatistics.org/blog/index.php?pk=109176&T=2

As an alternative you can also use a QR Code:  

The GUIDs for individual cells are displayed in the table below:

Estimated ARIMA Residuals
Value
-42.2891101550361
498.577728358688
768.642510207061
-576.251410628844
-12.7885549415054
-25.0577856579802
-219.825430724223
1456.29076238206
1757.42872564041
1374.06791377581
-419.123765171822
864.153280357195
934.075710451965
-258.720915690716
-682.951771595782
-43.8398944212243
847.98295867199
1730.61486034217
-2633.87494992926
127.945022362916
15.6078380627920
-1582.89450243840
-632.636987468136
-1167.11832436315
-2297.09360766388
-428.69982639139
-597.520758605484
1494.27499881603
142.779440277396
-1830.9685034316
2809.30006300802
-1021.65362604389
260.03745949591
-3.02832106878068
1312.40310978882
-1014.36112193205
570.17876127987
-335.214344688118
-461.54104321829
-410.112249810274
1223.24449467236
-254.812463814422
-340.416339083675
-536.303312440004
-285.292290630241
1150.41343973000


Parameters (Session):
par1 = FALSE ; par2 = 2.0 ; par3 = 1 ; par4 = 1 ; par5 = 12 ; par6 = 3 ; par7 = 1 ; par8 = 2 ; par9 = 1 ;
Parameters (R input):
par1 = FALSE ; par2 = 2.0 ; par3 = 1 ; par4 = 1 ; par5 = 12 ; par6 = 3 ; par7 = 1 ; par8 = 2 ; par9 = 1 ;
R code (references can be found in the software module):
library(lattice)
if (par1 == 'TRUE') par1 <- TRUE
if (par1 == 'FALSE') par1 <- FALSE
par2 <- as.numeric(par2) #Box-Cox lambda transformation parameter
par3 <- as.numeric(par3) #degree of non-seasonal differencing
par4 <- as.numeric(par4) #degree of seasonal differencing
par5 <- as.numeric(par5) #seasonal period
par6 <- as.numeric(par6) #degree (p) of the non-seasonal AR(p) polynomial
par7 <- as.numeric(par7) #degree (q) of the non-seasonal MA(q) polynomial
par8 <- as.numeric(par8) #degree (P) of the seasonal AR(P) polynomial
par9 <- as.numeric(par9) #degree (Q) of the seasonal MA(Q) polynomial
armaGR <- function(arima.out, names, n){
try1 <- arima.out$coef
try2 <- sqrt(diag(arima.out$var.coef))
try.data.frame <- data.frame(matrix(NA,ncol=4,nrow=length(names)))
dimnames(try.data.frame) <- list(names,c('coef','std','tstat','pv'))
try.data.frame[,1] <- try1
for(i in 1:length(try2)) try.data.frame[which(rownames(try.data.frame)==names(try2)[i]),2] <- try2[i]
try.data.frame[,3] <- try.data.frame[,1] / try.data.frame[,2]
try.data.frame[,4] <- round((1-pt(abs(try.data.frame[,3]),df=n-(length(try2)+1)))*2,5)
vector <- rep(NA,length(names))
vector[is.na(try.data.frame[,4])] <- 0
maxi <- which.max(try.data.frame[,4])
continue <- max(try.data.frame[,4],na.rm=TRUE) > .05
vector[maxi] <- 0
list(summary=try.data.frame,next.vector=vector,continue=continue)
}
arimaSelect <- function(series, order=c(13,0,0), seasonal=list(order=c(2,0,0),period=12), include.mean=F){
nrc <- order[1]+order[3]+seasonal$order[1]+seasonal$order[3]
coeff <- matrix(NA, nrow=nrc*2, ncol=nrc)
pval <- matrix(NA, nrow=nrc*2, ncol=nrc)
mylist <- rep(list(NULL), nrc)
names <- NULL
if(order[1] > 0) names <- paste('ar',1:order[1],sep='')
if(order[3] > 0) names <- c( names , paste('ma',1:order[3],sep='') )
if(seasonal$order[1] > 0) names <- c(names, paste('sar',1:seasonal$order[1],sep=''))
if(seasonal$order[3] > 0) names <- c(names, paste('sma',1:seasonal$order[3],sep=''))
arima.out <- arima(series, order=order, seasonal=seasonal, include.mean=include.mean, method='ML')
mylist[[1]] <- arima.out
last.arma <- armaGR(arima.out, names, length(series))
mystop <- FALSE
i <- 1
coeff[i,] <- last.arma[[1]][,1]
pval [i,] <- last.arma[[1]][,4]
i <- 2
aic <- arima.out$aic
while(!mystop){
mylist[[i]] <- arima.out
arima.out <- arima(series, order=order, seasonal=seasonal, include.mean=include.mean, method='ML', fixed=last.arma$next.vector)
aic <- c(aic, arima.out$aic)
last.arma <- armaGR(arima.out, names, length(series))
mystop <- !last.arma$continue
coeff[i,] <- last.arma[[1]][,1]
pval [i,] <- last.arma[[1]][,4]
i <- i+1
}
list(coeff, pval, mylist, aic=aic)
}
arimaSelectplot <- function(arimaSelect.out,noms,choix){
noms <- names(arimaSelect.out[[3]][[1]]$coef)
coeff <- arimaSelect.out[[1]]
k <- min(which(is.na(coeff[,1])))-1
coeff <- coeff[1:k,]
pval <- arimaSelect.out[[2]][1:k,]
aic <- arimaSelect.out$aic[1:k]
coeff[coeff==0] <- NA
n <- ncol(coeff)
if(missing(choix)) choix <- k
layout(matrix(c(1,1,1,2,
3,3,3,2,
3,3,3,4,
5,6,7,7),nr=4),
widths=c(10,35,45,15),
heights=c(30,30,15,15))
couleurs <- rainbow(75)[1:50]#(50)
ticks <- pretty(coeff)
par(mar=c(1,1,3,1))
plot(aic,k:1-.5,type='o',pch=21,bg='blue',cex=2,axes=F,lty=2,xpd=NA)
points(aic[choix],k-choix+.5,pch=21,cex=4,bg=2,xpd=NA)
title('aic',line=2)
par(mar=c(3,0,0,0))
plot(0,axes=F,xlab='',ylab='',xlim=range(ticks),ylim=c(.1,1))
rect(xleft = min(ticks) + (0:49)/50*(max(ticks)-min(ticks)),
xright = min(ticks) + (1:50)/50*(max(ticks)-min(ticks)),
ytop = rep(1,50),
ybottom= rep(0,50),col=couleurs,border=NA)
axis(1,ticks)
rect(xleft=min(ticks),xright=max(ticks),ytop=1,ybottom=0)
text(mean(coeff,na.rm=T),.5,'coefficients',cex=2,font=2)
par(mar=c(1,1,3,1))
image(1:n,1:k,t(coeff[k:1,]),axes=F,col=couleurs,zlim=range(ticks))
for(i in 1:n) for(j in 1:k) if(!is.na(coeff[j,i])) {
if(pval[j,i]<.01) symb = 'green'
else if( (pval[j,i]<.05) & (pval[j,i]>=.01)) symb = 'orange'
else if( (pval[j,i]<.1) & (pval[j,i]>=.05)) symb = 'red'
else symb = 'black'
polygon(c(i+.5 ,i+.2 ,i+.5 ,i+.5),
c(k-j+0.5,k-j+0.5,k-j+0.8,k-j+0.5),
col=symb)
if(j==choix) {
rect(xleft=i-.5,
xright=i+.5,
ybottom=k-j+1.5,
ytop=k-j+.5,
lwd=4)
text(i,
k-j+1,
round(coeff[j,i],2),
cex=1.2,
font=2)
}
else{
rect(xleft=i-.5,xright=i+.5,ybottom=k-j+1.5,ytop=k-j+.5)
text(i,k-j+1,round(coeff[j,i],2),cex=1.2,font=1)
}
}
axis(3,1:n,noms)
par(mar=c(0.5,0,0,0.5))
plot(0,axes=F,xlab='',ylab='',type='n',xlim=c(0,8),ylim=c(-.2,.8))
cols <- c('green','orange','red','black')
niv <- c('0','0.01','0.05','0.1')
for(i in 0:3){
polygon(c(1+2*i ,1+2*i ,1+2*i-.5 ,1+2*i),
c(.4 ,.7 , .4 , .4),
col=cols[i+1])
text(2*i,0.5,niv[i+1],cex=1.5)
}
text(8,.5,1,cex=1.5)
text(4,0,'p-value',cex=2)
box()
residus <- arimaSelect.out[[3]][[choix]]$res
par(mar=c(1,2,4,1))
acf(residus,main='')
title('acf',line=.5)
par(mar=c(1,2,4,1))
pacf(residus,main='')
title('pacf',line=.5)
par(mar=c(2,2,4,1))
qqnorm(residus,main='')
title('qq-norm',line=.5)
qqline(residus)
residus
}
if (par2 == 0) x <- log(x)
if (par2 != 0) x <- x^par2
(selection <- arimaSelect(x, order=c(par6,par3,par7), seasonal=list(order=c(par8,par4,par9), period=par5)))
bitmap(file='test1.png')
resid <- arimaSelectplot(selection)
dev.off()
resid
bitmap(file='test2.png')
acf(resid,length(resid)/2, main='Residual Autocorrelation Function')
dev.off()
bitmap(file='test3.png')
pacf(resid,length(resid)/2, main='Residual Partial Autocorrelation Function')
dev.off()
bitmap(file='test4.png')
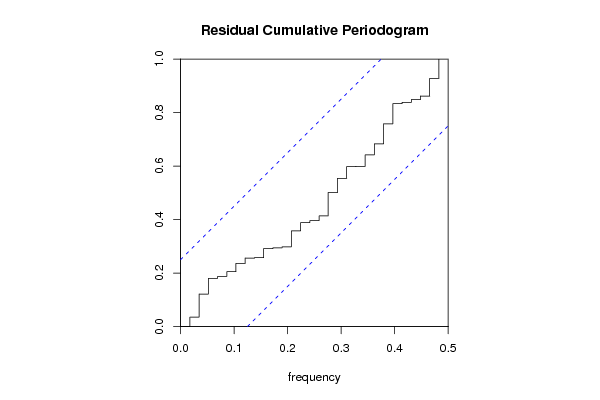
cpgram(resid, main='Residual Cumulative Periodogram')
dev.off()
bitmap(file='test5.png')
hist(resid, main='Residual Histogram', xlab='values of Residuals')
dev.off()
bitmap(file='test6.png')
densityplot(~resid,col='black',main='Residual Density Plot', xlab='values of Residuals')
dev.off()
bitmap(file='test7.png')
qqnorm(resid, main='Residual Normal Q-Q Plot')
qqline(resid)
dev.off()
ncols <- length(selection[[1]][1,])
nrows <- length(selection[[2]][,1])-1
load(file='createtable')
a<-table.start()
a<-table.row.start(a)
a<-table.element(a,'ARIMA Parameter Estimation and Backward Selection', ncols+1,TRUE)
a<-table.row.end(a)
a<-table.row.start(a)
a<-table.element(a,'Iteration', header=TRUE)
for (i in 1:ncols) {
a<-table.element(a,names(selection[[3]][[1]]$coef)[i],header=TRUE)
}
a<-table.row.end(a)
for (j in 1:nrows) {
a<-table.row.start(a)
mydum <- 'Estimates ('
mydum <- paste(mydum,j)
mydum <- paste(mydum,')')
a<-table.element(a,mydum, header=TRUE)
for (i in 1:ncols) {
a<-table.element(a,round(selection[[1]][j,i],4))
}
a<-table.row.end(a)
a<-table.row.start(a)
a<-table.element(a,'(p-val)', header=TRUE)
for (i in 1:ncols) {
mydum <- '('
mydum <- paste(mydum,round(selection[[2]][j,i],4),sep='')
mydum <- paste(mydum,')')
a<-table.element(a,mydum)
}
a<-table.row.end(a)
}
a<-table.end(a)
table.save(a,file='mytable.tab')
a<-table.start()
a<-table.row.start(a)
a<-table.element(a,'Estimated ARIMA Residuals', 1,TRUE)
a<-table.row.end(a)
a<-table.row.start(a)
a<-table.element(a,'Value', 1,TRUE)
a<-table.row.end(a)
for (i in (par4*par5+par3):length(resid)) {
a<-table.row.start(a)
a<-table.element(a,resid[i])
a<-table.row.end(a)
}
a<-table.end(a)
table.save(a,file='mytable1.tab')