Free Statistics

of Irreproducible Research!

Author's title

Author*The author of this computation has been verified*
R Software Modulerwasp_autocorrelation.wasp
Title produced by software(Partial) Autocorrelation Function
Date of computationMon, 13 Dec 2010 20:04:16 +0000
Cite this page as followsStatistical Computations at FreeStatistics.org, Office for Research Development and Education, URL https://freestatistics.org/blog/index.php?v=date/2010/Dec/13/t1292270548y0s5m82idse32l5.htm/, Retrieved Tue, 07 May 2024 04:35:31 +0000
Statistical Computations at FreeStatistics.org, Office for Research Development and Education, URL https://freestatistics.org/blog/index.php?pk=109140, Retrieved Tue, 07 May 2024 04:35:31 +0000
QR Codes:

Original text written by user:
IsPrivate?No (this computation is public)
User-defined keywords
Estimated Impact140
Family? (F = Feedback message, R = changed R code, M = changed R Module, P = changed Parameters, D = changed Data)
-     [(Partial) Autocorrelation Function] [] [2010-12-13 08:35:23] [21eff0c210342db4afbdafe426a7c254]
-   PD  [(Partial) Autocorrelation Function] [] [2010-12-13 09:29:04] [21eff0c210342db4afbdafe426a7c254]
-    D    [(Partial) Autocorrelation Function] [] [2010-12-13 09:39:12] [21eff0c210342db4afbdafe426a7c254]
-   PD        [(Partial) Autocorrelation Function] [] [2010-12-13 20:04:16] [81d69fb83507cea26168920232cdff1b] [Current]
Feedback Forum

Post a new message
Dataseries X:
113
95,4
86,2
111,7
97,5
99,7
111,5
91,8
86,3
88,7
95,1
105,1
104,5
89,1
82,6
102,7
91,8
94,1
103,1
93,2
91
94,3
99,4
115,7
116,8
99,8
96
115,9
109,1
117,3
109,8
112,8
110,7
100
113,3
122,4
112,5
104,2
92,5
117,2
109,3
106,1
118,8
105,3
106
102
112,9
116,5
114,8
100,5
85,4
114,6
109,9
100,7
115,5
100,7
99
102,3


Summary of computational transaction
Raw Inputview raw input (R code)
Raw Outputview raw output of R engine
Computing time2 seconds
R Server'Sir Ronald Aylmer Fisher' @ 193.190.124.24

\begin{tabular}{lllllllll}
\hline
Summary of computational transaction \tabularnewline
Raw Input & view raw input (R code)  \tabularnewline
Raw Output & view raw output of R engine  \tabularnewline
Computing time & 2 seconds \tabularnewline
R Server & 'Sir Ronald Aylmer Fisher' @ 193.190.124.24 \tabularnewline
\hline
\end{tabular}
%Source: https://freestatistics.org/blog/index.php?pk=109140&T=0

[TABLE]
[ROW][C]Summary of computational transaction[/C][/ROW]
[ROW][C]Raw Input[/C][C]view raw input (R code) [/C][/ROW]
[ROW][C]Raw Output[/C][C]view raw output of R engine [/C][/ROW]
[ROW][C]Computing time[/C][C]2 seconds[/C][/ROW]
[ROW][C]R Server[/C][C]'Sir Ronald Aylmer Fisher' @ 193.190.124.24[/C][/ROW]
[/TABLE]
Source: https://freestatistics.org/blog/index.php?pk=109140&T=0

Globally Unique Identifier (entire table): ba.freestatistics.org/blog/index.php?pk=109140&T=0

As an alternative you can also use a QR Code:  

The GUIDs for individual cells are displayed in the table below:

Summary of computational transaction
Raw Inputview raw input (R code)
Raw Outputview raw output of R engine
Computing time2 seconds
R Server'Sir Ronald Aylmer Fisher' @ 193.190.124.24


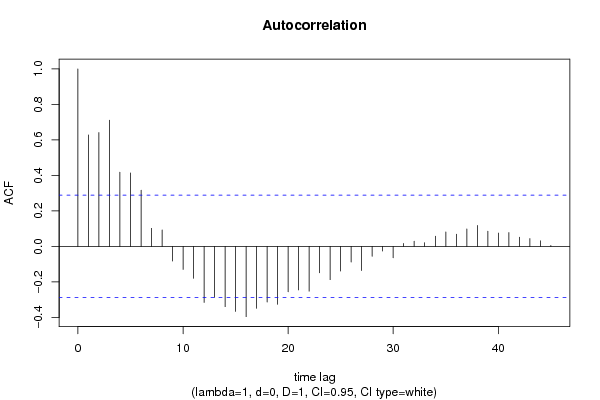
Autocorrelation Function
Time lag kACF(k)T-STATP-value
10.6282344.26095e-05
20.6414344.35043.7e-05
30.7108224.8218e-06
40.417932.83450.003398
50.4136042.80520.003672
60.3166232.14740.018531
70.1017310.690.246839
80.0926510.62840.266428
9-0.082631-0.56040.288954
10-0.129665-0.87940.19187
11-0.179913-1.22020.114299
12-0.315777-2.14170.018773
13-0.287235-1.94810.028759
14-0.339563-2.3030.012925
15-0.366238-2.48390.008349
16-0.395919-2.68530.005023
17-0.348801-2.36570.011134
18-0.313667-2.12740.01939
19-0.325759-2.20940.016082
20-0.25548-1.73280.04492
21-0.245243-1.66330.051524
22-0.252368-1.71160.046849
23-0.148327-1.0060.159839
24-0.187262-1.27010.105223
25-0.139025-0.94290.175325
26-0.087755-0.59520.277318
27-0.136391-0.92510.179883
28-0.055972-0.37960.352987
29-0.025869-0.17550.430748
30-0.064217-0.43550.332604
310.0164890.11180.45572
320.0288960.1960.422743
330.0205440.13930.444896
340.0578050.39210.348415
350.0815290.5530.291484
360.0690810.46850.32081
370.0985340.66830.253644
380.1174620.79670.21487
390.0851140.57730.283286
400.0748230.50750.307123
410.0778210.52780.300086
420.0515320.34950.364153
430.0441250.29930.38304
440.0312170.21170.416628
450.0050750.03440.486345
46NANANA
47NANANA
48NANANA

\begin{tabular}{lllllllll}
\hline
Autocorrelation Function \tabularnewline
Time lag k & ACF(k) & T-STAT & P-value \tabularnewline
1 & 0.628234 & 4.2609 & 5e-05 \tabularnewline
2 & 0.641434 & 4.3504 & 3.7e-05 \tabularnewline
3 & 0.710822 & 4.821 & 8e-06 \tabularnewline
4 & 0.41793 & 2.8345 & 0.003398 \tabularnewline
5 & 0.413604 & 2.8052 & 0.003672 \tabularnewline
6 & 0.316623 & 2.1474 & 0.018531 \tabularnewline
7 & 0.101731 & 0.69 & 0.246839 \tabularnewline
8 & 0.092651 & 0.6284 & 0.266428 \tabularnewline
9 & -0.082631 & -0.5604 & 0.288954 \tabularnewline
10 & -0.129665 & -0.8794 & 0.19187 \tabularnewline
11 & -0.179913 & -1.2202 & 0.114299 \tabularnewline
12 & -0.315777 & -2.1417 & 0.018773 \tabularnewline
13 & -0.287235 & -1.9481 & 0.028759 \tabularnewline
14 & -0.339563 & -2.303 & 0.012925 \tabularnewline
15 & -0.366238 & -2.4839 & 0.008349 \tabularnewline
16 & -0.395919 & -2.6853 & 0.005023 \tabularnewline
17 & -0.348801 & -2.3657 & 0.011134 \tabularnewline
18 & -0.313667 & -2.1274 & 0.01939 \tabularnewline
19 & -0.325759 & -2.2094 & 0.016082 \tabularnewline
20 & -0.25548 & -1.7328 & 0.04492 \tabularnewline
21 & -0.245243 & -1.6633 & 0.051524 \tabularnewline
22 & -0.252368 & -1.7116 & 0.046849 \tabularnewline
23 & -0.148327 & -1.006 & 0.159839 \tabularnewline
24 & -0.187262 & -1.2701 & 0.105223 \tabularnewline
25 & -0.139025 & -0.9429 & 0.175325 \tabularnewline
26 & -0.087755 & -0.5952 & 0.277318 \tabularnewline
27 & -0.136391 & -0.9251 & 0.179883 \tabularnewline
28 & -0.055972 & -0.3796 & 0.352987 \tabularnewline
29 & -0.025869 & -0.1755 & 0.430748 \tabularnewline
30 & -0.064217 & -0.4355 & 0.332604 \tabularnewline
31 & 0.016489 & 0.1118 & 0.45572 \tabularnewline
32 & 0.028896 & 0.196 & 0.422743 \tabularnewline
33 & 0.020544 & 0.1393 & 0.444896 \tabularnewline
34 & 0.057805 & 0.3921 & 0.348415 \tabularnewline
35 & 0.081529 & 0.553 & 0.291484 \tabularnewline
36 & 0.069081 & 0.4685 & 0.32081 \tabularnewline
37 & 0.098534 & 0.6683 & 0.253644 \tabularnewline
38 & 0.117462 & 0.7967 & 0.21487 \tabularnewline
39 & 0.085114 & 0.5773 & 0.283286 \tabularnewline
40 & 0.074823 & 0.5075 & 0.307123 \tabularnewline
41 & 0.077821 & 0.5278 & 0.300086 \tabularnewline
42 & 0.051532 & 0.3495 & 0.364153 \tabularnewline
43 & 0.044125 & 0.2993 & 0.38304 \tabularnewline
44 & 0.031217 & 0.2117 & 0.416628 \tabularnewline
45 & 0.005075 & 0.0344 & 0.486345 \tabularnewline
46 & NA & NA & NA \tabularnewline
47 & NA & NA & NA \tabularnewline
48 & NA & NA & NA \tabularnewline
\hline
\end{tabular}
%Source: https://freestatistics.org/blog/index.php?pk=109140&T=1

[TABLE]
[ROW][C]Autocorrelation Function[/C][/ROW]
[ROW][C]Time lag k[/C][C]ACF(k)[/C][C]T-STAT[/C][C]P-value[/C][/ROW]
[ROW][C]1[/C][C]0.628234[/C][C]4.2609[/C][C]5e-05[/C][/ROW]
[ROW][C]2[/C][C]0.641434[/C][C]4.3504[/C][C]3.7e-05[/C][/ROW]
[ROW][C]3[/C][C]0.710822[/C][C]4.821[/C][C]8e-06[/C][/ROW]
[ROW][C]4[/C][C]0.41793[/C][C]2.8345[/C][C]0.003398[/C][/ROW]
[ROW][C]5[/C][C]0.413604[/C][C]2.8052[/C][C]0.003672[/C][/ROW]
[ROW][C]6[/C][C]0.316623[/C][C]2.1474[/C][C]0.018531[/C][/ROW]
[ROW][C]7[/C][C]0.101731[/C][C]0.69[/C][C]0.246839[/C][/ROW]
[ROW][C]8[/C][C]0.092651[/C][C]0.6284[/C][C]0.266428[/C][/ROW]
[ROW][C]9[/C][C]-0.082631[/C][C]-0.5604[/C][C]0.288954[/C][/ROW]
[ROW][C]10[/C][C]-0.129665[/C][C]-0.8794[/C][C]0.19187[/C][/ROW]
[ROW][C]11[/C][C]-0.179913[/C][C]-1.2202[/C][C]0.114299[/C][/ROW]
[ROW][C]12[/C][C]-0.315777[/C][C]-2.1417[/C][C]0.018773[/C][/ROW]
[ROW][C]13[/C][C]-0.287235[/C][C]-1.9481[/C][C]0.028759[/C][/ROW]
[ROW][C]14[/C][C]-0.339563[/C][C]-2.303[/C][C]0.012925[/C][/ROW]
[ROW][C]15[/C][C]-0.366238[/C][C]-2.4839[/C][C]0.008349[/C][/ROW]
[ROW][C]16[/C][C]-0.395919[/C][C]-2.6853[/C][C]0.005023[/C][/ROW]
[ROW][C]17[/C][C]-0.348801[/C][C]-2.3657[/C][C]0.011134[/C][/ROW]
[ROW][C]18[/C][C]-0.313667[/C][C]-2.1274[/C][C]0.01939[/C][/ROW]
[ROW][C]19[/C][C]-0.325759[/C][C]-2.2094[/C][C]0.016082[/C][/ROW]
[ROW][C]20[/C][C]-0.25548[/C][C]-1.7328[/C][C]0.04492[/C][/ROW]
[ROW][C]21[/C][C]-0.245243[/C][C]-1.6633[/C][C]0.051524[/C][/ROW]
[ROW][C]22[/C][C]-0.252368[/C][C]-1.7116[/C][C]0.046849[/C][/ROW]
[ROW][C]23[/C][C]-0.148327[/C][C]-1.006[/C][C]0.159839[/C][/ROW]
[ROW][C]24[/C][C]-0.187262[/C][C]-1.2701[/C][C]0.105223[/C][/ROW]
[ROW][C]25[/C][C]-0.139025[/C][C]-0.9429[/C][C]0.175325[/C][/ROW]
[ROW][C]26[/C][C]-0.087755[/C][C]-0.5952[/C][C]0.277318[/C][/ROW]
[ROW][C]27[/C][C]-0.136391[/C][C]-0.9251[/C][C]0.179883[/C][/ROW]
[ROW][C]28[/C][C]-0.055972[/C][C]-0.3796[/C][C]0.352987[/C][/ROW]
[ROW][C]29[/C][C]-0.025869[/C][C]-0.1755[/C][C]0.430748[/C][/ROW]
[ROW][C]30[/C][C]-0.064217[/C][C]-0.4355[/C][C]0.332604[/C][/ROW]
[ROW][C]31[/C][C]0.016489[/C][C]0.1118[/C][C]0.45572[/C][/ROW]
[ROW][C]32[/C][C]0.028896[/C][C]0.196[/C][C]0.422743[/C][/ROW]
[ROW][C]33[/C][C]0.020544[/C][C]0.1393[/C][C]0.444896[/C][/ROW]
[ROW][C]34[/C][C]0.057805[/C][C]0.3921[/C][C]0.348415[/C][/ROW]
[ROW][C]35[/C][C]0.081529[/C][C]0.553[/C][C]0.291484[/C][/ROW]
[ROW][C]36[/C][C]0.069081[/C][C]0.4685[/C][C]0.32081[/C][/ROW]
[ROW][C]37[/C][C]0.098534[/C][C]0.6683[/C][C]0.253644[/C][/ROW]
[ROW][C]38[/C][C]0.117462[/C][C]0.7967[/C][C]0.21487[/C][/ROW]
[ROW][C]39[/C][C]0.085114[/C][C]0.5773[/C][C]0.283286[/C][/ROW]
[ROW][C]40[/C][C]0.074823[/C][C]0.5075[/C][C]0.307123[/C][/ROW]
[ROW][C]41[/C][C]0.077821[/C][C]0.5278[/C][C]0.300086[/C][/ROW]
[ROW][C]42[/C][C]0.051532[/C][C]0.3495[/C][C]0.364153[/C][/ROW]
[ROW][C]43[/C][C]0.044125[/C][C]0.2993[/C][C]0.38304[/C][/ROW]
[ROW][C]44[/C][C]0.031217[/C][C]0.2117[/C][C]0.416628[/C][/ROW]
[ROW][C]45[/C][C]0.005075[/C][C]0.0344[/C][C]0.486345[/C][/ROW]
[ROW][C]46[/C][C]NA[/C][C]NA[/C][C]NA[/C][/ROW]
[ROW][C]47[/C][C]NA[/C][C]NA[/C][C]NA[/C][/ROW]
[ROW][C]48[/C][C]NA[/C][C]NA[/C][C]NA[/C][/ROW]
[/TABLE]
Source: https://freestatistics.org/blog/index.php?pk=109140&T=1

Globally Unique Identifier (entire table): ba.freestatistics.org/blog/index.php?pk=109140&T=1

As an alternative you can also use a QR Code:  

The GUIDs for individual cells are displayed in the table below:

Autocorrelation Function
Time lag kACF(k)T-STATP-value
10.6282344.26095e-05
20.6414344.35043.7e-05
30.7108224.8218e-06
40.417932.83450.003398
50.4136042.80520.003672
60.3166232.14740.018531
70.1017310.690.246839
80.0926510.62840.266428
9-0.082631-0.56040.288954
10-0.129665-0.87940.19187
11-0.179913-1.22020.114299
12-0.315777-2.14170.018773
13-0.287235-1.94810.028759
14-0.339563-2.3030.012925
15-0.366238-2.48390.008349
16-0.395919-2.68530.005023
17-0.348801-2.36570.011134
18-0.313667-2.12740.01939
19-0.325759-2.20940.016082
20-0.25548-1.73280.04492
21-0.245243-1.66330.051524
22-0.252368-1.71160.046849
23-0.148327-1.0060.159839
24-0.187262-1.27010.105223
25-0.139025-0.94290.175325
26-0.087755-0.59520.277318
27-0.136391-0.92510.179883
28-0.055972-0.37960.352987
29-0.025869-0.17550.430748
30-0.064217-0.43550.332604
310.0164890.11180.45572
320.0288960.1960.422743
330.0205440.13930.444896
340.0578050.39210.348415
350.0815290.5530.291484
360.0690810.46850.32081
370.0985340.66830.253644
380.1174620.79670.21487
390.0851140.57730.283286
400.0748230.50750.307123
410.0778210.52780.300086
420.0515320.34950.364153
430.0441250.29930.38304
440.0312170.21170.416628
450.0050750.03440.486345
46NANANA
47NANANA
48NANANA


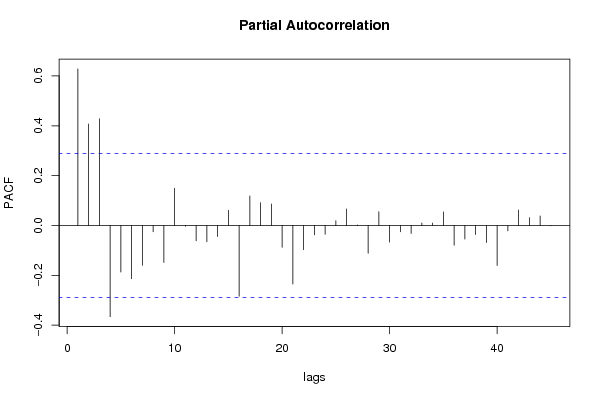
Partial Autocorrelation Function
Time lag kPACF(k)T-STATP-value
10.6282344.26095e-05
20.4076442.76480.004085
30.4279972.90280.002831
4-0.365705-2.48030.008423
5-0.186721-1.26640.105872
6-0.213543-1.44830.077155
7-0.159462-1.08150.142551
8-0.024899-0.16890.433318
9-0.148102-1.00450.160201
100.1495391.01420.157892
11-0.003064-0.02080.491755
12-0.061166-0.41480.340091
13-0.065056-0.44120.330557
14-0.044098-0.29910.383111
150.0614430.41670.339409
16-0.283845-1.92510.030205
170.1183240.80250.213193
180.0915810.62110.26879
190.0865240.58680.280092
20-0.087012-0.59010.278991
21-0.234626-1.59130.059194
22-0.09694-0.65750.257075
23-0.037214-0.25240.40093
24-0.035079-0.23790.406502
250.0193240.13110.448148
260.0666760.45220.326619
270.001970.01340.4947
28-0.111693-0.75750.226295
290.0555220.37660.354112
30-0.066075-0.44810.328078
31-0.02495-0.16920.433184
32-0.031568-0.21410.415706
330.0099510.06750.473243
340.0096760.06560.473979
350.054490.36960.356699
36-0.079343-0.53810.296541
37-0.054428-0.36910.356855
38-0.03603-0.24440.404016
39-0.068641-0.46550.321869
40-0.16016-1.08630.141513
41-0.021055-0.14280.443535
420.0619380.42010.338189
430.0313340.21250.416321
440.0382060.25910.398348
45-0.001187-0.00810.496805
46NANANA
47NANANA
48NANANA

\begin{tabular}{lllllllll}
\hline
Partial Autocorrelation Function \tabularnewline
Time lag k & PACF(k) & T-STAT & P-value \tabularnewline
1 & 0.628234 & 4.2609 & 5e-05 \tabularnewline
2 & 0.407644 & 2.7648 & 0.004085 \tabularnewline
3 & 0.427997 & 2.9028 & 0.002831 \tabularnewline
4 & -0.365705 & -2.4803 & 0.008423 \tabularnewline
5 & -0.186721 & -1.2664 & 0.105872 \tabularnewline
6 & -0.213543 & -1.4483 & 0.077155 \tabularnewline
7 & -0.159462 & -1.0815 & 0.142551 \tabularnewline
8 & -0.024899 & -0.1689 & 0.433318 \tabularnewline
9 & -0.148102 & -1.0045 & 0.160201 \tabularnewline
10 & 0.149539 & 1.0142 & 0.157892 \tabularnewline
11 & -0.003064 & -0.0208 & 0.491755 \tabularnewline
12 & -0.061166 & -0.4148 & 0.340091 \tabularnewline
13 & -0.065056 & -0.4412 & 0.330557 \tabularnewline
14 & -0.044098 & -0.2991 & 0.383111 \tabularnewline
15 & 0.061443 & 0.4167 & 0.339409 \tabularnewline
16 & -0.283845 & -1.9251 & 0.030205 \tabularnewline
17 & 0.118324 & 0.8025 & 0.213193 \tabularnewline
18 & 0.091581 & 0.6211 & 0.26879 \tabularnewline
19 & 0.086524 & 0.5868 & 0.280092 \tabularnewline
20 & -0.087012 & -0.5901 & 0.278991 \tabularnewline
21 & -0.234626 & -1.5913 & 0.059194 \tabularnewline
22 & -0.09694 & -0.6575 & 0.257075 \tabularnewline
23 & -0.037214 & -0.2524 & 0.40093 \tabularnewline
24 & -0.035079 & -0.2379 & 0.406502 \tabularnewline
25 & 0.019324 & 0.1311 & 0.448148 \tabularnewline
26 & 0.066676 & 0.4522 & 0.326619 \tabularnewline
27 & 0.00197 & 0.0134 & 0.4947 \tabularnewline
28 & -0.111693 & -0.7575 & 0.226295 \tabularnewline
29 & 0.055522 & 0.3766 & 0.354112 \tabularnewline
30 & -0.066075 & -0.4481 & 0.328078 \tabularnewline
31 & -0.02495 & -0.1692 & 0.433184 \tabularnewline
32 & -0.031568 & -0.2141 & 0.415706 \tabularnewline
33 & 0.009951 & 0.0675 & 0.473243 \tabularnewline
34 & 0.009676 & 0.0656 & 0.473979 \tabularnewline
35 & 0.05449 & 0.3696 & 0.356699 \tabularnewline
36 & -0.079343 & -0.5381 & 0.296541 \tabularnewline
37 & -0.054428 & -0.3691 & 0.356855 \tabularnewline
38 & -0.03603 & -0.2444 & 0.404016 \tabularnewline
39 & -0.068641 & -0.4655 & 0.321869 \tabularnewline
40 & -0.16016 & -1.0863 & 0.141513 \tabularnewline
41 & -0.021055 & -0.1428 & 0.443535 \tabularnewline
42 & 0.061938 & 0.4201 & 0.338189 \tabularnewline
43 & 0.031334 & 0.2125 & 0.416321 \tabularnewline
44 & 0.038206 & 0.2591 & 0.398348 \tabularnewline
45 & -0.001187 & -0.0081 & 0.496805 \tabularnewline
46 & NA & NA & NA \tabularnewline
47 & NA & NA & NA \tabularnewline
48 & NA & NA & NA \tabularnewline
\hline
\end{tabular}
%Source: https://freestatistics.org/blog/index.php?pk=109140&T=2

[TABLE]
[ROW][C]Partial Autocorrelation Function[/C][/ROW]
[ROW][C]Time lag k[/C][C]PACF(k)[/C][C]T-STAT[/C][C]P-value[/C][/ROW]
[ROW][C]1[/C][C]0.628234[/C][C]4.2609[/C][C]5e-05[/C][/ROW]
[ROW][C]2[/C][C]0.407644[/C][C]2.7648[/C][C]0.004085[/C][/ROW]
[ROW][C]3[/C][C]0.427997[/C][C]2.9028[/C][C]0.002831[/C][/ROW]
[ROW][C]4[/C][C]-0.365705[/C][C]-2.4803[/C][C]0.008423[/C][/ROW]
[ROW][C]5[/C][C]-0.186721[/C][C]-1.2664[/C][C]0.105872[/C][/ROW]
[ROW][C]6[/C][C]-0.213543[/C][C]-1.4483[/C][C]0.077155[/C][/ROW]
[ROW][C]7[/C][C]-0.159462[/C][C]-1.0815[/C][C]0.142551[/C][/ROW]
[ROW][C]8[/C][C]-0.024899[/C][C]-0.1689[/C][C]0.433318[/C][/ROW]
[ROW][C]9[/C][C]-0.148102[/C][C]-1.0045[/C][C]0.160201[/C][/ROW]
[ROW][C]10[/C][C]0.149539[/C][C]1.0142[/C][C]0.157892[/C][/ROW]
[ROW][C]11[/C][C]-0.003064[/C][C]-0.0208[/C][C]0.491755[/C][/ROW]
[ROW][C]12[/C][C]-0.061166[/C][C]-0.4148[/C][C]0.340091[/C][/ROW]
[ROW][C]13[/C][C]-0.065056[/C][C]-0.4412[/C][C]0.330557[/C][/ROW]
[ROW][C]14[/C][C]-0.044098[/C][C]-0.2991[/C][C]0.383111[/C][/ROW]
[ROW][C]15[/C][C]0.061443[/C][C]0.4167[/C][C]0.339409[/C][/ROW]
[ROW][C]16[/C][C]-0.283845[/C][C]-1.9251[/C][C]0.030205[/C][/ROW]
[ROW][C]17[/C][C]0.118324[/C][C]0.8025[/C][C]0.213193[/C][/ROW]
[ROW][C]18[/C][C]0.091581[/C][C]0.6211[/C][C]0.26879[/C][/ROW]
[ROW][C]19[/C][C]0.086524[/C][C]0.5868[/C][C]0.280092[/C][/ROW]
[ROW][C]20[/C][C]-0.087012[/C][C]-0.5901[/C][C]0.278991[/C][/ROW]
[ROW][C]21[/C][C]-0.234626[/C][C]-1.5913[/C][C]0.059194[/C][/ROW]
[ROW][C]22[/C][C]-0.09694[/C][C]-0.6575[/C][C]0.257075[/C][/ROW]
[ROW][C]23[/C][C]-0.037214[/C][C]-0.2524[/C][C]0.40093[/C][/ROW]
[ROW][C]24[/C][C]-0.035079[/C][C]-0.2379[/C][C]0.406502[/C][/ROW]
[ROW][C]25[/C][C]0.019324[/C][C]0.1311[/C][C]0.448148[/C][/ROW]
[ROW][C]26[/C][C]0.066676[/C][C]0.4522[/C][C]0.326619[/C][/ROW]
[ROW][C]27[/C][C]0.00197[/C][C]0.0134[/C][C]0.4947[/C][/ROW]
[ROW][C]28[/C][C]-0.111693[/C][C]-0.7575[/C][C]0.226295[/C][/ROW]
[ROW][C]29[/C][C]0.055522[/C][C]0.3766[/C][C]0.354112[/C][/ROW]
[ROW][C]30[/C][C]-0.066075[/C][C]-0.4481[/C][C]0.328078[/C][/ROW]
[ROW][C]31[/C][C]-0.02495[/C][C]-0.1692[/C][C]0.433184[/C][/ROW]
[ROW][C]32[/C][C]-0.031568[/C][C]-0.2141[/C][C]0.415706[/C][/ROW]
[ROW][C]33[/C][C]0.009951[/C][C]0.0675[/C][C]0.473243[/C][/ROW]
[ROW][C]34[/C][C]0.009676[/C][C]0.0656[/C][C]0.473979[/C][/ROW]
[ROW][C]35[/C][C]0.05449[/C][C]0.3696[/C][C]0.356699[/C][/ROW]
[ROW][C]36[/C][C]-0.079343[/C][C]-0.5381[/C][C]0.296541[/C][/ROW]
[ROW][C]37[/C][C]-0.054428[/C][C]-0.3691[/C][C]0.356855[/C][/ROW]
[ROW][C]38[/C][C]-0.03603[/C][C]-0.2444[/C][C]0.404016[/C][/ROW]
[ROW][C]39[/C][C]-0.068641[/C][C]-0.4655[/C][C]0.321869[/C][/ROW]
[ROW][C]40[/C][C]-0.16016[/C][C]-1.0863[/C][C]0.141513[/C][/ROW]
[ROW][C]41[/C][C]-0.021055[/C][C]-0.1428[/C][C]0.443535[/C][/ROW]
[ROW][C]42[/C][C]0.061938[/C][C]0.4201[/C][C]0.338189[/C][/ROW]
[ROW][C]43[/C][C]0.031334[/C][C]0.2125[/C][C]0.416321[/C][/ROW]
[ROW][C]44[/C][C]0.038206[/C][C]0.2591[/C][C]0.398348[/C][/ROW]
[ROW][C]45[/C][C]-0.001187[/C][C]-0.0081[/C][C]0.496805[/C][/ROW]
[ROW][C]46[/C][C]NA[/C][C]NA[/C][C]NA[/C][/ROW]
[ROW][C]47[/C][C]NA[/C][C]NA[/C][C]NA[/C][/ROW]
[ROW][C]48[/C][C]NA[/C][C]NA[/C][C]NA[/C][/ROW]
[/TABLE]
Source: https://freestatistics.org/blog/index.php?pk=109140&T=2

Globally Unique Identifier (entire table): ba.freestatistics.org/blog/index.php?pk=109140&T=2

As an alternative you can also use a QR Code:  

The GUIDs for individual cells are displayed in the table below:

Partial Autocorrelation Function
Time lag kPACF(k)T-STATP-value
10.6282344.26095e-05
20.4076442.76480.004085
30.4279972.90280.002831
4-0.365705-2.48030.008423
5-0.186721-1.26640.105872
6-0.213543-1.44830.077155
7-0.159462-1.08150.142551
8-0.024899-0.16890.433318
9-0.148102-1.00450.160201
100.1495391.01420.157892
11-0.003064-0.02080.491755
12-0.061166-0.41480.340091
13-0.065056-0.44120.330557
14-0.044098-0.29910.383111
150.0614430.41670.339409
16-0.283845-1.92510.030205
170.1183240.80250.213193
180.0915810.62110.26879
190.0865240.58680.280092
20-0.087012-0.59010.278991
21-0.234626-1.59130.059194
22-0.09694-0.65750.257075
23-0.037214-0.25240.40093
24-0.035079-0.23790.406502
250.0193240.13110.448148
260.0666760.45220.326619
270.001970.01340.4947
28-0.111693-0.75750.226295
290.0555220.37660.354112
30-0.066075-0.44810.328078
31-0.02495-0.16920.433184
32-0.031568-0.21410.415706
330.0099510.06750.473243
340.0096760.06560.473979
350.054490.36960.356699
36-0.079343-0.53810.296541
37-0.054428-0.36910.356855
38-0.03603-0.24440.404016
39-0.068641-0.46550.321869
40-0.16016-1.08630.141513
41-0.021055-0.14280.443535
420.0619380.42010.338189
430.0313340.21250.416321
440.0382060.25910.398348
45-0.001187-0.00810.496805
46NANANA
47NANANA
48NANANA


Parameters (Session):
par1 = 48 ; par2 = 1 ; par3 = 0 ; par4 = 1 ; par5 = 12 ; par6 = White Noise ; par7 = 0.95 ;
Parameters (R input):
par1 = 48 ; par2 = 1 ; par3 = 0 ; par4 = 1 ; par5 = 12 ; par6 = White Noise ; par7 = 0.95 ;
R code (references can be found in the software module):
if (par1 == 'Default') {
par1 = 10*log10(length(x))
} else {
par1 <- as.numeric(par1)
}
par2 <- as.numeric(par2)
par3 <- as.numeric(par3)
par4 <- as.numeric(par4)
par5 <- as.numeric(par5)
if (par6 == 'White Noise') par6 <- 'white' else par6 <- 'ma'
par7 <- as.numeric(par7)
if (par2 == 0) {
x <- log(x)
} else {
x <- (x ^ par2 - 1) / par2
}
if (par3 > 0) x <- diff(x,lag=1,difference=par3)
if (par4 > 0) x <- diff(x,lag=par5,difference=par4)
bitmap(file='pic1.png')
racf <- acf(x, par1, main='Autocorrelation', xlab='time lag', ylab='ACF', ci.type=par6, ci=par7, sub=paste('(lambda=',par2,', d=',par3,', D=',par4,', CI=', par7, ', CI type=',par6,')',sep=''))
dev.off()
bitmap(file='pic2.png')
rpacf <- pacf(x,par1,main='Partial Autocorrelation',xlab='lags',ylab='PACF')
dev.off()
(myacf <- c(racf$acf))
(mypacf <- c(rpacf$acf))
lengthx <- length(x)
sqrtn <- sqrt(lengthx)
load(file='createtable')
a<-table.start()
a<-table.row.start(a)
a<-table.element(a,'Autocorrelation Function',4,TRUE)
a<-table.row.end(a)
a<-table.row.start(a)
a<-table.element(a,'Time lag k',header=TRUE)
a<-table.element(a,hyperlink('basics.htm','ACF(k)','click here for more information about the Autocorrelation Function'),header=TRUE)
a<-table.element(a,'T-STAT',header=TRUE)
a<-table.element(a,'P-value',header=TRUE)
a<-table.row.end(a)
for (i in 2:(par1+1)) {
a<-table.row.start(a)
a<-table.element(a,i-1,header=TRUE)
a<-table.element(a,round(myacf[i],6))
mytstat <- myacf[i]*sqrtn
a<-table.element(a,round(mytstat,4))
a<-table.element(a,round(1-pt(abs(mytstat),lengthx),6))
a<-table.row.end(a)
}
a<-table.end(a)
table.save(a,file='mytable.tab')
a<-table.start()
a<-table.row.start(a)
a<-table.element(a,'Partial Autocorrelation Function',4,TRUE)
a<-table.row.end(a)
a<-table.row.start(a)
a<-table.element(a,'Time lag k',header=TRUE)
a<-table.element(a,hyperlink('basics.htm','PACF(k)','click here for more information about the Partial Autocorrelation Function'),header=TRUE)
a<-table.element(a,'T-STAT',header=TRUE)
a<-table.element(a,'P-value',header=TRUE)
a<-table.row.end(a)
for (i in 1:par1) {
a<-table.row.start(a)
a<-table.element(a,i,header=TRUE)
a<-table.element(a,round(mypacf[i],6))
mytstat <- mypacf[i]*sqrtn
a<-table.element(a,round(mytstat,4))
a<-table.element(a,round(1-pt(abs(mytstat),lengthx),6))
a<-table.row.end(a)
}
a<-table.end(a)
table.save(a,file='mytable1.tab')