| Multiple Linear Regression - Estimated Regression Equation |
| logPS[t] = + 1.07450734042495 -0.303538868483002logGT[t] -0.110510499814237D[t] + e[t] |
| Multiple Linear Regression - Ordinary Least Squares | |||||
| Variable | Parameter | S.D. | T-STAT H0: parameter = 0 | 2-tail p-value | 1-tail p-value |
| (Intercept) | 1.07450734042495 | 0.128751 | 8.3456 | 0 | 0 |
| logGT | -0.303538868483002 | 0.068904 | -4.4053 | 9.1e-05 | 4.5e-05 |
| D | -0.110510499814237 | 0.022191 | -4.98 | 1.6e-05 | 8e-06 |
| Multiple Linear Regression - Regression Statistics | |
| Multiple R | 0.809091683132234 |
| R-squared | 0.654629351713752 |
| Adjusted R-squared | 0.635442093475627 |
| F-TEST (value) | 34.1179205277495 |
| F-TEST (DF numerator) | 2 |
| F-TEST (DF denominator) | 36 |
| p-value | 4.88807283538506e-09 |
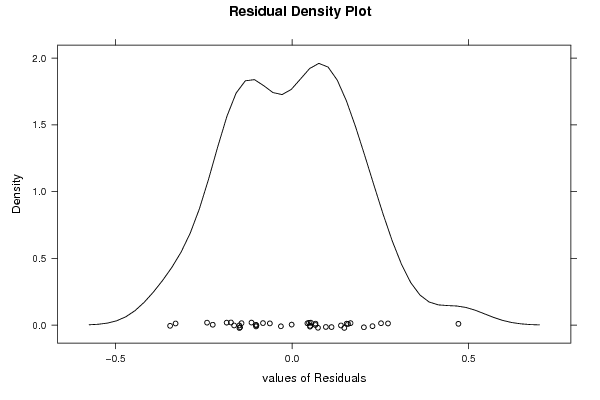
| Multiple Linear Regression - Residual Statistics | |
| Residual Standard Deviation | 0.181764010644749 |
| Sum Squared Residuals | 1.18937360036391 |
| Multiple Linear Regression - Actuals, Interpolation, and Residuals | |||
| Time or Index | Actuals | Interpolation Forecast | Residuals Prediction Error |
| 1 | 0.301029995663981 | 0.250256588109022 | 0.0507734075549589 |
| 2 | 0.255272505103306 | -0.215981826385327 | 0.471254331488633 |
| 3 | -0.154901959985743 | -0.0520975231518851 | -0.102804436833858 |
| 4 | 0.591064607026499 | 0.495312173567864 | 0.095752433458635 |
| 5 | 0 | -0.154697777268126 | 0.154697777268126 |
| 6 | 0.556302500767287 | 0.417827046213987 | 0.138475454553300 |
| 7 | 0.146128035678238 | 0.247120645601121 | -0.100992609922883 |
| 8 | 0.176091259055681 | 0.0104480212917179 | 0.165643237763963 |
| 9 | -0.154901959985743 | -0.221322704237402 | 0.0664207442516587 |
| 10 | 0.322219294733919 | 0.471277587737495 | -0.149058293003576 |
| 11 | 0.612783856719735 | 0.360767087923258 | 0.252016768796477 |
| 12 | 0.079181246047625 | 0.2223740180001 | -0.143192771952475 |
| 13 | -0.301029995663981 | -0.136803944049203 | -0.164226051614778 |
| 14 | 0.531478917042255 | 0.487989123743323 | 0.043489793298932 |
| 15 | 0.176091259055681 | 0.20777173108236 | -0.0316804720266788 |
| 16 | 0.531478917042255 | 0.30370712963253 | 0.227771787409725 |
| 17 | -0.096910013008056 | 0.0762276593201308 | -0.173137672328187 |
| 18 | -0.096910013008056 | -0.244887324309315 | 0.147977311301259 |
| 19 | 0.301029995663981 | 0.448293407907993 | -0.147263412244012 |
| 20 | 0.278753600952829 | 0.227456357974843 | 0.0512972429779861 |
| 21 | 0.113943352306837 | 0.35482441988045 | -0.240881067573613 |
| 22 | 0.7481880270062 | 0.636423386297339 | 0.111764640708861 |
| 23 | 0.491361693834273 | 0.332884517814337 | 0.158477176019936 |
| 24 | 0.255272505103306 | 0.202053065227052 | 0.053219439876254 |
| 25 | -0.045757490560675 | -0.0445626006362934 | -0.00119488992438162 |
| 26 | 0.255272505103306 | 0.479997267475183 | -0.224724762371877 |
| 27 | 0.278753600952829 | 0.00696345042169844 | 0.271790150531131 |
| 28 | -0.045757490560675 | 0.0692686003084149 | -0.115026090869090 |
| 29 | 0.414973347970818 | 0.341630892372309 | 0.0733424555985088 |
| 30 | 0.380211241711606 | 0.443123127370754 | -0.0629118856591484 |
| 31 | 0.079181246047625 | 0.181195145293536 | -0.102013899245911 |
| 32 | -0.045757490560675 | 0.139507520783452 | -0.185265011344127 |
| 33 | -0.301029995663981 | 0.0289970209692152 | -0.330027016633196 |
| 34 | -0.221848749616356 | -0.139449355678153 | -0.0823993939382035 |
| 35 | 0.361727836017593 | 0.313748322263388 | 0.0479795137542055 |
| 36 | -0.301029995663981 | 0.0445237997529443 | -0.345553795416925 |
| 37 | 0.414973347970818 | 0.348774710006599 | 0.0661986379642188 |
| 38 | -0.221848749616356 | -0.07241847592493 | -0.149430273691426 |
| 39 | 0.819543935541869 | 0.616102433524291 | 0.203441502017578 |
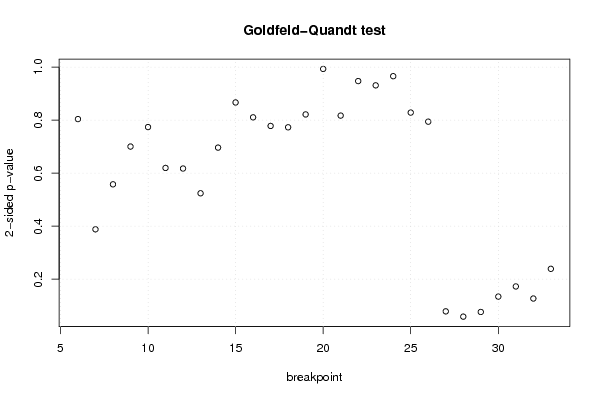
| Goldfeld-Quandt test for Heteroskedasticity | |||
| p-values | Alternative Hypothesis | ||
| breakpoint index | greater | 2-sided | less |
| 6 | 0.59792896957381 | 0.804142060852381 | 0.402071030426190 |
| 7 | 0.805814977507913 | 0.388370044984173 | 0.194185022492087 |
| 8 | 0.720981818694392 | 0.558036362611216 | 0.279018181305608 |
| 9 | 0.649764792858961 | 0.700470414282078 | 0.350235207141039 |
| 10 | 0.613004805277026 | 0.773990389445948 | 0.386995194722974 |
| 11 | 0.690107188097556 | 0.619785623804888 | 0.309892811902444 |
| 12 | 0.691199655958221 | 0.617600688083557 | 0.308800344041779 |
| 13 | 0.737898423674936 | 0.524203152650127 | 0.262101576325064 |
| 14 | 0.651773096047823 | 0.696453807904354 | 0.348226903952177 |
| 15 | 0.566642974519504 | 0.866714050960991 | 0.433357025480496 |
| 16 | 0.594689072319502 | 0.810621855360996 | 0.405310927680498 |
| 17 | 0.610880146167724 | 0.778239707664553 | 0.389119853832276 |
| 18 | 0.613441083996038 | 0.773117832007923 | 0.386558916003962 |
| 19 | 0.589205364713022 | 0.821589270573956 | 0.410794635286978 |
| 20 | 0.503427823550455 | 0.99314435289909 | 0.496572176449545 |
| 21 | 0.591400030643507 | 0.817199938712986 | 0.408599969356493 |
| 22 | 0.526280887806508 | 0.947438224386984 | 0.473719112193492 |
| 23 | 0.534351614657265 | 0.93129677068547 | 0.465648385342735 |
| 24 | 0.482913739935614 | 0.965827479871228 | 0.517086260064386 |
| 25 | 0.414301128450375 | 0.828602256900751 | 0.585698871549625 |
| 26 | 0.602854839068513 | 0.794290321862975 | 0.397145160931487 |
| 27 | 0.960558244179997 | 0.0788835116400054 | 0.0394417558200027 |
| 28 | 0.970552683437967 | 0.0588946331240653 | 0.0294473165620327 |
| 29 | 0.961721815063125 | 0.0765563698737498 | 0.0382781849368749 |
| 30 | 0.932745485002606 | 0.134509029994789 | 0.0672545149973943 |
| 31 | 0.913605273138464 | 0.172789453723072 | 0.0863947268615362 |
| 32 | 0.936353640760043 | 0.127292718479914 | 0.063646359239957 |
| 33 | 0.8803569925688 | 0.239286014862401 | 0.119643007431201 |
| Meta Analysis of Goldfeld-Quandt test for Heteroskedasticity | |||
| Description | # significant tests | % significant tests | OK/NOK |
| 1% type I error level | 0 | 0 | OK |
| 5% type I error level | 0 | 0 | OK |
| 10% type I error level | 3 | 0.107142857142857 | NOK |