| Multiple Linear Regression - Estimated Regression Equation |
| PS[t] = + 3.73727356178825 -0.498628257437097ODI[t] -0.0032533153842104GT[t] + e[t] |
| Multiple Linear Regression - Ordinary Least Squares | |||||
| Variable | Parameter | S.D. | T-STAT H0: parameter = 0 | 2-tail p-value | 1-tail p-value |
| (Intercept) | 3.73727356178825 | 0.37911 | 9.858 | 0 | 0 |
| ODI | -0.498628257437097 | 0.130456 | -3.8222 | 0.000505 | 0.000252 |
| GT | -0.0032533153842104 | 0.001433 | -2.2704 | 0.029267 | 0.014634 |
| Multiple Linear Regression - Regression Statistics | |
| Multiple R | 0.666719264617542 |
| R-squared | 0.444514577812156 |
| Adjusted R-squared | 0.413654276579498 |
| F-TEST (value) | 14.4040906944144 |
| F-TEST (DF numerator) | 2 |
| F-TEST (DF denominator) | 36 |
| p-value | 2.53575908029102e-05 |
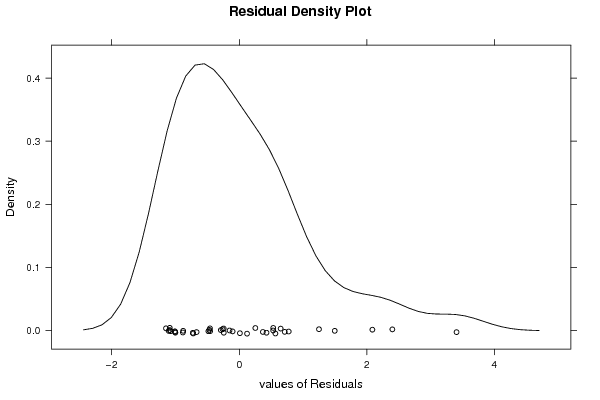
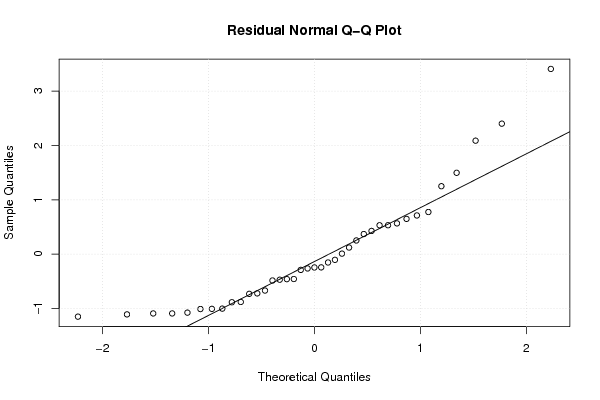
| Multiple Linear Regression - Residual Statistics | |
| Residual Standard Deviation | 1.07629394981051 |
| Sum Squared Residuals | 41.7027119903536 |
| Multiple Linear Regression - Actuals, Interpolation, and Residuals | |||
| Time or Index | Actuals | Interpolation Forecast | Residuals Prediction Error |
| 1 | 2 | 2.10474954334012 | -0.104749543340121 |
| 2 | 1.8 | -0.287308267707433 | 2.08730826770743 |
| 3 | 0.7 | 1.15716376288199 | -0.457163762881985 |
| 4 | 3.9 | 3.12477926590379 | 0.775220734096213 |
| 5 | 1 | 0.467460901429381 | 0.532539098570619 |
| 6 | 3.6 | 3.0336864351459 | 0.566313564854105 |
| 7 | 1.4 | 2.49038276598276 | -1.09038276598276 |
| 8 | 1.5 | 1.37838920900829 | 0.121610790991707 |
| 9 | 0.7 | 0.329950651639638 | 0.370049348360362 |
| 10 | 2.1 | 3.10200605821431 | -1.00200605821431 |
| 11 | 4.1 | 2.60337780077722 | 1.49662219922278 |
| 12 | 1.2 | 2.34961920080881 | -1.14961920080881 |
| 13 | 0.5 | 0.762641597739621 | -0.262641597739621 |
| 14 | 3.4 | 2.68796400076669 | 0.712035999233313 |
| 15 | 1.5 | 2.23011753524593 | -0.730117535245926 |
| 16 | 3.4 | 2.15029595871906 | 1.24970404128094 |
| 17 | 0.8 | 1.52153508591355 | -0.72153508591355 |
| 18 | 0.8 | 0.151018305508066 | 0.648981694491934 |
| 19 | 2 | 3.07597953514063 | -1.07597953514063 |
| 20 | 1.9 | 2.37001009676697 | -0.470010096766974 |
| 21 | 1.3 | 2.17957579717696 | -0.879575797176958 |
| 22 | 5.6 | 3.19960551974063 | 2.40039448025937 |
| 23 | 3.1 | 2.8482474582459 | 0.251752541754098 |
| 24 | 1.8 | 2.2845528931246 | -0.484552893124597 |
| 25 | 0.9 | 1.18969691672409 | -0.28969691672409 |
| 26 | 1.8 | 2.68471068538248 | -0.884710685382476 |
| 27 | 1.9 | 1.36862926285566 | 0.531370737144338 |
| 28 | 0.9 | 1.14327949769224 | -0.243279497692238 |
| 29 | 2.6 | 2.17306916640854 | 0.426930833591463 |
| 30 | 2.4 | 3.06947290437221 | -0.66947290437221 |
| 31 | 1.2 | 2.20647332390355 | -1.00647332390355 |
| 32 | 0.9 | 2.00802108546671 | -1.10802108546671 |
| 33 | 0.5 | 1.50939282802962 | -1.00939282802962 |
| 34 | 0.6 | 0.75288165158699 | -0.15288165158699 |
| 35 | 2.3 | 2.54481812386143 | -0.244818123861429 |
| 36 | 0.5 | 1.59072571263488 | -1.09072571263488 |
| 37 | 2.6 | 2.59036453924037 | 0.00963546075962537 |
| 38 | 0.6 | 1.05956430135567 | -0.459564301355674 |
| 39 | 6.6 | 3.1930988889722 | 3.40690111102779 |
| Goldfeld-Quandt test for Heteroskedasticity | |||
| p-values | Alternative Hypothesis | ||
| breakpoint index | greater | 2-sided | less |
| 6 | 0.033614961752678 | 0.067229923505356 | 0.966385038247322 |
| 7 | 0.582629204610294 | 0.834741590779412 | 0.417370795389706 |
| 8 | 0.431028123246939 | 0.862056246493878 | 0.568971876753061 |
| 9 | 0.313351626229227 | 0.626703252458455 | 0.686648373770773 |
| 10 | 0.291235982062559 | 0.582471964125118 | 0.708764017937441 |
| 11 | 0.462474967978971 | 0.924949935957942 | 0.537525032021029 |
| 12 | 0.497976715625335 | 0.99595343125067 | 0.502023284374665 |
| 13 | 0.398669626351157 | 0.797339252702315 | 0.601330373648842 |
| 14 | 0.354039718030021 | 0.708079436060041 | 0.64596028196998 |
| 15 | 0.322763516831035 | 0.64552703366207 | 0.677236483168965 |
| 16 | 0.341509997678281 | 0.683019995356563 | 0.658490002321719 |
| 17 | 0.307742785728935 | 0.615485571457871 | 0.692257214271065 |
| 18 | 0.336281622092707 | 0.672563244185413 | 0.663718377907293 |
| 19 | 0.376649301577644 | 0.753298603155288 | 0.623350698422356 |
| 20 | 0.299423059933946 | 0.598846119867892 | 0.700576940066054 |
| 21 | 0.325745869581994 | 0.651491739163988 | 0.674254130418006 |
| 22 | 0.653136488628588 | 0.693727022742825 | 0.346863511371413 |
| 23 | 0.565721902776301 | 0.868556194447397 | 0.434278097223699 |
| 24 | 0.474104014529102 | 0.948208029058204 | 0.525895985470898 |
| 25 | 0.384579224840519 | 0.769158449681037 | 0.615420775159481 |
| 26 | 0.446758927360744 | 0.893517854721487 | 0.553241072639256 |
| 27 | 0.386084082909654 | 0.772168165819309 | 0.613915917090346 |
| 28 | 0.320725607957796 | 0.641451215915591 | 0.679274392042204 |
| 29 | 0.246446437659139 | 0.492892875318277 | 0.753553562340861 |
| 30 | 0.299980816288758 | 0.599961632577517 | 0.700019183711242 |
| 31 | 0.245146307446801 | 0.490292614893602 | 0.754853692553199 |
| 32 | 0.165882217579332 | 0.331764435158665 | 0.834117782420667 |
| 33 | 0.095801144216936 | 0.191602288433872 | 0.904198855783064 |
| Meta Analysis of Goldfeld-Quandt test for Heteroskedasticity | |||
| Description | # significant tests | % significant tests | OK/NOK |
| 1% type I error level | 0 | 0 | OK |
| 5% type I error level | 0 | 0 | OK |
| 10% type I error level | 1 | 0.0357142857142857 | OK |