| Multiple Linear Regression - Estimated Regression Equation |
| SWS[t] = + 12.5002913623981 -0.00255900349633257BW[t] -1.31330657799119ODI[t] + e[t] |
| Multiple Linear Regression - Ordinary Least Squares | |||||
| Variable | Parameter | S.D. | T-STAT H0: parameter = 0 | 2-tail p-value | 1-tail p-value |
| (Intercept) | 12.5002913623981 | 1.129376 | 11.0683 | 0 | 0 |
| BW | -0.00255900349633257 | 0.001317 | -1.9426 | 0.059923 | 0.029962 |
| ODI | -1.31330657799119 | 0.386405 | -3.3988 | 0.001667 | 0.000834 |
| Multiple Linear Regression - Regression Statistics | |
| Multiple R | 0.600800504937635 |
| R-squared | 0.360961246733317 |
| Adjusted R-squared | 0.325459093774057 |
| F-TEST (value) | 10.1673058292417 |
| F-TEST (DF numerator) | 2 |
| F-TEST (DF denominator) | 36 |
| p-value | 0.000315856287357086 |
| Multiple Linear Regression - Residual Statistics | |
| Residual Standard Deviation | 3.259188225191 |
| Sum Squared Residuals | 382.403083940051 |
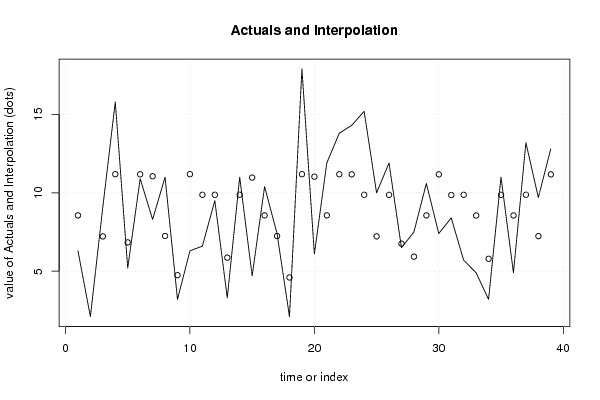
| Multiple Linear Regression - Actuals, Interpolation, and Residuals | |||
| Time or Index | Actuals | Interpolation Forecast | Residuals Prediction Error |
| 1 | 6.3 | 8.55781262492819 | -2.25781262492819 |
| 2 | 2.1 | 0.729283145274269 | 1.37071685472573 |
| 3 | 9.1 | 7.22006756354701 | 1.87993243645299 |
| 4 | 15.8 | 11.1869259273265 | 4.61307407267354 |
| 5 | 5.2 | 6.83762449102011 | -1.63762449102011 |
| 6 | 10.9 | 11.1785400728690 | -0.278540072868979 |
| 7 | 8.3 | 11.0535071620382 | -2.75350716203817 |
| 8 | 11 | 7.24597747394738 | 3.75402252605262 |
| 9 | 3.2 | 4.74382184664749 | -1.54382184664749 |
| 10 | 6.3 | 11.1867928591447 | -4.88679285914465 |
| 11 | 6.6 | 9.87166938867107 | -3.27166938867107 |
| 12 | 9.5 | 9.87316640571642 | -0.373166405716424 |
| 13 | 3.3 | 5.86297643573358 | -2.56297643573357 |
| 14 | 11 | 9.87337112599613 | 1.12662887400387 |
| 15 | 4.7 | 10.9694694872186 | -6.26946948721861 |
| 16 | 10.4 | 8.56011316907137 | 1.83988683092863 |
| 17 | 7.4 | 7.24440368679713 | 0.155596313202868 |
| 18 | 2.1 | 4.60051765085286 | -2.50051765085286 |
| 19 | 17.9 | 11.1869591943719 | 6.71304080562808 |
| 20 | 6.1 | 11.0283265676343 | -4.92832656763426 |
| 21 | 11.9 | 8.56031277134409 | 3.33968722865591 |
| 22 | 13.8 | 11.1826344784631 | 2.61736552153689 |
| 23 | 14.3 | 11.1780282721697 | 3.12197172783029 |
| 24 | 15.2 | 9.87244988473745 | 5.32755011526255 |
| 25 | 10 | 7.22147501546999 | 2.77852498453001 |
| 26 | 11.9 | 9.86953262075163 | 2.03046737924837 |
| 27 | 6.5 | 6.75573637913747 | -0.255736379137465 |
| 28 | 7.5 | 5.9273609637013 | 1.5726390362987 |
| 29 | 10.6 | 8.55965510744553 | 2.04034489255447 |
| 30 | 7.4 | 11.1761474045999 | -3.77614740459991 |
| 31 | 8.4 | 9.85627698264063 | -1.45627698264063 |
| 32 | 5.7 | 9.87175895379344 | -4.17175895379344 |
| 33 | 4.9 | 8.5511592158377 | -3.65115921583771 |
| 34 | 3.2 | 5.79173377839567 | -2.59173377839567 |
| 35 | 11 | 9.871375103269 | 1.12862489673101 |
| 36 | 4.9 | 8.55525362143184 | -3.65525362143184 |
| 37 | 13.2 | 9.87341207005207 | 3.32658792994793 |
| 38 | 9.7 | 7.23634282578369 | 2.46365717421631 |
| 39 | 12.8 | 11.1780282721697 | 1.62197172783029 |
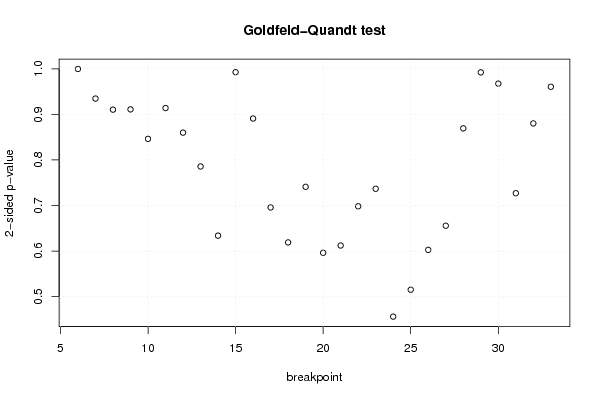
| Goldfeld-Quandt test for Heteroskedasticity | |||
| p-values | Alternative Hypothesis | ||
| breakpoint index | greater | 2-sided | less |
| 6 | 0.500220789801715 | 0.99955842039657 | 0.499779210198285 |
| 7 | 0.532691300863795 | 0.93461739827241 | 0.467308699136205 |
| 8 | 0.544852372126302 | 0.910295255747396 | 0.455147627873698 |
| 9 | 0.455476636415338 | 0.910953272830675 | 0.544523363584662 |
| 10 | 0.576884356564888 | 0.846231286870223 | 0.423115643435112 |
| 11 | 0.543108585182863 | 0.913782829634274 | 0.456891414817137 |
| 12 | 0.42992437704554 | 0.85984875409108 | 0.57007562295446 |
| 13 | 0.392848993153244 | 0.785697986306487 | 0.607151006846756 |
| 14 | 0.316993333486883 | 0.633986666973765 | 0.683006666513117 |
| 15 | 0.503766501660459 | 0.992466996679082 | 0.496233498339541 |
| 16 | 0.445427010043534 | 0.890854020087068 | 0.554572989956466 |
| 17 | 0.347894951796013 | 0.695789903592026 | 0.652105048203987 |
| 18 | 0.309580974413335 | 0.61916194882667 | 0.690419025586665 |
| 19 | 0.62944323419852 | 0.741113531602959 | 0.370556765801480 |
| 20 | 0.701818895654741 | 0.596362208690518 | 0.298181104345259 |
| 21 | 0.693843070248617 | 0.612313859502766 | 0.306156929751383 |
| 22 | 0.65083814620952 | 0.698323707580961 | 0.349161853790481 |
| 23 | 0.631613273524136 | 0.736773452951729 | 0.368386726475865 |
| 24 | 0.77185336455282 | 0.456293270894361 | 0.228146635447181 |
| 25 | 0.742307100232997 | 0.515385799534007 | 0.257692899767003 |
| 26 | 0.698616543702639 | 0.602766912594722 | 0.301383456297361 |
| 27 | 0.672162382952942 | 0.655675234094117 | 0.327837617047058 |
| 28 | 0.565364223683537 | 0.869271552632925 | 0.434635776316463 |
| 29 | 0.496030302367652 | 0.992060604735303 | 0.503969697632348 |
| 30 | 0.483686012375486 | 0.967372024750971 | 0.516313987624514 |
| 31 | 0.363496636275765 | 0.72699327255153 | 0.636503363724235 |
| 32 | 0.440041039733698 | 0.880082079467395 | 0.559958960266302 |
| 33 | 0.480228238302876 | 0.96045647660575 | 0.519771761697124 |
| Meta Analysis of Goldfeld-Quandt test for Heteroskedasticity | |||
| Description | # significant tests | % significant tests | OK/NOK |
| 1% type I error level | 0 | 0 | OK |
| 5% type I error level | 0 | 0 | OK |
| 10% type I error level | 0 | 0 | OK |