| Multiple Linear Regression - Estimated Regression Equation |
| SWS[t] = + 12.4555798543405 -0.00260911694231715BW[t] -1.28218471390278ODI[t] + e[t] |
| Multiple Linear Regression - Ordinary Least Squares | |||||
| Variable | Parameter | S.D. | T-STAT H0: parameter = 0 | 2-tail p-value | 1-tail p-value |
| (Intercept) | 12.4555798543405 | 1.081005 | 11.5222 | 0 | 0 |
| BW | -0.00260911694231715 | 0.00127 | -2.0539 | 0.046731 | 0.023365 |
| ODI | -1.28218471390278 | 0.368019 | -3.484 | 0.001236 | 0.000618 |
| Multiple Linear Regression - Regression Statistics | |
| Multiple R | 0.596267051905123 |
| R-squared | 0.355534397187627 |
| Adjusted R-squared | 0.322484879094684 |
| F-TEST (value) | 10.7576272727423 |
| F-TEST (DF numerator) | 2 |
| F-TEST (DF denominator) | 39 |
| p-value | 0.000190280805482668 |
| Multiple Linear Regression - Residual Statistics | |
| Residual Standard Deviation | 3.15864460417671 |
| Sum Squared Residuals | 389.104393684292 |
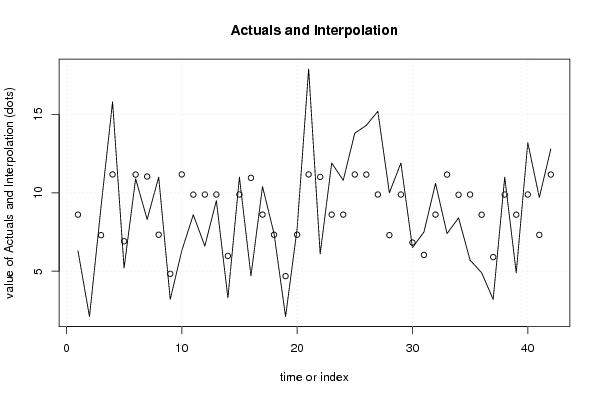
| Multiple Linear Regression - Actuals, Interpolation, and Residuals | |||
| Time or Index | Actuals | Interpolation Forecast | Residuals Prediction Error |
| 1 | 6.3 | 8.60641659568987 | -2.30641659568987 |
| 2 | 2.1 | 0.68142014664763 | 1.41857985335237 |
| 3 | 9.1 | 7.29931481498797 | 1.80068518501203 |
| 4 | 15.8 | 11.1733351307481 | 4.62666486925192 |
| 5 | 5.2 | 6.90938228795867 | -1.70938228795867 |
| 6 | 10.9 | 11.1647850545281 | -0.264785054528106 |
| 7 | 8.3 | 11.0373036007265 | -2.73730360072649 |
| 8 | 11 | 7.32573212402893 | 3.67426787597107 |
| 9 | 3.2 | 4.83141690664916 | -1.63141690664916 |
| 10 | 6.3 | 11.1731994566671 | -4.87319945666708 |
| 11 | 8.6 | 9.88338307570802 | -1.28338307570802 |
| 12 | 6.6 | 9.88916226973525 | -3.28916226973525 |
| 13 | 9.5 | 9.8906886031465 | -0.390688603146509 |
| 14 | 3.3 | 5.97248811020214 | -2.67248811020214 |
| 15 | 11 | 9.8908973325019 | 1.10910266749811 |
| 16 | 4.7 | 10.9516202003408 | -6.2516202003408 |
| 17 | 10.4 | 8.60876219182102 | 1.79123780817898 |
| 18 | 7.4 | 7.3241275171094 | 0.0758724828905984 |
| 19 | 2.1 | 4.68530635787939 | -2.58530635787939 |
| 20 | 7.7 | 7.3268279531447 | 0.3731720468553 |
| 21 | 17.9 | 11.1733690492683 | 6.72663095073167 |
| 22 | 6.1 | 11.0116298900141 | -4.91162989001409 |
| 23 | 11.9 | 8.60896570294252 | 3.29103429705748 |
| 24 | 10.8 | 8.60890047501896 | 2.19109952498104 |
| 25 | 13.8 | 11.1689596416358 | 2.63104035836419 |
| 26 | 14.3 | 11.1642632311396 | 3.13573676886036 |
| 27 | 15.2 | 9.88995805040266 | 5.31004194959734 |
| 28 | 10 | 7.30074982930624 | 2.69925017069376 |
| 29 | 11.9 | 9.88698365708842 | 2.01301634291158 |
| 30 | 6.5 | 6.82589054580452 | -0.325890545804519 |
| 31 | 7.5 | 6.03813349247084 | 1.46186650752916 |
| 32 | 10.6 | 8.60829515988834 | 1.99170484011166 |
| 33 | 7.4 | 11.1623455301870 | -3.76234553018704 |
| 34 | 8.4 | 9.87346843132722 | -1.47346843132722 |
| 35 | 5.7 | 9.88925358882824 | -4.18925358882823 |
| 36 | 4.9 | 8.59963289163985 | -3.69963289163985 |
| 37 | 3.2 | 5.89985029452803 | -2.69985029452803 |
| 38 | 11 | 9.88886222128689 | 1.11113777871311 |
| 39 | 4.9 | 8.60380747874756 | -3.70380747874756 |
| 40 | 13.2 | 9.89093907837297 | 3.30906092162703 |
| 41 | 9.7 | 7.3159087987411 | 2.38409120125890 |
| 42 | 12.8 | 11.1642632311396 | 1.63573676886036 |
| Goldfeld-Quandt test for Heteroskedasticity | |||
| p-values | Alternative Hypothesis | ||
| breakpoint index | greater | 2-sided | less |
| 6 | 0.535716424562647 | 0.928567150874706 | 0.464283575437353 |
| 7 | 0.575878308666456 | 0.848243382667088 | 0.424121691333544 |
| 8 | 0.594100404240695 | 0.81179919151861 | 0.405899595759305 |
| 9 | 0.509370119143885 | 0.98125976171223 | 0.490629880856115 |
| 10 | 0.636830824485833 | 0.726338351028334 | 0.363169175514167 |
| 11 | 0.530057552620195 | 0.93988489475961 | 0.469942447379805 |
| 12 | 0.50445962795534 | 0.991080744089321 | 0.495540372044661 |
| 13 | 0.398605559704363 | 0.797211119408726 | 0.601394440295637 |
| 14 | 0.370791301020504 | 0.741582602041009 | 0.629208698979496 |
| 15 | 0.303195381515266 | 0.606390763030531 | 0.696804618484734 |
| 16 | 0.503717700513812 | 0.992564598972375 | 0.496282299486188 |
| 17 | 0.451582972949025 | 0.903165945898051 | 0.548417027050975 |
| 18 | 0.358137564548431 | 0.716275129096862 | 0.641862435451569 |
| 19 | 0.326337313348861 | 0.652674626697721 | 0.67366268665114 |
| 20 | 0.249144081238706 | 0.498288162477412 | 0.750855918761294 |
| 21 | 0.582059857957743 | 0.835880284084515 | 0.417940142042257 |
| 22 | 0.665114123862316 | 0.669771752275367 | 0.334885876137684 |
| 23 | 0.660226211909543 | 0.679547576180914 | 0.339773788090457 |
| 24 | 0.604196699926048 | 0.791606600147904 | 0.395803300073952 |
| 25 | 0.561674477371757 | 0.876651045256487 | 0.438325522628243 |
| 26 | 0.546465236393335 | 0.907069527213329 | 0.453534763606665 |
| 27 | 0.707992254636306 | 0.584015490727389 | 0.292007745363695 |
| 28 | 0.677564825264249 | 0.644870349471502 | 0.322435174735751 |
| 29 | 0.633782513717054 | 0.732434972565893 | 0.366217486282946 |
| 30 | 0.61060705770592 | 0.77878588458816 | 0.38939294229408 |
| 31 | 0.501906721577069 | 0.996186556845862 | 0.498093278422931 |
| 32 | 0.436401712786906 | 0.872803425573812 | 0.563598287213094 |
| 33 | 0.428915269787507 | 0.857830539575014 | 0.571084730212493 |
| 34 | 0.315601554792573 | 0.631203109585146 | 0.684398445207427 |
| 35 | 0.397470864479233 | 0.794941728958465 | 0.602529135520767 |
| 36 | 0.445495445461359 | 0.890990890922719 | 0.554504554538641 |
| Meta Analysis of Goldfeld-Quandt test for Heteroskedasticity | |||
| Description | # significant tests | % significant tests | OK/NOK |
| 1% type I error level | 0 | 0 | OK |
| 5% type I error level | 0 | 0 | OK |
| 10% type I error level | 0 | 0 | OK |