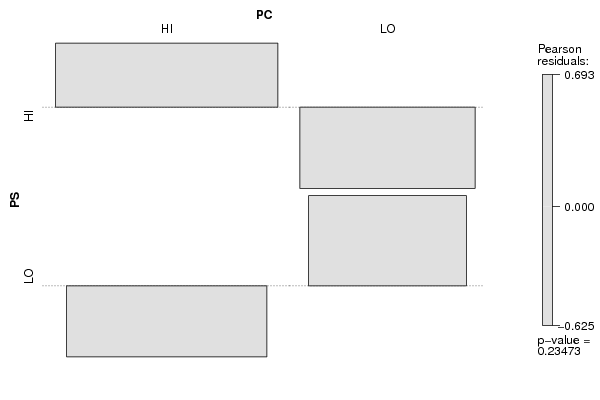
| Tabulation of Results | ||
| PS x PC | ||
| HI | LO | HI | 56 | 29 | LO | 39 | 30 |
| Tabulation of Expected Results | ||
| PS x PC | ||
| HI | LO | HI | 52.44 | 32.56 | LO | 42.56 | 26.44 |
| Statistical Results | |
| Pearson's Chi-squared test with simulated p-value (based on 2000 replicates) | |
| Exact Pearson Chi Square Statistic | 1.41 |
| P value | 0.24 |