| Tabulation of Results | ||
| PS x H | ||
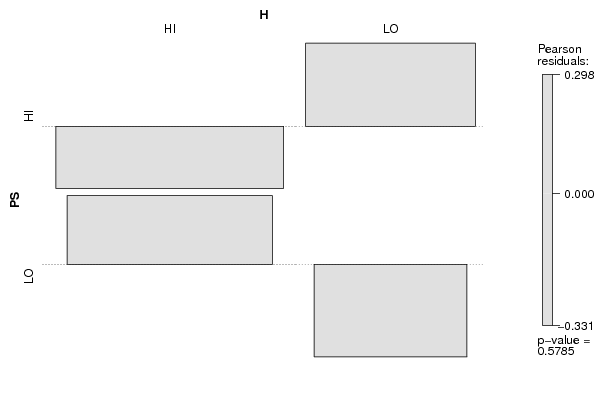
| HI | LO | HI | 53 | 32 | LO | 46 | 23 |
| Tabulation of Expected Results | ||
| PS x H | ||
| HI | LO | HI | 54.64 | 30.36 | LO | 44.36 | 24.64 |
| Statistical Results | |
| Pearson's Chi-squared test with simulated p-value (based on 2000 replicates) | |
| Exact Pearson Chi Square Statistic | 0.31 |
| P value | 0.6 |