Free Statistics

of Irreproducible Research!

Author's title

Author*The author of this computation has been verified*
R Software Modulerwasp_arimaforecasting.wasp
Title produced by softwareARIMA Forecasting
Date of computationMon, 13 Dec 2010 16:23:13 +0000
Cite this page as followsStatistical Computations at FreeStatistics.org, Office for Research Development and Education, URL https://freestatistics.org/blog/index.php?v=date/2010/Dec/13/t1292257270ep283acxvexn8v5.htm/, Retrieved Tue, 07 May 2024 01:40:19 +0000
Statistical Computations at FreeStatistics.org, Office for Research Development and Education, URL https://freestatistics.org/blog/index.php?pk=108972, Retrieved Tue, 07 May 2024 01:40:19 +0000
QR Codes:

Original text written by user:
IsPrivate?No (this computation is public)
User-defined keywords
Estimated Impact166
Family? (F = Feedback message, R = changed R code, M = changed R Module, P = changed Parameters, D = changed Data)
-     [Univariate Data Series] [data set] [2008-12-01 19:54:57] [b98453cac15ba1066b407e146608df68]
- RMP   [Spectral Analysis] [Unemployment] [2010-11-29 09:27:34] [b98453cac15ba1066b407e146608df68]
-   PD    [Spectral Analysis] [Workshop 9 CP (1)] [2010-12-07 15:31:19] [a9e130f95bad0a0597234e75c6380c5a]
-           [Spectral Analysis] [] [2010-12-07 22:07:26] [afdb2fc47981b6a655b732edc8065db9]
- RMPD        [Standard Deviation-Mean Plot] [] [2010-12-12 13:55:03] [afdb2fc47981b6a655b732edc8065db9]
- RMP             [ARIMA Forecasting] [] [2010-12-13 16:23:13] [297722d8c88c4886be8e106c47d8f3cc] [Current]
Feedback Forum

Post a new message
Dataseries X:
100918
105017
108666
116083
117359
102191
102617
106640
108783
112534
113149
117125
107597
108745
111311
115669
114585
101628
97493
99180
100247
97657
95378
89406
82880
82662
83469
86371
86822
73899
71415
76335
76844
78192
80651
81485
78872
81632
84822
92175
92844
77443
77550
80367
83117
86622
90999
90276
91982
96279
106810
109483
110159
98305
99450
101536
99925
102850
101993
108928
107605


Summary of computational transaction
Raw Inputview raw input (R code)
Raw Outputview raw output of R engine
Computing time2 seconds
R Server'RServer@AstonUniversity' @ vre.aston.ac.uk

\begin{tabular}{lllllllll}
\hline
Summary of computational transaction \tabularnewline
Raw Input & view raw input (R code)  \tabularnewline
Raw Output & view raw output of R engine  \tabularnewline
Computing time & 2 seconds \tabularnewline
R Server & 'RServer@AstonUniversity' @ vre.aston.ac.uk \tabularnewline
\hline
\end{tabular}
%Source: https://freestatistics.org/blog/index.php?pk=108972&T=0

[TABLE]
[ROW][C]Summary of computational transaction[/C][/ROW]
[ROW][C]Raw Input[/C][C]view raw input (R code) [/C][/ROW]
[ROW][C]Raw Output[/C][C]view raw output of R engine [/C][/ROW]
[ROW][C]Computing time[/C][C]2 seconds[/C][/ROW]
[ROW][C]R Server[/C][C]'RServer@AstonUniversity' @ vre.aston.ac.uk[/C][/ROW]
[/TABLE]
Source: https://freestatistics.org/blog/index.php?pk=108972&T=0

Globally Unique Identifier (entire table): ba.freestatistics.org/blog/index.php?pk=108972&T=0

As an alternative you can also use a QR Code:  

The GUIDs for individual cells are displayed in the table below:

Summary of computational transaction
Raw Inputview raw input (R code)
Raw Outputview raw output of R engine
Computing time2 seconds
R Server'RServer@AstonUniversity' @ vre.aston.ac.uk


Univariate ARIMA Extrapolation Forecast
timeY[t]F[t]95% LB95% UBp-value(H0: Y[t] = F[t])P(F[t]>Y[t-1])P(F[t]>Y[t-s])P(F[t]>Y[49])
3778872-------
3881632-------
3984822-------
4092175-------
4192844-------
4277443-------
4377550-------
4480367-------
4583117-------
4686622-------
4790999-------
4890276-------
4991982-------
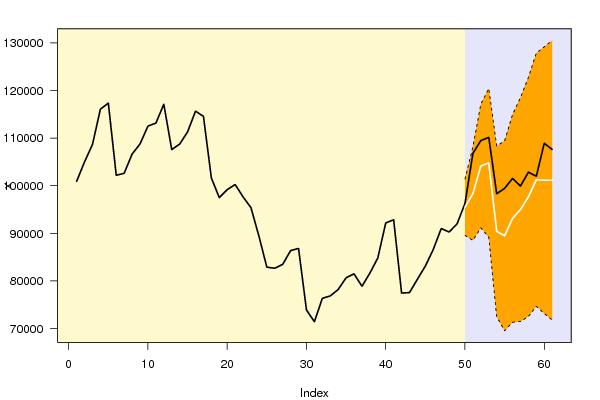
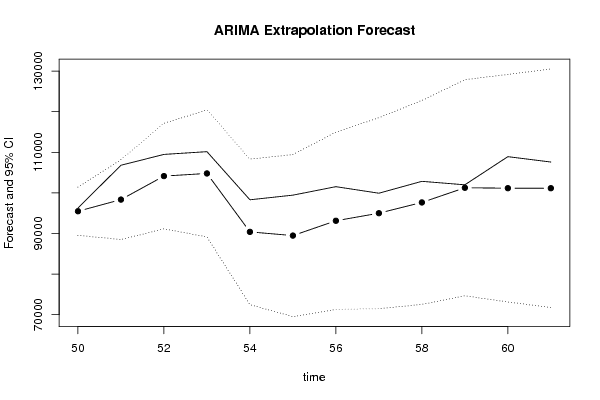
509627995479.97789557.0338101402.92020.39570.876510.8765
5110681098352.204888511.2614108193.14830.0460.66020.99650.8977
52109483104145.137491146.9107117143.36420.21040.34390.96450.9667
53110159104794.700589154.3903120435.01070.25070.27840.93290.9458
549830590398.278872468.8202108327.73730.19370.01540.92160.4313
559945089484.953169517.4896109452.41670.1640.19330.87930.4032
5610153693138.257771319.4417114957.07370.22530.28540.87440.5414
579992595000.333171474.5303118526.13590.34080.2930.83890.5993
5810285097650.204672532.8869122767.52220.34250.42960.80530.6709
59101993101266.685474652.773127880.59790.47870.45360.77520.7529
60108928101161.155173130.4135129191.89670.29350.47680.77670.7395
61107605101154.423971775.093130533.75480.33350.3020.72970.7297

\begin{tabular}{lllllllll}
\hline
Univariate ARIMA Extrapolation Forecast \tabularnewline
time & Y[t] & F[t] & 95% LB & 95% UB & p-value(H0: Y[t] = F[t]) & P(F[t]>Y[t-1]) & P(F[t]>Y[t-s]) & P(F[t]>Y[49]) \tabularnewline
37 & 78872 & - & - & - & - & - & - & - \tabularnewline
38 & 81632 & - & - & - & - & - & - & - \tabularnewline
39 & 84822 & - & - & - & - & - & - & - \tabularnewline
40 & 92175 & - & - & - & - & - & - & - \tabularnewline
41 & 92844 & - & - & - & - & - & - & - \tabularnewline
42 & 77443 & - & - & - & - & - & - & - \tabularnewline
43 & 77550 & - & - & - & - & - & - & - \tabularnewline
44 & 80367 & - & - & - & - & - & - & - \tabularnewline
45 & 83117 & - & - & - & - & - & - & - \tabularnewline
46 & 86622 & - & - & - & - & - & - & - \tabularnewline
47 & 90999 & - & - & - & - & - & - & - \tabularnewline
48 & 90276 & - & - & - & - & - & - & - \tabularnewline
49 & 91982 & - & - & - & - & - & - & - \tabularnewline
50 & 96279 & 95479.977 & 89557.0338 & 101402.9202 & 0.3957 & 0.8765 & 1 & 0.8765 \tabularnewline
51 & 106810 & 98352.2048 & 88511.2614 & 108193.1483 & 0.046 & 0.6602 & 0.9965 & 0.8977 \tabularnewline
52 & 109483 & 104145.1374 & 91146.9107 & 117143.3642 & 0.2104 & 0.3439 & 0.9645 & 0.9667 \tabularnewline
53 & 110159 & 104794.7005 & 89154.3903 & 120435.0107 & 0.2507 & 0.2784 & 0.9329 & 0.9458 \tabularnewline
54 & 98305 & 90398.2788 & 72468.8202 & 108327.7373 & 0.1937 & 0.0154 & 0.9216 & 0.4313 \tabularnewline
55 & 99450 & 89484.9531 & 69517.4896 & 109452.4167 & 0.164 & 0.1933 & 0.8793 & 0.4032 \tabularnewline
56 & 101536 & 93138.2577 & 71319.4417 & 114957.0737 & 0.2253 & 0.2854 & 0.8744 & 0.5414 \tabularnewline
57 & 99925 & 95000.3331 & 71474.5303 & 118526.1359 & 0.3408 & 0.293 & 0.8389 & 0.5993 \tabularnewline
58 & 102850 & 97650.2046 & 72532.8869 & 122767.5222 & 0.3425 & 0.4296 & 0.8053 & 0.6709 \tabularnewline
59 & 101993 & 101266.6854 & 74652.773 & 127880.5979 & 0.4787 & 0.4536 & 0.7752 & 0.7529 \tabularnewline
60 & 108928 & 101161.1551 & 73130.4135 & 129191.8967 & 0.2935 & 0.4768 & 0.7767 & 0.7395 \tabularnewline
61 & 107605 & 101154.4239 & 71775.093 & 130533.7548 & 0.3335 & 0.302 & 0.7297 & 0.7297 \tabularnewline
\hline
\end{tabular}
%Source: https://freestatistics.org/blog/index.php?pk=108972&T=1

[TABLE]
[ROW][C]Univariate ARIMA Extrapolation Forecast[/C][/ROW]
[ROW][C]time[/C][C]Y[t][/C][C]F[t][/C][C]95% LB[/C][C]95% UB[/C][C]p-value(H0: Y[t] = F[t])[/C][C]P(F[t]>Y[t-1])[/C][C]P(F[t]>Y[t-s])[/C][C]P(F[t]>Y[49])[/C][/ROW]
[ROW][C]37[/C][C]78872[/C][C]-[/C][C]-[/C][C]-[/C][C]-[/C][C]-[/C][C]-[/C][C]-[/C][/ROW]
[ROW][C]38[/C][C]81632[/C][C]-[/C][C]-[/C][C]-[/C][C]-[/C][C]-[/C][C]-[/C][C]-[/C][/ROW]
[ROW][C]39[/C][C]84822[/C][C]-[/C][C]-[/C][C]-[/C][C]-[/C][C]-[/C][C]-[/C][C]-[/C][/ROW]
[ROW][C]40[/C][C]92175[/C][C]-[/C][C]-[/C][C]-[/C][C]-[/C][C]-[/C][C]-[/C][C]-[/C][/ROW]
[ROW][C]41[/C][C]92844[/C][C]-[/C][C]-[/C][C]-[/C][C]-[/C][C]-[/C][C]-[/C][C]-[/C][/ROW]
[ROW][C]42[/C][C]77443[/C][C]-[/C][C]-[/C][C]-[/C][C]-[/C][C]-[/C][C]-[/C][C]-[/C][/ROW]
[ROW][C]43[/C][C]77550[/C][C]-[/C][C]-[/C][C]-[/C][C]-[/C][C]-[/C][C]-[/C][C]-[/C][/ROW]
[ROW][C]44[/C][C]80367[/C][C]-[/C][C]-[/C][C]-[/C][C]-[/C][C]-[/C][C]-[/C][C]-[/C][/ROW]
[ROW][C]45[/C][C]83117[/C][C]-[/C][C]-[/C][C]-[/C][C]-[/C][C]-[/C][C]-[/C][C]-[/C][/ROW]
[ROW][C]46[/C][C]86622[/C][C]-[/C][C]-[/C][C]-[/C][C]-[/C][C]-[/C][C]-[/C][C]-[/C][/ROW]
[ROW][C]47[/C][C]90999[/C][C]-[/C][C]-[/C][C]-[/C][C]-[/C][C]-[/C][C]-[/C][C]-[/C][/ROW]
[ROW][C]48[/C][C]90276[/C][C]-[/C][C]-[/C][C]-[/C][C]-[/C][C]-[/C][C]-[/C][C]-[/C][/ROW]
[ROW][C]49[/C][C]91982[/C][C]-[/C][C]-[/C][C]-[/C][C]-[/C][C]-[/C][C]-[/C][C]-[/C][/ROW]
[ROW][C]50[/C][C]96279[/C][C]95479.977[/C][C]89557.0338[/C][C]101402.9202[/C][C]0.3957[/C][C]0.8765[/C][C]1[/C][C]0.8765[/C][/ROW]
[ROW][C]51[/C][C]106810[/C][C]98352.2048[/C][C]88511.2614[/C][C]108193.1483[/C][C]0.046[/C][C]0.6602[/C][C]0.9965[/C][C]0.8977[/C][/ROW]
[ROW][C]52[/C][C]109483[/C][C]104145.1374[/C][C]91146.9107[/C][C]117143.3642[/C][C]0.2104[/C][C]0.3439[/C][C]0.9645[/C][C]0.9667[/C][/ROW]
[ROW][C]53[/C][C]110159[/C][C]104794.7005[/C][C]89154.3903[/C][C]120435.0107[/C][C]0.2507[/C][C]0.2784[/C][C]0.9329[/C][C]0.9458[/C][/ROW]
[ROW][C]54[/C][C]98305[/C][C]90398.2788[/C][C]72468.8202[/C][C]108327.7373[/C][C]0.1937[/C][C]0.0154[/C][C]0.9216[/C][C]0.4313[/C][/ROW]
[ROW][C]55[/C][C]99450[/C][C]89484.9531[/C][C]69517.4896[/C][C]109452.4167[/C][C]0.164[/C][C]0.1933[/C][C]0.8793[/C][C]0.4032[/C][/ROW]
[ROW][C]56[/C][C]101536[/C][C]93138.2577[/C][C]71319.4417[/C][C]114957.0737[/C][C]0.2253[/C][C]0.2854[/C][C]0.8744[/C][C]0.5414[/C][/ROW]
[ROW][C]57[/C][C]99925[/C][C]95000.3331[/C][C]71474.5303[/C][C]118526.1359[/C][C]0.3408[/C][C]0.293[/C][C]0.8389[/C][C]0.5993[/C][/ROW]
[ROW][C]58[/C][C]102850[/C][C]97650.2046[/C][C]72532.8869[/C][C]122767.5222[/C][C]0.3425[/C][C]0.4296[/C][C]0.8053[/C][C]0.6709[/C][/ROW]
[ROW][C]59[/C][C]101993[/C][C]101266.6854[/C][C]74652.773[/C][C]127880.5979[/C][C]0.4787[/C][C]0.4536[/C][C]0.7752[/C][C]0.7529[/C][/ROW]
[ROW][C]60[/C][C]108928[/C][C]101161.1551[/C][C]73130.4135[/C][C]129191.8967[/C][C]0.2935[/C][C]0.4768[/C][C]0.7767[/C][C]0.7395[/C][/ROW]
[ROW][C]61[/C][C]107605[/C][C]101154.4239[/C][C]71775.093[/C][C]130533.7548[/C][C]0.3335[/C][C]0.302[/C][C]0.7297[/C][C]0.7297[/C][/ROW]
[/TABLE]
Source: https://freestatistics.org/blog/index.php?pk=108972&T=1

Globally Unique Identifier (entire table): ba.freestatistics.org/blog/index.php?pk=108972&T=1

As an alternative you can also use a QR Code:  

The GUIDs for individual cells are displayed in the table below:

Univariate ARIMA Extrapolation Forecast
timeY[t]F[t]95% LB95% UBp-value(H0: Y[t] = F[t])P(F[t]>Y[t-1])P(F[t]>Y[t-s])P(F[t]>Y[49])
3778872-------
3881632-------
3984822-------
4092175-------
4192844-------
4277443-------
4377550-------
4480367-------
4583117-------
4686622-------
4790999-------
4890276-------
4991982-------
509627995479.97789557.0338101402.92020.39570.876510.8765
5110681098352.204888511.2614108193.14830.0460.66020.99650.8977
52109483104145.137491146.9107117143.36420.21040.34390.96450.9667
53110159104794.700589154.3903120435.01070.25070.27840.93290.9458
549830590398.278872468.8202108327.73730.19370.01540.92160.4313
559945089484.953169517.4896109452.41670.1640.19330.87930.4032
5610153693138.257771319.4417114957.07370.22530.28540.87440.5414
579992595000.333171474.5303118526.13590.34080.2930.83890.5993
5810285097650.204672532.8869122767.52220.34250.42960.80530.6709
59101993101266.685474652.773127880.59790.47870.45360.77520.7529
60108928101161.155173130.4135129191.89670.29350.47680.77670.7395
61107605101154.423971775.093130533.75480.33350.3020.72970.7297


Univariate ARIMA Extrapolation Forecast Performance
time% S.E.PEMAPESq.EMSERMSE
500.03160.00840638437.796800
510.05110.0860.047271534299.324236086368.56056007.1931
520.06370.05130.048528492776.988933555171.36995792.6826
530.07610.05120.049228775708.876432360305.74655688.6119
540.10120.08750.056962516240.673338391492.73196196.0869
550.11380.11140.065999302159.415448543270.51256967.3001
560.11950.09020.069470522075.791751683099.83817189.0959
570.12630.05180.067224252344.118548254255.37316946.5283
580.13120.05320.065727037872.473445896879.49546774.7236
590.13410.00720.0598527532.845941359944.83046431.1698
600.14140.07680.061360323879.981943083938.93516563.8357
610.14820.06380.061641609931.864642961105.01266554.4721

\begin{tabular}{lllllllll}
\hline
Univariate ARIMA Extrapolation Forecast Performance \tabularnewline
time & % S.E. & PE & MAPE & Sq.E & MSE & RMSE \tabularnewline
50 & 0.0316 & 0.0084 & 0 & 638437.7968 & 0 & 0 \tabularnewline
51 & 0.0511 & 0.086 & 0.0472 & 71534299.3242 & 36086368.5605 & 6007.1931 \tabularnewline
52 & 0.0637 & 0.0513 & 0.0485 & 28492776.9889 & 33555171.3699 & 5792.6826 \tabularnewline
53 & 0.0761 & 0.0512 & 0.0492 & 28775708.8764 & 32360305.7465 & 5688.6119 \tabularnewline
54 & 0.1012 & 0.0875 & 0.0569 & 62516240.6733 & 38391492.7319 & 6196.0869 \tabularnewline
55 & 0.1138 & 0.1114 & 0.0659 & 99302159.4154 & 48543270.5125 & 6967.3001 \tabularnewline
56 & 0.1195 & 0.0902 & 0.0694 & 70522075.7917 & 51683099.8381 & 7189.0959 \tabularnewline
57 & 0.1263 & 0.0518 & 0.0672 & 24252344.1185 & 48254255.3731 & 6946.5283 \tabularnewline
58 & 0.1312 & 0.0532 & 0.0657 & 27037872.4734 & 45896879.4954 & 6774.7236 \tabularnewline
59 & 0.1341 & 0.0072 & 0.0598 & 527532.8459 & 41359944.8304 & 6431.1698 \tabularnewline
60 & 0.1414 & 0.0768 & 0.0613 & 60323879.9819 & 43083938.9351 & 6563.8357 \tabularnewline
61 & 0.1482 & 0.0638 & 0.0616 & 41609931.8646 & 42961105.0126 & 6554.4721 \tabularnewline
\hline
\end{tabular}
%Source: https://freestatistics.org/blog/index.php?pk=108972&T=2

[TABLE]
[ROW][C]Univariate ARIMA Extrapolation Forecast Performance[/C][/ROW]
[ROW][C]time[/C][C]% S.E.[/C][C]PE[/C][C]MAPE[/C][C]Sq.E[/C][C]MSE[/C][C]RMSE[/C][/ROW]
[ROW][C]50[/C][C]0.0316[/C][C]0.0084[/C][C]0[/C][C]638437.7968[/C][C]0[/C][C]0[/C][/ROW]
[ROW][C]51[/C][C]0.0511[/C][C]0.086[/C][C]0.0472[/C][C]71534299.3242[/C][C]36086368.5605[/C][C]6007.1931[/C][/ROW]
[ROW][C]52[/C][C]0.0637[/C][C]0.0513[/C][C]0.0485[/C][C]28492776.9889[/C][C]33555171.3699[/C][C]5792.6826[/C][/ROW]
[ROW][C]53[/C][C]0.0761[/C][C]0.0512[/C][C]0.0492[/C][C]28775708.8764[/C][C]32360305.7465[/C][C]5688.6119[/C][/ROW]
[ROW][C]54[/C][C]0.1012[/C][C]0.0875[/C][C]0.0569[/C][C]62516240.6733[/C][C]38391492.7319[/C][C]6196.0869[/C][/ROW]
[ROW][C]55[/C][C]0.1138[/C][C]0.1114[/C][C]0.0659[/C][C]99302159.4154[/C][C]48543270.5125[/C][C]6967.3001[/C][/ROW]
[ROW][C]56[/C][C]0.1195[/C][C]0.0902[/C][C]0.0694[/C][C]70522075.7917[/C][C]51683099.8381[/C][C]7189.0959[/C][/ROW]
[ROW][C]57[/C][C]0.1263[/C][C]0.0518[/C][C]0.0672[/C][C]24252344.1185[/C][C]48254255.3731[/C][C]6946.5283[/C][/ROW]
[ROW][C]58[/C][C]0.1312[/C][C]0.0532[/C][C]0.0657[/C][C]27037872.4734[/C][C]45896879.4954[/C][C]6774.7236[/C][/ROW]
[ROW][C]59[/C][C]0.1341[/C][C]0.0072[/C][C]0.0598[/C][C]527532.8459[/C][C]41359944.8304[/C][C]6431.1698[/C][/ROW]
[ROW][C]60[/C][C]0.1414[/C][C]0.0768[/C][C]0.0613[/C][C]60323879.9819[/C][C]43083938.9351[/C][C]6563.8357[/C][/ROW]
[ROW][C]61[/C][C]0.1482[/C][C]0.0638[/C][C]0.0616[/C][C]41609931.8646[/C][C]42961105.0126[/C][C]6554.4721[/C][/ROW]
[/TABLE]
Source: https://freestatistics.org/blog/index.php?pk=108972&T=2

Globally Unique Identifier (entire table): ba.freestatistics.org/blog/index.php?pk=108972&T=2

As an alternative you can also use a QR Code:  

The GUIDs for individual cells are displayed in the table below:

Univariate ARIMA Extrapolation Forecast Performance
time% S.E.PEMAPESq.EMSERMSE
500.03160.00840638437.796800
510.05110.0860.047271534299.324236086368.56056007.1931
520.06370.05130.048528492776.988933555171.36995792.6826
530.07610.05120.049228775708.876432360305.74655688.6119
540.10120.08750.056962516240.673338391492.73196196.0869
550.11380.11140.065999302159.415448543270.51256967.3001
560.11950.09020.069470522075.791751683099.83817189.0959
570.12630.05180.067224252344.118548254255.37316946.5283
580.13120.05320.065727037872.473445896879.49546774.7236
590.13410.00720.0598527532.845941359944.83046431.1698
600.14140.07680.061360323879.981943083938.93516563.8357
610.14820.06380.061641609931.864642961105.01266554.4721


Parameters (Session):
par1 = FALSE ; par2 = 1 ; par3 = 1 ; par4 = 1 ; par5 = 12 ; par6 = 3 ; par7 = 1 ; par8 = 2 ; par9 = 1 ;
Parameters (R input):
par1 = 12 ; par2 = 1 ; par3 = 1 ; par4 = 1 ; par5 = 12 ; par6 = 1 ; par7 = 0 ; par8 = 1 ; par9 = 0 ; par10 = FALSE ;
R code (references can be found in the software module):
par1 <- as.numeric(par1) #cut off periods
par2 <- as.numeric(par2) #lambda
par3 <- as.numeric(par3) #degree of non-seasonal differencing
par4 <- as.numeric(par4) #degree of seasonal differencing
par5 <- as.numeric(par5) #seasonal period
par6 <- as.numeric(par6) #p
par7 <- as.numeric(par7) #q
par8 <- as.numeric(par8) #P
par9 <- as.numeric(par9) #Q
if (par10 == 'TRUE') par10 <- TRUE
if (par10 == 'FALSE') par10 <- FALSE
if (par2 == 0) x <- log(x)
if (par2 != 0) x <- x^par2
lx <- length(x)
first <- lx - 2*par1
nx <- lx - par1
nx1 <- nx + 1
fx <- lx - nx
if (fx < 1) {
fx <- par5
nx1 <- lx + fx - 1
first <- lx - 2*fx
}
first <- 1
if (fx < 3) fx <- round(lx/10,0)
(arima.out <- arima(x[1:nx], order=c(par6,par3,par7), seasonal=list(order=c(par8,par4,par9), period=par5), include.mean=par10, method='ML'))
(forecast <- predict(arima.out,par1))
(lb <- forecast$pred - 1.96 * forecast$se)
(ub <- forecast$pred + 1.96 * forecast$se)
if (par2 == 0) {
x <- exp(x)
forecast$pred <- exp(forecast$pred)
lb <- exp(lb)
ub <- exp(ub)
}
if (par2 != 0) {
x <- x^(1/par2)
forecast$pred <- forecast$pred^(1/par2)
lb <- lb^(1/par2)
ub <- ub^(1/par2)
}
if (par2 < 0) {
olb <- lb
lb <- ub
ub <- olb
}
(actandfor <- c(x[1:nx], forecast$pred))
(perc.se <- (ub-forecast$pred)/1.96/forecast$pred)
bitmap(file='test1.png')
opar <- par(mar=c(4,4,2,2),las=1)
ylim <- c( min(x[first:nx],lb), max(x[first:nx],ub))
plot(x,ylim=ylim,type='n',xlim=c(first,lx))
usr <- par('usr')
rect(usr[1],usr[3],nx+1,usr[4],border=NA,col='lemonchiffon')
rect(nx1,usr[3],usr[2],usr[4],border=NA,col='lavender')
abline(h= (-3:3)*2 , col ='gray', lty =3)
polygon( c(nx1:lx,lx:nx1), c(lb,rev(ub)), col = 'orange', lty=2,border=NA)
lines(nx1:lx, lb , lty=2)
lines(nx1:lx, ub , lty=2)
lines(x, lwd=2)
lines(nx1:lx, forecast$pred , lwd=2 , col ='white')
box()
par(opar)
dev.off()
prob.dec <- array(NA, dim=fx)
prob.sdec <- array(NA, dim=fx)
prob.ldec <- array(NA, dim=fx)
prob.pval <- array(NA, dim=fx)
perf.pe <- array(0, dim=fx)
perf.mape <- array(0, dim=fx)
perf.mape1 <- array(0, dim=fx)
perf.se <- array(0, dim=fx)
perf.mse <- array(0, dim=fx)
perf.mse1 <- array(0, dim=fx)
perf.rmse <- array(0, dim=fx)
for (i in 1:fx) {
locSD <- (ub[i] - forecast$pred[i]) / 1.96
perf.pe[i] = (x[nx+i] - forecast$pred[i]) / forecast$pred[i]
perf.se[i] = (x[nx+i] - forecast$pred[i])^2
prob.dec[i] = pnorm((x[nx+i-1] - forecast$pred[i]) / locSD)
prob.sdec[i] = pnorm((x[nx+i-par5] - forecast$pred[i]) / locSD)
prob.ldec[i] = pnorm((x[nx] - forecast$pred[i]) / locSD)
prob.pval[i] = pnorm(abs(x[nx+i] - forecast$pred[i]) / locSD)
}
perf.mape[1] = abs(perf.pe[1])
perf.mse[1] = abs(perf.se[1])
for (i in 2:fx) {
perf.mape[i] = perf.mape[i-1] + abs(perf.pe[i])
perf.mape1[i] = perf.mape[i] / i
perf.mse[i] = perf.mse[i-1] + perf.se[i]
perf.mse1[i] = perf.mse[i] / i
}
perf.rmse = sqrt(perf.mse1)
bitmap(file='test2.png')
plot(forecast$pred, pch=19, type='b',main='ARIMA Extrapolation Forecast', ylab='Forecast and 95% CI', xlab='time',ylim=c(min(lb),max(ub)))
dum <- forecast$pred
dum[1:par1] <- x[(nx+1):lx]
lines(dum, lty=1)
lines(ub,lty=3)
lines(lb,lty=3)
dev.off()
load(file='createtable')
a<-table.start()
a<-table.row.start(a)
a<-table.element(a,'Univariate ARIMA Extrapolation Forecast',9,TRUE)
a<-table.row.end(a)
a<-table.row.start(a)
a<-table.element(a,'time',1,header=TRUE)
a<-table.element(a,'Y[t]',1,header=TRUE)
a<-table.element(a,'F[t]',1,header=TRUE)
a<-table.element(a,'95% LB',1,header=TRUE)
a<-table.element(a,'95% UB',1,header=TRUE)
a<-table.element(a,'p-value
(H0: Y[t] = F[t])',1,header=TRUE)
a<-table.element(a,'P(F[t]>Y[t-1])',1,header=TRUE)
a<-table.element(a,'P(F[t]>Y[t-s])',1,header=TRUE)
mylab <- paste('P(F[t]>Y[',nx,sep='')
mylab <- paste(mylab,'])',sep='')
a<-table.element(a,mylab,1,header=TRUE)
a<-table.row.end(a)
for (i in (nx-par5):nx) {
a<-table.row.start(a)
a<-table.element(a,i,header=TRUE)
a<-table.element(a,x[i])
a<-table.element(a,'-')
a<-table.row.end(a)
}
for (i in 1:fx) {
a<-table.row.start(a)
a<-table.element(a,nx+i,header=TRUE)
a<-table.element(a,round(x[nx+i],4))
a<-table.element(a,round(forecast$pred[i],4))
a<-table.element(a,round(lb[i],4))
a<-table.element(a,round(ub[i],4))
a<-table.element(a,round((1-prob.pval[i]),4))
a<-table.element(a,round((1-prob.dec[i]),4))
a<-table.element(a,round((1-prob.sdec[i]),4))
a<-table.element(a,round((1-prob.ldec[i]),4))
a<-table.row.end(a)
}
a<-table.end(a)
table.save(a,file='mytable.tab')
a<-table.start()
a<-table.row.start(a)
a<-table.element(a,'Univariate ARIMA Extrapolation Forecast Performance',7,TRUE)
a<-table.row.end(a)
a<-table.row.start(a)
a<-table.element(a,'time',1,header=TRUE)
a<-table.element(a,'% S.E.',1,header=TRUE)
a<-table.element(a,'PE',1,header=TRUE)
a<-table.element(a,'MAPE',1,header=TRUE)
a<-table.element(a,'Sq.E',1,header=TRUE)
a<-table.element(a,'MSE',1,header=TRUE)
a<-table.element(a,'RMSE',1,header=TRUE)
a<-table.row.end(a)
for (i in 1:fx) {
a<-table.row.start(a)
a<-table.element(a,nx+i,header=TRUE)
a<-table.element(a,round(perc.se[i],4))
a<-table.element(a,round(perf.pe[i],4))
a<-table.element(a,round(perf.mape1[i],4))
a<-table.element(a,round(perf.se[i],4))
a<-table.element(a,round(perf.mse1[i],4))
a<-table.element(a,round(perf.rmse[i],4))
a<-table.row.end(a)
}
a<-table.end(a)
table.save(a,file='mytable1.tab')