| Multiple Linear Regression - Estimated Regression Equation |
| indicator[t] = + 0.269947045983855 + 0.258970092398895economical[t] -0.254850177345353unemployement[t] + 0.237994998300893financial[t] + 0.225051492669513capacity[t] + e[t] |
| Multiple Linear Regression - Ordinary Least Squares | |||||
| Variable | Parameter | S.D. | T-STAT H0: parameter = 0 | 2-tail p-value | 1-tail p-value |
| (Intercept) | 0.269947045983855 | 0.130103 | 2.0749 | 0.043746 | 0.021873 |
| economical | 0.258970092398895 | 0.006928 | 37.3812 | 0 | 0 |
| unemployement | -0.254850177345353 | 0.002067 | -123.3205 | 0 | 0 |
| financial | 0.237994998300893 | 0.034249 | 6.9489 | 0 | 0 |
| capacity | 0.225051492669513 | 0.017251 | 13.0461 | 0 | 0 |
| Multiple Linear Regression - Regression Statistics | |
| Multiple R | 0.999221162082563 |
| R-squared | 0.998442930753627 |
| Adjusted R-squared | 0.998304524598394 |
| F-TEST (value) | 7213.86219472357 |
| F-TEST (DF numerator) | 4 |
| F-TEST (DF denominator) | 45 |
| p-value | 0 |
| Multiple Linear Regression - Residual Statistics | |
| Residual Standard Deviation | 0.320567936851966 |
| Sum Squared Residuals | 4.62437109618868 |
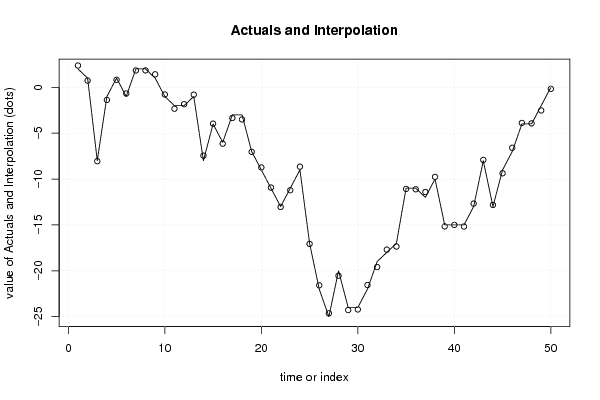
| Multiple Linear Regression - Actuals, Interpolation, and Residuals | |||
| Time or Index | Actuals | Interpolation Forecast | Residuals Prediction Error |
| 1 | 2 | 2.37209327422117 | -0.372093274221165 |
| 2 | 1 | 0.73301554112935 | 0.26698445887065 |
| 3 | -8 | -8.05445410470899 | 0.054454104708986 |
| 4 | -1 | -1.37774299214578 | 0.377742992145784 |
| 5 | 1 | 0.817688959357037 | 0.182311040642963 |
| 6 | -1 | -0.677117986155409 | -0.322882013844591 |
| 7 | 2 | 1.83710862901399 | 0.162891370986010 |
| 8 | 2 | 1.84532949884553 | 0.154670501154466 |
| 9 | 1 | 1.41620160760451 | -0.416201607604511 |
| 10 | -1 | -0.783558500592313 | -0.216441499407687 |
| 11 | -2 | -2.33700353615539 | 0.337003536155393 |
| 12 | -2 | -1.84415836050915 | -0.155841639490853 |
| 13 | -1 | -0.803782557029731 | -0.196217442970269 |
| 14 | -8 | -7.44934122651021 | -0.550658773489789 |
| 15 | -4 | -3.96297048642599 | -0.0370295135740053 |
| 16 | -6 | -6.14175550052481 | 0.141755500524815 |
| 17 | -3 | -3.3426907419693 | 0.342690741969302 |
| 18 | -3 | -3.50502519398527 | 0.505025193985268 |
| 19 | -7 | -7.03784155614932 | 0.0378415561493239 |
| 20 | -9 | -8.7406555339219 | -0.259344466078099 |
| 21 | -11 | -10.9278886197683 | -0.072111380231732 |
| 22 | -13 | -13.0425588264565 | 0.0425588264564821 |
| 23 | -11 | -11.2213201079167 | 0.221320107916668 |
| 24 | -9 | -8.6520294778305 | -0.347970522169498 |
| 25 | -17 | -17.0662272494558 | 0.0662272494557975 |
| 26 | -22 | -21.5809895666891 | -0.419010433310902 |
| 27 | -25 | -24.6346962609495 | -0.365303739050497 |
| 28 | -20 | -20.5411755195053 | 0.541175519505344 |
| 29 | -24 | -24.2823964369349 | 0.282396436934915 |
| 30 | -24 | -24.2147674791166 | 0.214767479116610 |
| 31 | -22 | -21.5523174385041 | -0.447682561495867 |
| 32 | -19 | -19.5944640020213 | 0.594464002021282 |
| 33 | -18 | -17.6964161765306 | -0.303583823469426 |
| 34 | -17 | -17.3570818623225 | 0.357081862322457 |
| 35 | -11 | -11.0804699542606 | 0.0804699542605642 |
| 36 | -11 | -11.1143885539899 | 0.114388553989947 |
| 37 | -12 | -11.4153088345848 | -0.58469116541515 |
| 38 | -10 | -9.76797231111041 | -0.232027688889588 |
| 39 | -15 | -15.1571135124852 | 0.157113512485171 |
| 40 | -15 | -14.9998992192744 | -0.000100780725575256 |
| 41 | -15 | -15.1741769331701 | 0.174176933170095 |
| 42 | -13 | -12.6768244573207 | -0.323175542679303 |
| 43 | -8 | -7.91580835140388 | -0.0841916485961194 |
| 44 | -13 | -12.8246723639335 | -0.175327636066517 |
| 45 | -9 | -9.3716364631079 | 0.371636463107894 |
| 46 | -7 | -6.59452808212652 | -0.40547191787348 |
| 47 | -4 | -3.88506761923899 | -0.114932380761012 |
| 48 | -4 | -3.931345964129 | -0.0686540358710028 |
| 49 | -2 | -2.52535131217332 | 0.525351312173321 |
| 50 | 0 | -0.164446277077129 | 0.164446277077129 |
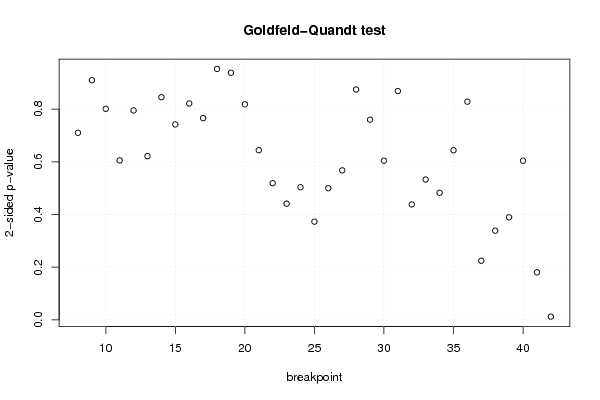
| Goldfeld-Quandt test for Heteroskedasticity | |||
| p-values | Alternative Hypothesis | ||
| breakpoint index | greater | 2-sided | less |
| 8 | 0.644922585115148 | 0.710154829769704 | 0.355077414884852 |
| 9 | 0.545098440173579 | 0.909803119652843 | 0.454901559826421 |
| 10 | 0.400563941026702 | 0.801127882053403 | 0.599436058973298 |
| 11 | 0.30276645209692 | 0.60553290419384 | 0.69723354790308 |
| 12 | 0.397501793811307 | 0.795003587622613 | 0.602498206188693 |
| 13 | 0.310790494435567 | 0.621580988871134 | 0.689209505564433 |
| 14 | 0.422543712515651 | 0.845087425031302 | 0.577456287484349 |
| 15 | 0.371004237089028 | 0.742008474178056 | 0.628995762910972 |
| 16 | 0.410694567715862 | 0.821389135431723 | 0.589305432284138 |
| 17 | 0.382973046128502 | 0.765946092257004 | 0.617026953871498 |
| 18 | 0.523771795549514 | 0.952456408900972 | 0.476228204450486 |
| 19 | 0.468988750195421 | 0.937977500390842 | 0.531011249804579 |
| 20 | 0.409142608127609 | 0.818285216255218 | 0.590857391872391 |
| 21 | 0.322064526931060 | 0.644129053862119 | 0.67793547306894 |
| 22 | 0.259511869974632 | 0.519023739949264 | 0.740488130025368 |
| 23 | 0.220623934032783 | 0.441247868065567 | 0.779376065967217 |
| 24 | 0.251822696887497 | 0.503645393774994 | 0.748177303112503 |
| 25 | 0.186515506192296 | 0.373031012384592 | 0.813484493807704 |
| 26 | 0.249876998617871 | 0.499753997235742 | 0.750123001382129 |
| 27 | 0.283794215004898 | 0.567588430009797 | 0.716205784995102 |
| 28 | 0.437177825175313 | 0.874355650350626 | 0.562822174824687 |
| 29 | 0.379974961154555 | 0.75994992230911 | 0.620025038845445 |
| 30 | 0.302112854250084 | 0.604225708500168 | 0.697887145749916 |
| 31 | 0.434300939786158 | 0.868601879572316 | 0.565699060213842 |
| 32 | 0.780793307805906 | 0.438413384388188 | 0.219206692194094 |
| 33 | 0.733573648549592 | 0.532852702900816 | 0.266426351450408 |
| 34 | 0.758671053373143 | 0.482657893253715 | 0.241328946626857 |
| 35 | 0.678022511974404 | 0.643954976051193 | 0.321977488025596 |
| 36 | 0.585853128864066 | 0.828293742271868 | 0.414146871135934 |
| 37 | 0.887675767353193 | 0.224648465293613 | 0.112324232646807 |
| 38 | 0.83069307115627 | 0.338613857687461 | 0.169306928843731 |
| 39 | 0.805188227301233 | 0.389623545397534 | 0.194811772698767 |
| 40 | 0.697897676456976 | 0.604204647086048 | 0.302102323543024 |
| 41 | 0.909672147988138 | 0.180655704023724 | 0.0903278520118622 |
| 42 | 0.993760731626018 | 0.0124785367479632 | 0.00623926837398161 |
| Meta Analysis of Goldfeld-Quandt test for Heteroskedasticity | |||
| Description | # significant tests | % significant tests | OK/NOK |
| 1% type I error level | 0 | 0 | OK |
| 5% type I error level | 1 | 0.0285714285714286 | OK |
| 10% type I error level | 1 | 0.0285714285714286 | OK |