| Multiple Linear Regression - Estimated Regression Equation |
| Y[t] = + 1.41071428571429 -0.818452380952382M1[t] -2.35476190476191M2[t] -8.8732142857143M3[t] -6.10952380952381M4[t] -5.59583333333334M5[t] -5.33214285714286M6[t] -3.56845238095238M7[t] -4.30476190476191M8[t] -3.54107142857143M9[t] -3.52738095238095M10[t] -0.763690476190479M11[t] -0.263690476190476t + e[t] |
| Multiple Linear Regression - Ordinary Least Squares | |||||
| Variable | Parameter | S.D. | T-STAT H0: parameter = 0 | 2-tail p-value | 1-tail p-value |
| (Intercept) | 1.41071428571429 | 4.374293 | 0.3225 | 0.748888 | 0.374444 |
| M1 | -0.818452380952382 | 5.051552 | -0.162 | 0.872172 | 0.436086 |
| M2 | -2.35476190476191 | 5.046566 | -0.4666 | 0.643517 | 0.321759 |
| M3 | -8.8732142857143 | 5.352691 | -1.6577 | 0.105832 | 0.052916 |
| M4 | -6.10952380952381 | 5.343799 | -1.1433 | 0.260261 | 0.13013 |
| M5 | -5.59583333333334 | 5.335941 | -1.0487 | 0.301116 | 0.150558 |
| M6 | -5.33214285714286 | 5.329121 | -1.0006 | 0.323535 | 0.161768 |
| M7 | -3.56845238095238 | 5.323344 | -0.6703 | 0.506804 | 0.253402 |
| M8 | -4.30476190476191 | 5.318612 | -0.8094 | 0.423473 | 0.211736 |
| M9 | -3.54107142857143 | 5.314929 | -0.6662 | 0.509384 | 0.254692 |
| M10 | -3.52738095238095 | 5.312297 | -0.664 | 0.510805 | 0.255403 |
| M11 | -0.763690476190479 | 5.310717 | -0.1438 | 0.886437 | 0.443219 |
| t | -0.263690476190476 | 0.074799 | -3.5253 | 0.001146 | 0.000573 |
| Multiple Linear Regression - Regression Statistics | |
| Multiple R | 0.545345495731066 |
| R-squared | 0.297401709714163 |
| Adjusted R-squared | 0.0695319939457829 |
| F-TEST (value) | 1.30513924902798 |
| F-TEST (DF numerator) | 12 |
| F-TEST (DF denominator) | 37 |
| p-value | 0.25689643837216 |
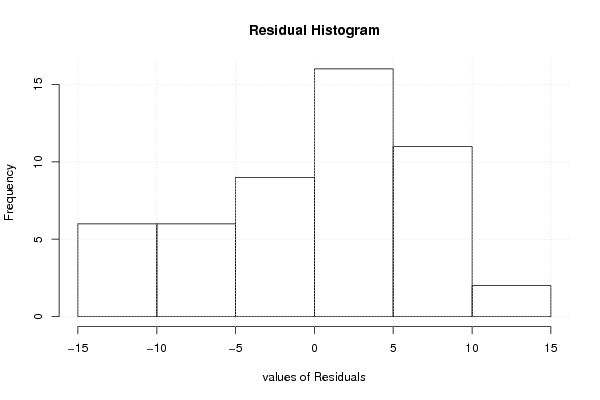
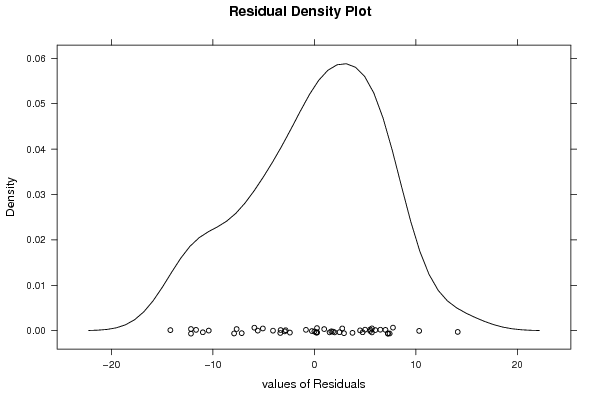
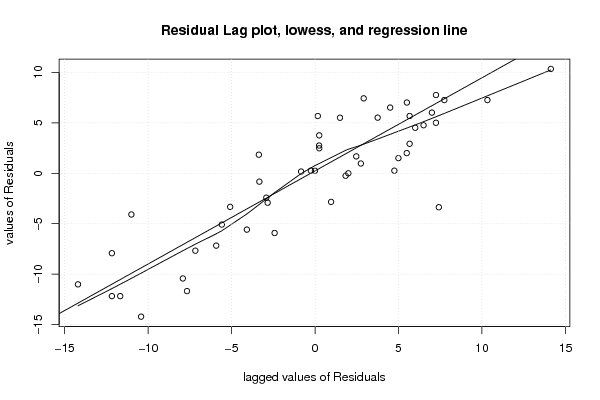
| Multiple Linear Regression - Residual Statistics | |
| Residual Standard Deviation | 7.50974270672674 |
| Sum Squared Residuals | 2086.66071428571 |
| Multiple Linear Regression - Actuals, Interpolation, and Residuals | |||
| Time or Index | Actuals | Interpolation Forecast | Residuals Prediction Error |
| 1 | 2 | 0.328571428571431 | 1.67142857142857 |
| 2 | 1 | -1.47142857142857 | 2.47142857142857 |
| 3 | -8 | -8.25357142857143 | 0.253571428571429 |
| 4 | -1 | -5.75357142857143 | 4.75357142857143 |
| 5 | 1 | -5.50357142857142 | 6.50357142857142 |
| 6 | -1 | -5.50357142857143 | 4.50357142857143 |
| 7 | 2 | -4.00357142857143 | 6.00357142857143 |
| 8 | 2 | -5.00357142857143 | 7.00357142857143 |
| 9 | 1 | -4.50357142857143 | 5.50357142857143 |
| 10 | -1 | -4.75357142857143 | 3.75357142857143 |
| 11 | -2 | -2.25357142857143 | 0.253571428571429 |
| 12 | -2 | -1.75357142857143 | -0.246428571428573 |
| 13 | -1 | -2.83571428571429 | 1.83571428571429 |
| 14 | -8 | -4.63571428571429 | -3.36428571428571 |
| 15 | -4 | -11.4178571428571 | 7.41785714285714 |
| 16 | -6 | -8.91785714285714 | 2.91785714285714 |
| 17 | -3 | -8.66785714285714 | 5.66785714285714 |
| 18 | -3 | -8.66785714285714 | 5.66785714285714 |
| 19 | -7 | -7.16785714285714 | 0.167857142857144 |
| 20 | -9 | -8.16785714285714 | -0.832142857142856 |
| 21 | -11 | -7.66785714285714 | -3.33214285714286 |
| 22 | -13 | -7.91785714285714 | -5.08214285714286 |
| 23 | -11 | -5.41785714285714 | -5.58214285714286 |
| 24 | -9 | -4.91785714285715 | -4.08214285714285 |
| 25 | -17 | -6 | -11 |
| 26 | -22 | -7.8 | -14.2 |
| 27 | -25 | -14.5821428571429 | -10.4178571428571 |
| 28 | -20 | -12.0821428571429 | -7.91785714285714 |
| 29 | -24 | -11.8321428571429 | -12.1678571428571 |
| 30 | -24 | -11.8321428571429 | -12.1678571428571 |
| 31 | -22 | -10.3321428571429 | -11.6678571428571 |
| 32 | -19 | -11.3321428571429 | -7.66785714285714 |
| 33 | -18 | -10.8321428571429 | -7.16785714285714 |
| 34 | -17 | -11.0821428571429 | -5.91785714285714 |
| 35 | -11 | -8.58214285714286 | -2.41785714285714 |
| 36 | -11 | -8.08214285714286 | -2.91785714285714 |
| 37 | -12 | -9.16428571428571 | -2.83571428571428 |
| 38 | -10 | -10.9642857142857 | 0.964285714285713 |
| 39 | -15 | -17.7464285714286 | 2.74642857142857 |
| 40 | -15 | -15.2464285714286 | 0.246428571428571 |
| 41 | -15 | -14.9964285714286 | -0.00357142857142653 |
| 42 | -13 | -14.9964285714286 | 1.99642857142857 |
| 43 | -8 | -13.4964285714286 | 5.49642857142857 |
| 44 | -13 | -14.4964285714286 | 1.49642857142857 |
| 45 | -9 | -13.9964285714286 | 4.99642857142857 |
| 46 | -7 | -14.2464285714286 | 7.24642857142857 |
| 47 | -4 | -11.7464285714286 | 7.74642857142857 |
| 48 | -4 | -11.2464285714286 | 7.24642857142857 |
| 49 | -2 | -12.3285714285714 | 10.3285714285714 |
| 50 | 0 | -14.1285714285714 | 14.1285714285714 |
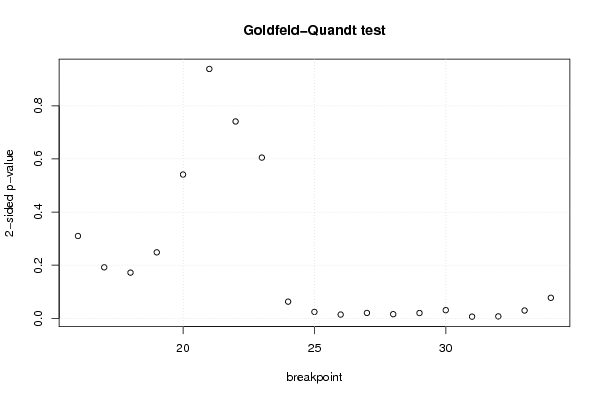
| Goldfeld-Quandt test for Heteroskedasticity | |||
| p-values | Alternative Hypothesis | ||
| breakpoint index | greater | 2-sided | less |
| 16 | 0.154979056687285 | 0.309958113374571 | 0.845020943312715 |
| 17 | 0.0960554407884942 | 0.192110881576988 | 0.903944559211506 |
| 18 | 0.0860617341484417 | 0.172123468296883 | 0.913938265851558 |
| 19 | 0.124215382977149 | 0.248430765954299 | 0.87578461702285 |
| 20 | 0.270625499793064 | 0.541250999586127 | 0.729374500206936 |
| 21 | 0.469283175465743 | 0.938566350931486 | 0.530716824534257 |
| 22 | 0.629543995244992 | 0.740912009510015 | 0.370456004755007 |
| 23 | 0.697478875202713 | 0.605042249594574 | 0.302521124797287 |
| 24 | 0.968541570407875 | 0.0629168591842495 | 0.0314584295921247 |
| 25 | 0.987843532197245 | 0.0243129356055102 | 0.0121564678027551 |
| 26 | 0.992863457447548 | 0.0142730851049049 | 0.00713654255245246 |
| 27 | 0.98981362968816 | 0.0203727406236802 | 0.0101863703118401 |
| 28 | 0.99216182673301 | 0.0156763465339789 | 0.00783817326698943 |
| 29 | 0.989965460147412 | 0.0200690797051759 | 0.010034539852588 |
| 30 | 0.984605619490446 | 0.0307887610191088 | 0.0153943805095544 |
| 31 | 0.996790596883396 | 0.00641880623320735 | 0.00320940311660368 |
| 32 | 0.996280488280457 | 0.00743902343908557 | 0.00371951171954278 |
| 33 | 0.98523135347134 | 0.0295372930573208 | 0.0147686465286604 |
| 34 | 0.961301295853014 | 0.0773974082939718 | 0.0386987041469859 |
| Meta Analysis of Goldfeld-Quandt test for Heteroskedasticity | |||
| Description | # significant tests | % significant tests | OK/NOK |
| 1% type I error level | 2 | 0.105263157894737 | NOK |
| 5% type I error level | 9 | 0.473684210526316 | NOK |
| 10% type I error level | 11 | 0.578947368421053 | NOK |