| Multiple Linear Regression - Estimated Regression Equation |
| PS[t] = + 3.87981407295822 + 0.020765785908446SWS[t] -0.0231142531223470L[t] + 0.00244205751433088Wb[t] + 0.0018345999329572Wbr[t] -0.00728851229481563Tg[t] + 0.75342769278963P[t] + 0.379291376975431S[t] -1.58459751852480D[t] + e[t] |
| Multiple Linear Regression - Ordinary Least Squares | |||||
| Variable | Parameter | S.D. | T-STAT H0: parameter = 0 | 2-tail p-value | 1-tail p-value |
| (Intercept) | 3.87981407295822 | 0.805439 | 4.817 | 3.9e-05 | 2e-05 |
| SWS | 0.020765785908446 | 0.059249 | 0.3505 | 0.728425 | 0.364212 |
| L | -0.0231142531223470 | 0.024253 | -0.953 | 0.348187 | 0.174093 |
| Wb | 0.00244205751433088 | 0.000649 | 3.7649 | 0.000725 | 0.000363 |
| Wbr | 0.0018345999329572 | 0.001676 | 1.0946 | 0.282384 | 0.141192 |
| Tg | -0.00728851229481563 | 0.002302 | -3.1667 | 0.003528 | 0.001764 |
| P | 0.75342769278963 | 0.353211 | 2.1331 | 0.041215 | 0.020608 |
| S | 0.379291376975431 | 0.198421 | 1.9115 | 0.065529 | 0.032764 |
| D | -1.58459751852480 | 0.426891 | -3.712 | 0.000837 | 0.000419 |
| Multiple Linear Regression - Regression Statistics | |
| Multiple R | 0.834058740370982 |
| R-squared | 0.69565398238923 |
| Adjusted R-squared | 0.61449504435969 |
| F-TEST (value) | 8.5715017874684 |
| F-TEST (DF numerator) | 8 |
| F-TEST (DF denominator) | 30 |
| p-value | 5.31320069963037e-06 |
| Multiple Linear Regression - Residual Statistics | |
| Residual Standard Deviation | 0.872708087478808 |
| Sum Squared Residuals | 22.8485821785276 |
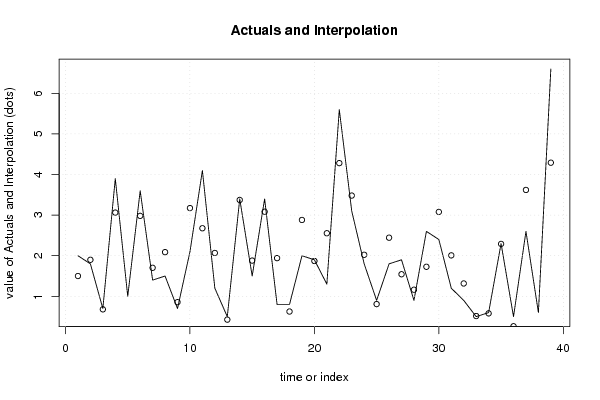
| Multiple Linear Regression - Actuals, Interpolation, and Residuals | |||
| Time or Index | Actuals | Interpolation Forecast | Residuals Prediction Error |
| 1 | 2 | 1.50083918559037 | 0.49916081440963 |
| 2 | 1.8 | 1.90041716112323 | -0.100417161123231 |
| 3 | 0.7 | 0.680326277057928 | 0.0196737229420718 |
| 4 | 3.9 | 3.0623728492115 | 0.837627150788498 |
| 5 | 1 | -0.299419781905775 | 1.29941978190577 |
| 6 | 3.6 | 2.98222325365787 | 0.617776746342134 |
| 7 | 1.4 | 1.7028228537623 | -0.302822853762302 |
| 8 | 1.5 | 2.08881778084052 | -0.588817780840516 |
| 9 | 0.7 | 0.856965311357678 | -0.156965311357678 |
| 10 | 2.1 | 3.17412734734434 | -1.07412734734434 |
| 11 | 4.1 | 2.67664644223224 | 1.42335355776776 |
| 12 | 1.2 | 2.06798384488634 | -0.867983844886338 |
| 13 | 0.5 | 0.426490343714188 | 0.0735096562858118 |
| 14 | 3.4 | 3.37398299918631 | 0.0260170008136889 |
| 15 | 1.5 | 1.88081424943918 | -0.380814249439178 |
| 16 | 3.4 | 3.08389395694004 | 0.316106043059960 |
| 17 | 0.8 | 1.94144628912481 | -1.14144628912481 |
| 18 | 0.8 | 0.625809125934577 | 0.174190874065423 |
| 19 | 2 | 2.88095857284094 | -0.880958572840935 |
| 20 | 1.9 | 1.87022830068154 | 0.0297716993184553 |
| 21 | 1.3 | 2.55447918153127 | -1.25447918153127 |
| 22 | 5.6 | 4.28060722672713 | 1.31939277327287 |
| 23 | 3.1 | 3.48181081538185 | -0.381810815381849 |
| 24 | 1.8 | 2.02354284907248 | -0.223542849072476 |
| 25 | 0.9 | 0.809402701247024 | 0.090597298752976 |
| 26 | 1.8 | 2.44435922358036 | -0.644359223580361 |
| 27 | 1.9 | 1.54411716880080 | 0.355882831199198 |
| 28 | 0.9 | 1.16283550909251 | -0.262835509092515 |
| 29 | 2.6 | 1.72818707146813 | 0.871812928531874 |
| 30 | 2.4 | 3.0788860701858 | -0.678886070185799 |
| 31 | 1.2 | 2.00915117624407 | -0.809151176244073 |
| 32 | 0.9 | 1.31710423923805 | -0.417104239238050 |
| 33 | 0.5 | 0.515356921231035 | -0.0153569212310355 |
| 34 | 0.6 | 0.5806111054153 | 0.0193888945846996 |
| 35 | 2.3 | 2.29083237830530 | 0.00916762169470471 |
| 36 | 0.5 | 0.263738660502818 | 0.236261339497182 |
| 37 | 2.6 | 3.61999936829082 | -1.01999936829082 |
| 38 | 0.6 | -0.074253615495307 | 0.674253615495307 |
| 39 | 6.6 | 4.29148558616045 | 2.30851441383955 |
| Goldfeld-Quandt test for Heteroskedasticity | |||
| p-values | Alternative Hypothesis | ||
| breakpoint index | greater | 2-sided | less |
| 12 | 0.849129987712225 | 0.30174002457555 | 0.150870012287775 |
| 13 | 0.784548359071969 | 0.430903281856063 | 0.215451640928031 |
| 14 | 0.693993928115327 | 0.612012143769345 | 0.306006071884673 |
| 15 | 0.560124686502413 | 0.879750626995173 | 0.439875313497587 |
| 16 | 0.445538319285569 | 0.891076638571137 | 0.554461680714431 |
| 17 | 0.493616486118088 | 0.987232972236175 | 0.506383513881912 |
| 18 | 0.401840510452526 | 0.803681020905052 | 0.598159489547474 |
| 19 | 0.371824824868421 | 0.743649649736843 | 0.628175175131579 |
| 20 | 0.263462758158438 | 0.526925516316876 | 0.736537241841562 |
| 21 | 0.438142707807672 | 0.876285415615344 | 0.561857292192328 |
| 22 | 0.50501184021702 | 0.98997631956596 | 0.49498815978298 |
| 23 | 0.43969661046852 | 0.87939322093704 | 0.56030338953148 |
| 24 | 0.314035745144572 | 0.628071490289144 | 0.685964254855428 |
| 25 | 0.217089045744289 | 0.434178091488579 | 0.78291095425571 |
| 26 | 0.172008321016632 | 0.344016642033263 | 0.827991678983368 |
| 27 | 0.163111414772958 | 0.326222829545917 | 0.836888585227042 |
| Meta Analysis of Goldfeld-Quandt test for Heteroskedasticity | |||
| Description | # significant tests | % significant tests | OK/NOK |
| 1% type I error level | 0 | 0 | OK |
| 5% type I error level | 0 | 0 | OK |
| 10% type I error level | 0 | 0 | OK |