| Multiple Linear Regression - Estimated Regression Equation |
| SWS[t] = + 10.159192839145 + 0.196377251206113PS[t] + 0.167700232222084L[t] -0.00252017211183822Wb[t] -0.0130380091443741Wbr[t] -0.0110977222756284Tg[t] + 1.96413146308607P[t] -0.236194770841981S[t] -2.57506547044299D[t] + e[t] |
| Multiple Linear Regression - Ordinary Least Squares | |||||
| Variable | Parameter | S.D. | T-STAT H0: parameter = 0 | 2-tail p-value | 1-tail p-value |
| (Intercept) | 10.159192839145 | 2.727578 | 3.7246 | 0.000809 | 0.000404 |
| PS | 0.196377251206113 | 0.560304 | 0.3505 | 0.728425 | 0.364212 |
| L | 0.167700232222084 | 0.069236 | 2.4222 | 0.021681 | 0.01084 |
| Wb | -0.00252017211183822 | 0.002376 | -1.0605 | 0.297365 | 0.148683 |
| Wbr | -0.0130380091443741 | 0.004686 | -2.7824 | 0.009242 | 0.004621 |
| Tg | -0.0110977222756284 | 0.007921 | -1.4011 | 0.171442 | 0.085721 |
| P | 1.96413146308607 | 1.109124 | 1.7709 | 0.086741 | 0.04337 |
| S | -0.236194770841981 | 0.644834 | -0.3663 | 0.716721 | 0.358361 |
| D | -2.57506547044299 | 1.514544 | -1.7002 | 0.099435 | 0.049718 |
| Multiple Linear Regression - Regression Statistics | |
| Multiple R | 0.799322407636419 |
| R-squared | 0.638916311349681 |
| Adjusted R-squared | 0.542627327709597 |
| F-TEST (value) | 6.63540404308205 |
| F-TEST (DF numerator) | 8 |
| F-TEST (DF denominator) | 30 |
| p-value | 5.47931107992561e-05 |
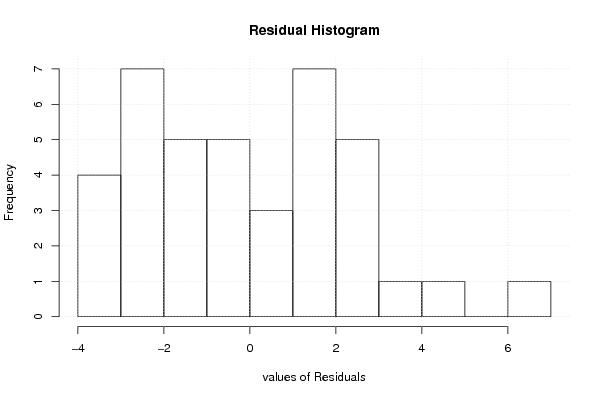
| Multiple Linear Regression - Residual Statistics | |
| Residual Standard Deviation | 2.68373977555082 |
| Sum Squared Residuals | 216.073775486207 |
| Multiple Linear Regression - Actuals, Interpolation, and Residuals | |||
| Time or Index | Actuals | Interpolation Forecast | Residuals Prediction Error |
| 1 | 6.3 | 8.68292622560274 | -2.38292622560274 |
| 2 | 2.1 | 2.57109809214742 | -0.471098092147423 |
| 3 | 9.1 | 7.07154760538176 | 2.02845239461824 |
| 4 | 15.8 | 12.8718501065206 | 2.92814989347937 |
| 5 | 5.2 | 4.8719890509252 | 0.328010949074804 |
| 6 | 10.9 | 13.4371877912348 | -2.53718779123482 |
| 7 | 8.3 | 9.55135149946622 | -1.25135149946622 |
| 8 | 11 | 8.8758174652573 | 2.1241825347427 |
| 9 | 3.2 | 1.28660213113068 | 1.91339786886932 |
| 10 | 6.3 | 9.82946814179818 | -3.52946814179818 |
| 11 | 6.6 | 9.76256770333525 | -3.16256770333525 |
| 12 | 9.5 | 9.04724964608454 | 0.452750353915459 |
| 13 | 3.3 | 6.16420030918574 | -2.86420030918574 |
| 14 | 11 | 11.7960710902343 | -0.79607109023429 |
| 15 | 4.7 | 8.1180884103041 | -3.4180884103041 |
| 16 | 10.4 | 13.8323009188255 | -3.43230091882553 |
| 17 | 7.4 | 9.57365238209706 | -2.17365238209706 |
| 18 | 2.1 | 0.213121086887343 | 1.88687891311266 |
| 19 | 17.9 | 13.1714533188997 | 4.72854668110032 |
| 20 | 6.1 | 6.12568947134552 | -0.0256894713455223 |
| 21 | 11.9 | 10.6301287881437 | 1.26987121185634 |
| 22 | 13.8 | 12.9948128743896 | 0.805187125610425 |
| 23 | 14.3 | 11.4936587379886 | 2.80634126201144 |
| 24 | 15.2 | 9.07383717864373 | 6.12616282135627 |
| 25 | 10 | 6.92377638374274 | 3.07622361625726 |
| 26 | 11.9 | 10.8933348628945 | 1.00666513710548 |
| 27 | 6.5 | 7.56474802047971 | -1.06474802047971 |
| 28 | 7.5 | 8.6081953209336 | -1.10819532093361 |
| 29 | 10.6 | 9.1304379574581 | 1.4695620425419 |
| 30 | 7.4 | 10.1819615915144 | -2.7819615915144 |
| 31 | 8.4 | 9.15673268738645 | -0.756732687386446 |
| 32 | 5.7 | 7.1563312808112 | -1.4563312808112 |
| 33 | 4.9 | 6.17853297067496 | -1.27853297067496 |
| 34 | 3.2 | 5.29810272722344 | -2.09810272722344 |
| 35 | 11 | 9.20541846114886 | 1.79458153885114 |
| 36 | 4.9 | 7.06118410167577 | -2.16118410167577 |
| 37 | 13.2 | 10.7820057876405 | 2.41799421235954 |
| 38 | 9.7 | 8.05221869184078 | 1.64778130815922 |
| 39 | 12.8 | 12.8603491287455 | -0.0603491287454527 |
| Goldfeld-Quandt test for Heteroskedasticity | |||
| p-values | Alternative Hypothesis | ||
| breakpoint index | greater | 2-sided | less |
| 12 | 0.736430807967872 | 0.527138384064256 | 0.263569192032128 |
| 13 | 0.74591607735424 | 0.508167845291519 | 0.25408392264576 |
| 14 | 0.642855259204747 | 0.714289481590506 | 0.357144740795253 |
| 15 | 0.662807836059582 | 0.674384327880836 | 0.337192163940418 |
| 16 | 0.73018416726245 | 0.5396316654751 | 0.26981583273755 |
| 17 | 0.673830499760094 | 0.652339000479812 | 0.326169500239906 |
| 18 | 0.624977975036904 | 0.750044049926193 | 0.375022024963096 |
| 19 | 0.733465353497235 | 0.533069293005529 | 0.266534646502765 |
| 20 | 0.644062283517123 | 0.711875432965754 | 0.355937716482877 |
| 21 | 0.540595968550608 | 0.918808062898783 | 0.459404031449392 |
| 22 | 0.462701234996967 | 0.925402469993934 | 0.537298765003033 |
| 23 | 0.408014893338772 | 0.816029786677543 | 0.591985106661228 |
| 24 | 0.786301557266715 | 0.427396885466569 | 0.213698442733285 |
| 25 | 0.86651969608885 | 0.266960607822299 | 0.13348030391115 |
| 26 | 0.749979777039937 | 0.500040445920126 | 0.250020222960063 |
| 27 | 0.592676258068509 | 0.814647483862983 | 0.407323741931491 |
| Meta Analysis of Goldfeld-Quandt test for Heteroskedasticity | |||
| Description | # significant tests | % significant tests | OK/NOK |
| 1% type I error level | 0 | 0 | OK |
| 5% type I error level | 0 | 0 | OK |
| 10% type I error level | 0 | 0 | OK |