| Multiple Linear Regression - Estimated Regression Equation |
| SWS[t] = -168.238334738895 -0.105212324281577Wb[t] -11.3714898112225D[t] + e[t] |
| Multiple Linear Regression - Ordinary Least Squares | |||||
| Variable | Parameter | S.D. | T-STAT H0: parameter = 0 | 2-tail p-value | 1-tail p-value |
| (Intercept) | -168.238334738895 | 111.19493 | -1.513 | 0.135617 | 0.067809 |
| Wb | -0.105212324281577 | 0.06038 | -1.7425 | 0.086629 | 0.043314 |
| D | -11.3714898112225 | 37.669184 | -0.3019 | 0.763807 | 0.381903 |
| Multiple Linear Regression - Regression Statistics | |
| Multiple R | 0.231053588405355 |
| R-squared | 0.0533857607149912 |
| Adjusted R-squared | 0.0212971424341436 |
| F-TEST (value) | 1.66369770888062 |
| F-TEST (DF numerator) | 2 |
| F-TEST (DF denominator) | 59 |
| p-value | 0.198200375520522 |
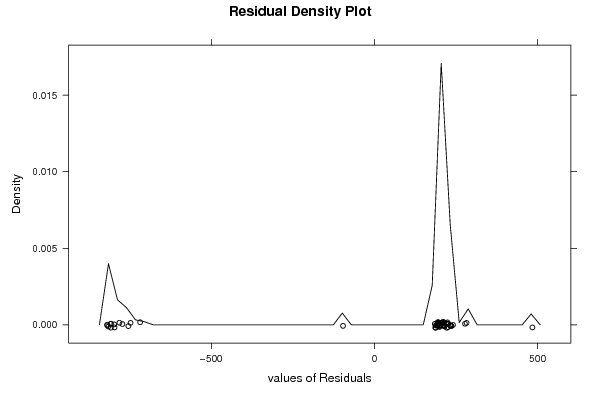
| Multiple Linear Regression - Residual Statistics | |
| Residual Standard Deviation | 420.224485599023 |
| Sum Squared Residuals | 10418728.4795209 |
| Multiple Linear Regression - Actuals, Interpolation, and Residuals | |||
| Time or Index | Actuals | Interpolation Forecast | Residuals Prediction Error |
| 1 | -999 | -902.435609942174 | -96.5643900578265 |
| 2 | 6.3 | -202.458016496845 | 208.758016496845 |
| 3 | -999 | -179.966494329433 | -819.033505670567 |
| 4 | -999 | -202.449599510902 | -796.550400489098 |
| 5 | 2.1 | -481.700083928961 | 483.800083928961 |
| 6 | 9.1 | -214.834284004956 | 223.934284004956 |
| 7 | 15.8 | -179.611928796604 | 195.411928796604 |
| 8 | 5.2 | -230.558265868838 | 235.758265868838 |
| 9 | 10.9 | -179.957025220247 | 190.857025220247 |
| 10 | 8.3 | -185.097699384645 | 193.397699384645 |
| 11 | 11 | -213.769535283227 | 224.769535283227 |
| 12 | 3.2 | -274.019514585941 | 277.219514585941 |
| 13 | 7.6 | -191.039181139695 | 198.639181139695 |
| 14 | -999 | -244.781009668091 | -754.218990331909 |
| 15 | 6.3 | -179.618241536060 | 185.918241536060 |
| 16 | 8.6 | -191.296951334185 | 199.896951334185 |
| 17 | 6.6 | -191.064432097523 | 197.664432097523 |
| 18 | 9.5 | -191.002356826197 | 200.502356826197 |
| 19 | 4.8 | -179.758173927355 | 184.558173927355 |
| 20 | 12 | -185.922564007013 | 197.922564007013 |
| 21 | -999 | -280.753103339962 | -718.246896660038 |
| 22 | 3.3 | -228.005956684637 | 231.305956684637 |
| 23 | 11 | -190.993939840254 | 201.993939840254 |
| 24 | -999 | -201.388775676404 | -797.611224323596 |
| 25 | 4.7 | -188.552872114052 | 193.252872114052 |
| 26 | -999 | -183.432188291268 | -815.567811708732 |
| 27 | 10.4 | -202.363325404991 | 212.763325404991 |
| 28 | 7.4 | -213.833714801038 | 221.233714801038 |
| 29 | 2.1 | -279.911404745709 | 282.011404745710 |
| 30 | -999 | -190.131056978276 | -808.868943021724 |
| 31 | -999 | -217.406725333641 | -781.593274666359 |
| 32 | 7.7 | -213.725346107028 | 221.425346107028 |
| 33 | 17.9 | -179.610876673361 | 197.510876673361 |
| 34 | 6.1 | -186.132988655576 | 192.232988655576 |
| 35 | 8.2 | -179.622450029032 | 187.822450029032 |
| 36 | 8.4 | -202.494840810343 | 210.894840810343 |
| 37 | 11.9 | -202.354908419049 | 214.254908419049 |
| 38 | 10.8 | -202.358064788777 | 213.158064788777 |
| 39 | 13.8 | -179.788685501397 | 193.588685501397 |
| 40 | 14.3 | -179.978067685103 | 194.278067685103 |
| 41 | -999 | -251.398864865402 | -747.601135134598 |
| 42 | 15.2 | -191.031816276996 | 206.231816276996 |
| 43 | 10 | -214.776417226601 | 224.776417226601 |
| 44 | 11.9 | -191.151758326677 | 203.051758326677 |
| 45 | 6.5 | -233.925060245848 | 240.425060245848 |
| 46 | 7.5 | -225.358814605712 | 232.858814605712 |
| 47 | -999 | -191.432675232509 | -807.567324767491 |
| 48 | 10.6 | -202.382263623362 | 212.982263623362 |
| 49 | 7.4 | -180.055924805072 | 187.455924805072 |
| 50 | 8.4 | -191.696758166455 | 200.096758166455 |
| 51 | 5.7 | -191.060223604552 | 196.760223604552 |
| 52 | 4.9 | -202.731568539977 | 207.631568539977 |
| 53 | -999 | -226.656082564104 | -772.343917435896 |
| 54 | 3.2 | -230.935067792636 | 234.135067792636 |
| 55 | -999 | -191.128611615335 | -807.871388384665 |
| 56 | 8.1 | -190.987627100797 | 199.087627100797 |
| 57 | 11 | -191.076005453194 | 202.076005453194 |
| 58 | 4.9 | -202.563228821126 | 207.463228821126 |
| 59 | 13.2 | -190.991835593769 | 204.191835593769 |
| 60 | 9.7 | -214.165133622525 | 223.865133622525 |
| 61 | 12.8 | -179.978067685103 | 192.778067685103 |
| 62 | -999 | -180.035934463458 | -818.964065536542 |
| Goldfeld-Quandt test for Heteroskedasticity | |||
| p-values | Alternative Hypothesis | ||
| breakpoint index | greater | 2-sided | less |
| 6 | 0.711145230095977 | 0.577709539808047 | 0.288854769904023 |
| 7 | 0.896604869158122 | 0.206790261683755 | 0.103395130841878 |
| 8 | 0.828495767110767 | 0.343008465778465 | 0.171504232889233 |
| 9 | 0.830562669923595 | 0.338874660152811 | 0.169437330076405 |
| 10 | 0.796964942807064 | 0.406070114385871 | 0.203035057192936 |
| 11 | 0.714213818280304 | 0.571572363439392 | 0.285786181719696 |
| 12 | 0.660164651936077 | 0.679670696127847 | 0.339835348063923 |
| 13 | 0.58694210326677 | 0.82611579346646 | 0.41305789673323 |
| 14 | 0.813189317906464 | 0.373621364187072 | 0.186810682093536 |
| 15 | 0.759578094628825 | 0.48084381074235 | 0.240421905371175 |
| 16 | 0.698083216855145 | 0.60383356628971 | 0.301916783144855 |
| 17 | 0.629978974213936 | 0.740042051572129 | 0.370021025786064 |
| 18 | 0.558259987265906 | 0.883480025468188 | 0.441740012734094 |
| 19 | 0.483704536093000 | 0.967409072185999 | 0.516295463907001 |
| 20 | 0.417234819222896 | 0.834469638445791 | 0.582765180777104 |
| 21 | 0.491675223707653 | 0.983350447415305 | 0.508324776292347 |
| 22 | 0.444993706275044 | 0.889987412550089 | 0.555006293724956 |
| 23 | 0.378424874851032 | 0.756849749702065 | 0.621575125148968 |
| 24 | 0.564650956414523 | 0.870698087170954 | 0.435349043585477 |
| 25 | 0.503584976914441 | 0.992830046171118 | 0.496415023085559 |
| 26 | 0.685801157139463 | 0.628397685721074 | 0.314198842860537 |
| 27 | 0.631450361503804 | 0.737099276992393 | 0.368549638496196 |
| 28 | 0.574694815139703 | 0.850610369720594 | 0.425305184860297 |
| 29 | 0.626488828085771 | 0.747022343828458 | 0.373511171914229 |
| 30 | 0.746367347901598 | 0.507265304196804 | 0.253632652098402 |
| 31 | 0.869828348500397 | 0.260343302999206 | 0.130171651499603 |
| 32 | 0.834093406759253 | 0.331813186481494 | 0.165906593240747 |
| 33 | 0.79341398651228 | 0.413172026975441 | 0.206586013487721 |
| 34 | 0.754515273345944 | 0.490969453308112 | 0.245484726654056 |
| 35 | 0.70223717569135 | 0.595525648617301 | 0.297762824308651 |
| 36 | 0.644347804120863 | 0.711304391758273 | 0.355652195879137 |
| 37 | 0.582839856221936 | 0.834320287556127 | 0.417160143778064 |
| 38 | 0.518777275269058 | 0.962445449461884 | 0.481222724730942 |
| 39 | 0.455586721097207 | 0.911173442194414 | 0.544413278902793 |
| 40 | 0.395106780661386 | 0.790213561322773 | 0.604893219338614 |
| 41 | 0.509724618172846 | 0.980550763654307 | 0.490275381827154 |
| 42 | 0.448419779305498 | 0.896839558610996 | 0.551580220694502 |
| 43 | 0.385612643492632 | 0.771225286985265 | 0.614387356507368 |
| 44 | 0.32775757766568 | 0.65551515533136 | 0.67224242233432 |
| 45 | 0.262390014163456 | 0.524780028326912 | 0.737609985836544 |
| 46 | 0.211249064061651 | 0.422498128123302 | 0.788750935938349 |
| 47 | 0.374801188662645 | 0.74960237732529 | 0.625198811337355 |
| 48 | 0.312273455900624 | 0.624546911801247 | 0.687726544099376 |
| 49 | 0.243595806115519 | 0.487191612231037 | 0.756404193884481 |
| 50 | 0.187575204587985 | 0.37515040917597 | 0.812424795412015 |
| 51 | 0.141737781669931 | 0.283475563339862 | 0.85826221833007 |
| 52 | 0.105822633533953 | 0.211645267067906 | 0.894177366466047 |
| 53 | 0.311656107810493 | 0.623312215620987 | 0.688343892189507 |
| 54 | 0.254086461396232 | 0.508172922792465 | 0.745913538603768 |
| 55 | 0.63992812209335 | 0.7201437558133 | 0.36007187790665 |
| 56 | 0.471633371430262 | 0.943266742860525 | 0.528366628569738 |
| Meta Analysis of Goldfeld-Quandt test for Heteroskedasticity | |||
| Description | # significant tests | % significant tests | OK/NOK |
| 1% type I error level | 0 | 0 | OK |
| 5% type I error level | 0 | 0 | OK |
| 10% type I error level | 0 | 0 | OK |