| Multiple Linear Regression - Estimated Regression Equation |
| Wb[t] = + 470.005627638751 -41.4557144307889SWS[t] + e[t] |
| Multiple Linear Regression - Ordinary Least Squares | |||||
| Variable | Parameter | S.D. | T-STAT H0: parameter = 0 | 2-tail p-value | 1-tail p-value |
| (Intercept) | 470.005627638751 | 151.60006 | 3.1003 | 0.003686 | 0.001843 |
| SWS | -41.4557144307889 | 15.85797 | -2.6142 | 0.01286 | 0.00643 |
| Multiple Linear Regression - Regression Statistics | |
| Multiple R | 0.39484929053506 |
| R-squared | 0.15590596223604 |
| Adjusted R-squared | 0.133092609864041 |
| F-TEST (value) | 6.83397861453272 |
| F-TEST (DF numerator) | 1 |
| F-TEST (DF denominator) | 37 |
| p-value | 0.0128604114657495 |
| Multiple Linear Regression - Residual Statistics | |
| Residual Standard Deviation | 387.922251135723 |
| Sum Squared Residuals | 5567895.89826966 |
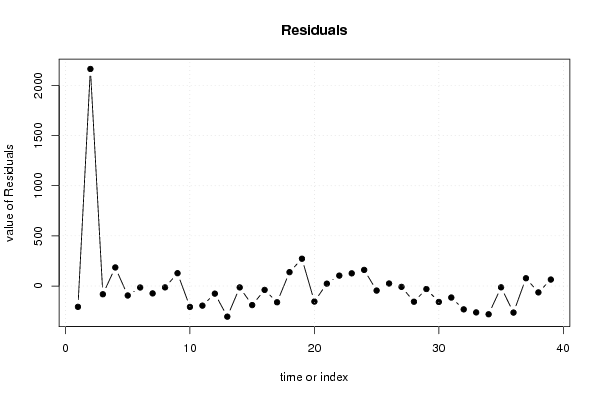
| Multiple Linear Regression - Actuals, Interpolation, and Residuals | |||
| Time or Index | Actuals | Interpolation Forecast | Residuals Prediction Error |
| 1 | 1 | 208.834626724781 | -207.834626724781 |
| 2 | 2547 | 382.948627334095 | 2164.05137266590 |
| 3 | 10.55 | 92.7586263185724 | -82.2086263185724 |
| 4 | 0.023 | -184.994660367713 | 185.017660367713 |
| 5 | 160 | 254.435912598649 | -94.4359125986492 |
| 6 | 3.3 | 18.1383403431523 | -14.8383403431523 |
| 7 | 52.16 | 125.923197863203 | -73.7631978632035 |
| 8 | 0.425 | 13.9927689000734 | -13.5677689000734 |
| 9 | 465 | 337.347341460227 | 127.652658539773 |
| 10 | 0.075 | 208.834626724781 | -208.759626724781 |
| 11 | 0.785 | 196.397912395545 | -195.612912395545 |
| 12 | 0.2 | 76.1763405462568 | -75.9763405462568 |
| 13 | 27.66 | 333.201770017148 | -305.541770017148 |
| 14 | 0.12 | 13.9927689000734 | -13.8727689000734 |
| 15 | 85 | 275.163769814044 | -190.163769814044 |
| 16 | 0.101 | 38.8661975585468 | -38.7651975585468 |
| 17 | 1.04 | 163.233340850914 | -162.193340850914 |
| 18 | 521 | 382.948627334095 | 138.051372665905 |
| 19 | 0.01 | -272.05166067237 | 272.06166067237 |
| 20 | 62 | 217.125769610939 | -155.125769610939 |
| 21 | 0.023 | -23.3173740876366 | 23.3403740876366 |
| 22 | 1.7 | -102.083231506136 | 103.783231506136 |
| 23 | 3.5 | -122.81108872153 | 126.31108872153 |
| 24 | 0.48 | -160.12123170924 | 160.60123170924 |
| 25 | 10 | 55.4484833308623 | -45.4484833308623 |
| 26 | 1.62 | -23.3173740876366 | 24.9373740876366 |
| 27 | 192 | 200.543483838624 | -8.54348383862357 |
| 28 | 2.5 | 159.087769407835 | -156.587769407835 |
| 29 | 0.28 | 30.575054672389 | -30.295054672389 |
| 30 | 4.235 | 163.233340850914 | -158.998340850914 |
| 31 | 6.8 | 121.777626420125 | -114.977626420125 |
| 32 | 0.75 | 233.708055383255 | -232.958055383255 |
| 33 | 3.6 | 266.872626927886 | -263.272626927886 |
| 34 | 55.5 | 337.347341460227 | -281.847341460227 |
| 35 | 0.9 | 13.9927689000734 | -13.0927689000734 |
| 36 | 2 | 266.872626927886 | -264.872626927886 |
| 37 | 0.104 | -77.2098028476622 | 77.3138028476622 |
| 38 | 4.19 | 67.885197660099 | -63.6951976600991 |
| 39 | 3.5 | -60.6275170753466 | 64.1275170753466 |
| Goldfeld-Quandt test for Heteroskedasticity | |||
| p-values | Alternative Hypothesis | ||
| breakpoint index | greater | 2-sided | less |
| 5 | 1 | 1.92237862468788e-15 | 9.61189312343939e-16 |
| 6 | 0.99999999999999 | 1.93216529735587e-14 | 9.66082648677936e-15 |
| 7 | 0.999999999999952 | 9.61809008221176e-14 | 4.80904504110588e-14 |
| 8 | 0.999999999999628 | 7.44699899762617e-13 | 3.72349949881309e-13 |
| 9 | 0.999999999999996 | 8.26323320225914e-15 | 4.13161660112957e-15 |
| 10 | 0.99999999999999 | 2.0275551897683e-14 | 1.01377759488415e-14 |
| 11 | 0.999999999999965 | 6.93158660963737e-14 | 3.46579330481869e-14 |
| 12 | 0.999999999999763 | 4.74982200516793e-13 | 2.37491100258397e-13 |
| 13 | 0.999999999999667 | 6.66345061726289e-13 | 3.33172530863145e-13 |
| 14 | 0.999999999997757 | 4.48541522058061e-12 | 2.24270761029030e-12 |
| 15 | 0.999999999990141 | 1.9717662923619e-11 | 9.8588314618095e-12 |
| 16 | 0.999999999940795 | 1.18410056561407e-10 | 5.92050282807035e-11 |
| 17 | 0.99999999974309 | 5.138222619807e-10 | 2.5691113099035e-10 |
| 18 | 1 | 9.93173982611917e-17 | 4.96586991305958e-17 |
| 19 | 1 | 7.35794737573535e-16 | 3.67897368786768e-16 |
| 20 | 0.999999999999997 | 6.79471249667602e-15 | 3.39735624833801e-15 |
| 21 | 0.999999999999958 | 8.42292286567837e-14 | 4.21146143283918e-14 |
| 22 | 0.999999999999518 | 9.63507971242547e-13 | 4.81753985621274e-13 |
| 23 | 0.999999999994861 | 1.02779667857782e-11 | 5.13898339288908e-12 |
| 24 | 0.999999999949248 | 1.01504724035973e-10 | 5.07523620179866e-11 |
| 25 | 0.999999999493426 | 1.01314866761583e-09 | 5.06574333807915e-10 |
| 26 | 0.999999995190026 | 9.61994709720845e-09 | 4.80997354860423e-09 |
| 27 | 0.99999999999996 | 8.05728612000054e-14 | 4.02864306000027e-14 |
| 28 | 0.999999999998832 | 2.33503097351607e-12 | 1.16751548675804e-12 |
| 29 | 0.99999999996305 | 7.39006255836931e-11 | 3.69503127918466e-11 |
| 30 | 0.999999999007473 | 1.98505481270092e-09 | 9.92527406350459e-10 |
| 31 | 0.99999997291718 | 5.41656405285878e-08 | 2.70828202642939e-08 |
| 32 | 0.999999537463621 | 9.25072757560109e-07 | 4.62536378780054e-07 |
| 33 | 0.999993619369053 | 1.27612618934690e-05 | 6.38063094673451e-06 |
| 34 | 0.999999851664638 | 2.96670723364357e-07 | 1.48335361682179e-07 |
| Meta Analysis of Goldfeld-Quandt test for Heteroskedasticity | |||
| Description | # significant tests | % significant tests | OK/NOK |
| 1% type I error level | 30 | 1 | NOK |
| 5% type I error level | 30 | 1 | NOK |
| 10% type I error level | 30 | 1 | NOK |