Free Statistics

of Irreproducible Research!

Author's title

Author*The author of this computation has been verified*
R Software Modulerwasp_multipleregression.wasp
Title produced by softwareMultiple Regression
Date of computationMon, 13 Dec 2010 10:56:49 +0000
Cite this page as followsStatistical Computations at FreeStatistics.org, Office for Research Development and Education, URL https://freestatistics.org/blog/index.php?v=date/2010/Dec/13/t1292238609ta02zsnrvw2bhxx.htm/, Retrieved Mon, 06 May 2024 11:53:16 +0000
Statistical Computations at FreeStatistics.org, Office for Research Development and Education, URL https://freestatistics.org/blog/index.php?pk=108846, Retrieved Mon, 06 May 2024 11:53:16 +0000
QR Codes:

Original text written by user:
IsPrivate?No (this computation is public)
User-defined keywords
Estimated Impact145
Family? (F = Feedback message, R = changed R code, M = changed R Module, P = changed Parameters, D = changed Data)
-     [Kendall tau Correlation Matrix] [Extra Ws, poging 2] [2010-12-12 12:49:13] [3635fb7041b1998c5a1332cf9de22bce]
-    D  [Kendall tau Correlation Matrix] [Extra workshop, 3...] [2010-12-12 14:12:35] [3635fb7041b1998c5a1332cf9de22bce]
-         [Kendall tau Correlation Matrix] [Extra WS Correlat...] [2010-12-12 14:21:59] [8081b8996d5947580de3eb171e82db4f]
- RMPD        [Multiple Regression] [Extra WS Multiple...] [2010-12-13 10:56:49] [4d0f7ea43b071af5c75b527ee1ef14c2] [Current]
-    D          [Multiple Regression] [Extra WS Multiple...] [2010-12-13 11:24:27] [8081b8996d5947580de3eb171e82db4f]
-    D            [Multiple Regression] [Extra WS Multiple...] [2010-12-13 11:29:25] [8081b8996d5947580de3eb171e82db4f]
-    D          [Multiple Regression] [Extra WS Multiple...] [2010-12-13 21:28:21] [8081b8996d5947580de3eb171e82db4f]
-    D            [Multiple Regression] [Extra WS Multiple...] [2010-12-13 21:59:12] [8081b8996d5947580de3eb171e82db4f]
-   PD          [Multiple Regression] [Science workshop] [2010-12-13 21:22:33] [3635fb7041b1998c5a1332cf9de22bce]
-    D            [Multiple Regression] [Artikel Science] [2010-12-13 21:59:45] [3635fb7041b1998c5a1332cf9de22bce]
-   PD          [Multiple Regression] [Extra ws, MLR, Wb...] [2010-12-13 21:36:00] [d946de7cca328fbcf207448a112523ab]
Feedback Forum

Post a new message
Dataseries X:
1.0	6.3
2547.0	2.1
10.55	9.1
0.023	15.8
160.0	5.2
3.3	10.9
52.16	8.3
0.425	11.0
465.0	3.2
0.075	6.3
0.785	6.6
0.2	9.5
27.66	3.3
0.12	11.0
85.0	4.7
0.101	10.4
1.04	7.4
521.0	2.1
0.01	17.9
62.0	6.1
0.023	11.9
1.7	13.8
3.5	14.3
0.48	15.2
10.0	10.0
1.62	11.9
192.0	6.5
2.5	7.5
0.28	10.6
4.235	7.4
6.8	8.4
0.75	5.7
3.6	4.9
55.5	3.2
0.9	11.0
2.0	4.9
0.104	13.2
4.19	9.7
3.5	12.8


Summary of computational transaction
Raw Inputview raw input (R code)
Raw Outputview raw output of R engine
Computing time7 seconds
R Server'Gwilym Jenkins' @ 72.249.127.135

\begin{tabular}{lllllllll}
\hline
Summary of computational transaction \tabularnewline
Raw Input & view raw input (R code)  \tabularnewline
Raw Output & view raw output of R engine  \tabularnewline
Computing time & 7 seconds \tabularnewline
R Server & 'Gwilym Jenkins' @ 72.249.127.135 \tabularnewline
\hline
\end{tabular}
%Source: https://freestatistics.org/blog/index.php?pk=108846&T=0

[TABLE]
[ROW][C]Summary of computational transaction[/C][/ROW]
[ROW][C]Raw Input[/C][C]view raw input (R code) [/C][/ROW]
[ROW][C]Raw Output[/C][C]view raw output of R engine [/C][/ROW]
[ROW][C]Computing time[/C][C]7 seconds[/C][/ROW]
[ROW][C]R Server[/C][C]'Gwilym Jenkins' @ 72.249.127.135[/C][/ROW]
[/TABLE]
Source: https://freestatistics.org/blog/index.php?pk=108846&T=0

Globally Unique Identifier (entire table): ba.freestatistics.org/blog/index.php?pk=108846&T=0

As an alternative you can also use a QR Code:  

The GUIDs for individual cells are displayed in the table below:

Summary of computational transaction
Raw Inputview raw input (R code)
Raw Outputview raw output of R engine
Computing time7 seconds
R Server'Gwilym Jenkins' @ 72.249.127.135


Multiple Linear Regression - Estimated Regression Equation
Wb[t] = + 470.005627638751 -41.4557144307889SWS[t] + e[t]

\begin{tabular}{lllllllll}
\hline
Multiple Linear Regression - Estimated Regression Equation \tabularnewline
Wb[t] =  +  470.005627638751 -41.4557144307889SWS[t]  + e[t] \tabularnewline
\hline
\end{tabular}
%Source: https://freestatistics.org/blog/index.php?pk=108846&T=1

[TABLE]
[ROW][C]Multiple Linear Regression - Estimated Regression Equation[/C][/ROW]
[ROW][C]Wb[t] =  +  470.005627638751 -41.4557144307889SWS[t]  + e[t][/C][/ROW]
[/TABLE]
Source: https://freestatistics.org/blog/index.php?pk=108846&T=1

Globally Unique Identifier (entire table): ba.freestatistics.org/blog/index.php?pk=108846&T=1

As an alternative you can also use a QR Code:  

The GUIDs for individual cells are displayed in the table below:

Multiple Linear Regression - Estimated Regression Equation
Wb[t] = + 470.005627638751 -41.4557144307889SWS[t] + e[t]


Multiple Linear Regression - Ordinary Least Squares
VariableParameterS.D.T-STATH0: parameter = 02-tail p-value1-tail p-value
(Intercept)470.005627638751151.600063.10030.0036860.001843
SWS-41.455714430788915.85797-2.61420.012860.00643

\begin{tabular}{lllllllll}
\hline
Multiple Linear Regression - Ordinary Least Squares \tabularnewline
Variable & Parameter & S.D. & T-STATH0: parameter = 0 & 2-tail p-value & 1-tail p-value \tabularnewline
(Intercept) & 470.005627638751 & 151.60006 & 3.1003 & 0.003686 & 0.001843 \tabularnewline
SWS & -41.4557144307889 & 15.85797 & -2.6142 & 0.01286 & 0.00643 \tabularnewline
\hline
\end{tabular}
%Source: https://freestatistics.org/blog/index.php?pk=108846&T=2

[TABLE]
[ROW][C]Multiple Linear Regression - Ordinary Least Squares[/C][/ROW]
[ROW][C]Variable[/C][C]Parameter[/C][C]S.D.[/C][C]T-STATH0: parameter = 0[/C][C]2-tail p-value[/C][C]1-tail p-value[/C][/ROW]
[ROW][C](Intercept)[/C][C]470.005627638751[/C][C]151.60006[/C][C]3.1003[/C][C]0.003686[/C][C]0.001843[/C][/ROW]
[ROW][C]SWS[/C][C]-41.4557144307889[/C][C]15.85797[/C][C]-2.6142[/C][C]0.01286[/C][C]0.00643[/C][/ROW]
[/TABLE]
Source: https://freestatistics.org/blog/index.php?pk=108846&T=2

Globally Unique Identifier (entire table): ba.freestatistics.org/blog/index.php?pk=108846&T=2

As an alternative you can also use a QR Code:  

The GUIDs for individual cells are displayed in the table below:

Multiple Linear Regression - Ordinary Least Squares
VariableParameterS.D.T-STATH0: parameter = 02-tail p-value1-tail p-value
(Intercept)470.005627638751151.600063.10030.0036860.001843
SWS-41.455714430788915.85797-2.61420.012860.00643


Multiple Linear Regression - Regression Statistics
Multiple R0.39484929053506
R-squared0.15590596223604
Adjusted R-squared0.133092609864041
F-TEST (value)6.83397861453272
F-TEST (DF numerator)1
F-TEST (DF denominator)37
p-value0.0128604114657495
Multiple Linear Regression - Residual Statistics
Residual Standard Deviation387.922251135723
Sum Squared Residuals5567895.89826966

\begin{tabular}{lllllllll}
\hline
Multiple Linear Regression - Regression Statistics \tabularnewline
Multiple R & 0.39484929053506 \tabularnewline
R-squared & 0.15590596223604 \tabularnewline
Adjusted R-squared & 0.133092609864041 \tabularnewline
F-TEST (value) & 6.83397861453272 \tabularnewline
F-TEST (DF numerator) & 1 \tabularnewline
F-TEST (DF denominator) & 37 \tabularnewline
p-value & 0.0128604114657495 \tabularnewline
Multiple Linear Regression - Residual Statistics \tabularnewline
Residual Standard Deviation & 387.922251135723 \tabularnewline
Sum Squared Residuals & 5567895.89826966 \tabularnewline
\hline
\end{tabular}
%Source: https://freestatistics.org/blog/index.php?pk=108846&T=3

[TABLE]
[ROW][C]Multiple Linear Regression - Regression Statistics[/C][/ROW]
[ROW][C]Multiple R[/C][C]0.39484929053506[/C][/ROW]
[ROW][C]R-squared[/C][C]0.15590596223604[/C][/ROW]
[ROW][C]Adjusted R-squared[/C][C]0.133092609864041[/C][/ROW]
[ROW][C]F-TEST (value)[/C][C]6.83397861453272[/C][/ROW]
[ROW][C]F-TEST (DF numerator)[/C][C]1[/C][/ROW]
[ROW][C]F-TEST (DF denominator)[/C][C]37[/C][/ROW]
[ROW][C]p-value[/C][C]0.0128604114657495[/C][/ROW]
[ROW][C]Multiple Linear Regression - Residual Statistics[/C][/ROW]
[ROW][C]Residual Standard Deviation[/C][C]387.922251135723[/C][/ROW]
[ROW][C]Sum Squared Residuals[/C][C]5567895.89826966[/C][/ROW]
[/TABLE]
Source: https://freestatistics.org/blog/index.php?pk=108846&T=3

Globally Unique Identifier (entire table): ba.freestatistics.org/blog/index.php?pk=108846&T=3

As an alternative you can also use a QR Code:  

The GUIDs for individual cells are displayed in the table below:

Multiple Linear Regression - Regression Statistics
Multiple R0.39484929053506
R-squared0.15590596223604
Adjusted R-squared0.133092609864041
F-TEST (value)6.83397861453272
F-TEST (DF numerator)1
F-TEST (DF denominator)37
p-value0.0128604114657495
Multiple Linear Regression - Residual Statistics
Residual Standard Deviation387.922251135723
Sum Squared Residuals5567895.89826966


Multiple Linear Regression - Actuals, Interpolation, and Residuals
Time or IndexActualsInterpolationForecastResidualsPrediction Error
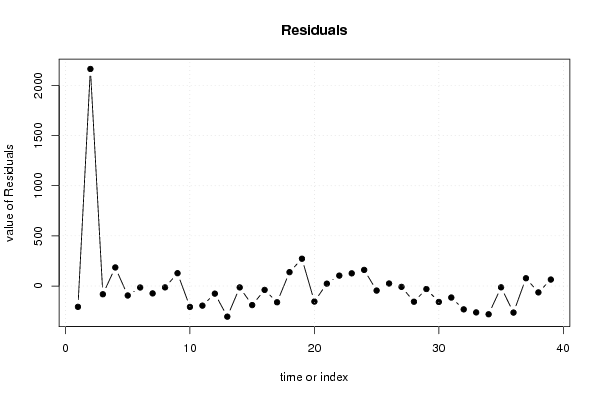
11208.834626724781-207.834626724781
22547382.9486273340952164.05137266590
310.5592.7586263185724-82.2086263185724
40.023-184.994660367713185.017660367713
5160254.435912598649-94.4359125986492
63.318.1383403431523-14.8383403431523
752.16125.923197863203-73.7631978632035
80.42513.9927689000734-13.5677689000734
9465337.347341460227127.652658539773
100.075208.834626724781-208.759626724781
110.785196.397912395545-195.612912395545
120.276.1763405462568-75.9763405462568
1327.66333.201770017148-305.541770017148
140.1213.9927689000734-13.8727689000734
1585275.163769814044-190.163769814044
160.10138.8661975585468-38.7651975585468
171.04163.233340850914-162.193340850914
18521382.948627334095138.051372665905
190.01-272.05166067237272.06166067237
2062217.125769610939-155.125769610939
210.023-23.317374087636623.3403740876366
221.7-102.083231506136103.783231506136
233.5-122.81108872153126.31108872153
240.48-160.12123170924160.60123170924
251055.4484833308623-45.4484833308623
261.62-23.317374087636624.9373740876366
27192200.543483838624-8.54348383862357
282.5159.087769407835-156.587769407835
290.2830.575054672389-30.295054672389
304.235163.233340850914-158.998340850914
316.8121.777626420125-114.977626420125
320.75233.708055383255-232.958055383255
333.6266.872626927886-263.272626927886
3455.5337.347341460227-281.847341460227
350.913.9927689000734-13.0927689000734
362266.872626927886-264.872626927886
370.104-77.209802847662277.3138028476622
384.1967.885197660099-63.6951976600991
393.5-60.627517075346664.1275170753466

\begin{tabular}{lllllllll}
\hline
Multiple Linear Regression - Actuals, Interpolation, and Residuals \tabularnewline
Time or Index & Actuals & InterpolationForecast & ResidualsPrediction Error \tabularnewline
1 & 1 & 208.834626724781 & -207.834626724781 \tabularnewline
2 & 2547 & 382.948627334095 & 2164.05137266590 \tabularnewline
3 & 10.55 & 92.7586263185724 & -82.2086263185724 \tabularnewline
4 & 0.023 & -184.994660367713 & 185.017660367713 \tabularnewline
5 & 160 & 254.435912598649 & -94.4359125986492 \tabularnewline
6 & 3.3 & 18.1383403431523 & -14.8383403431523 \tabularnewline
7 & 52.16 & 125.923197863203 & -73.7631978632035 \tabularnewline
8 & 0.425 & 13.9927689000734 & -13.5677689000734 \tabularnewline
9 & 465 & 337.347341460227 & 127.652658539773 \tabularnewline
10 & 0.075 & 208.834626724781 & -208.759626724781 \tabularnewline
11 & 0.785 & 196.397912395545 & -195.612912395545 \tabularnewline
12 & 0.2 & 76.1763405462568 & -75.9763405462568 \tabularnewline
13 & 27.66 & 333.201770017148 & -305.541770017148 \tabularnewline
14 & 0.12 & 13.9927689000734 & -13.8727689000734 \tabularnewline
15 & 85 & 275.163769814044 & -190.163769814044 \tabularnewline
16 & 0.101 & 38.8661975585468 & -38.7651975585468 \tabularnewline
17 & 1.04 & 163.233340850914 & -162.193340850914 \tabularnewline
18 & 521 & 382.948627334095 & 138.051372665905 \tabularnewline
19 & 0.01 & -272.05166067237 & 272.06166067237 \tabularnewline
20 & 62 & 217.125769610939 & -155.125769610939 \tabularnewline
21 & 0.023 & -23.3173740876366 & 23.3403740876366 \tabularnewline
22 & 1.7 & -102.083231506136 & 103.783231506136 \tabularnewline
23 & 3.5 & -122.81108872153 & 126.31108872153 \tabularnewline
24 & 0.48 & -160.12123170924 & 160.60123170924 \tabularnewline
25 & 10 & 55.4484833308623 & -45.4484833308623 \tabularnewline
26 & 1.62 & -23.3173740876366 & 24.9373740876366 \tabularnewline
27 & 192 & 200.543483838624 & -8.54348383862357 \tabularnewline
28 & 2.5 & 159.087769407835 & -156.587769407835 \tabularnewline
29 & 0.28 & 30.575054672389 & -30.295054672389 \tabularnewline
30 & 4.235 & 163.233340850914 & -158.998340850914 \tabularnewline
31 & 6.8 & 121.777626420125 & -114.977626420125 \tabularnewline
32 & 0.75 & 233.708055383255 & -232.958055383255 \tabularnewline
33 & 3.6 & 266.872626927886 & -263.272626927886 \tabularnewline
34 & 55.5 & 337.347341460227 & -281.847341460227 \tabularnewline
35 & 0.9 & 13.9927689000734 & -13.0927689000734 \tabularnewline
36 & 2 & 266.872626927886 & -264.872626927886 \tabularnewline
37 & 0.104 & -77.2098028476622 & 77.3138028476622 \tabularnewline
38 & 4.19 & 67.885197660099 & -63.6951976600991 \tabularnewline
39 & 3.5 & -60.6275170753466 & 64.1275170753466 \tabularnewline
\hline
\end{tabular}
%Source: https://freestatistics.org/blog/index.php?pk=108846&T=4

[TABLE]
[ROW][C]Multiple Linear Regression - Actuals, Interpolation, and Residuals[/C][/ROW]
[ROW][C]Time or Index[/C][C]Actuals[/C][C]InterpolationForecast[/C][C]ResidualsPrediction Error[/C][/ROW]
[ROW][C]1[/C][C]1[/C][C]208.834626724781[/C][C]-207.834626724781[/C][/ROW]
[ROW][C]2[/C][C]2547[/C][C]382.948627334095[/C][C]2164.05137266590[/C][/ROW]
[ROW][C]3[/C][C]10.55[/C][C]92.7586263185724[/C][C]-82.2086263185724[/C][/ROW]
[ROW][C]4[/C][C]0.023[/C][C]-184.994660367713[/C][C]185.017660367713[/C][/ROW]
[ROW][C]5[/C][C]160[/C][C]254.435912598649[/C][C]-94.4359125986492[/C][/ROW]
[ROW][C]6[/C][C]3.3[/C][C]18.1383403431523[/C][C]-14.8383403431523[/C][/ROW]
[ROW][C]7[/C][C]52.16[/C][C]125.923197863203[/C][C]-73.7631978632035[/C][/ROW]
[ROW][C]8[/C][C]0.425[/C][C]13.9927689000734[/C][C]-13.5677689000734[/C][/ROW]
[ROW][C]9[/C][C]465[/C][C]337.347341460227[/C][C]127.652658539773[/C][/ROW]
[ROW][C]10[/C][C]0.075[/C][C]208.834626724781[/C][C]-208.759626724781[/C][/ROW]
[ROW][C]11[/C][C]0.785[/C][C]196.397912395545[/C][C]-195.612912395545[/C][/ROW]
[ROW][C]12[/C][C]0.2[/C][C]76.1763405462568[/C][C]-75.9763405462568[/C][/ROW]
[ROW][C]13[/C][C]27.66[/C][C]333.201770017148[/C][C]-305.541770017148[/C][/ROW]
[ROW][C]14[/C][C]0.12[/C][C]13.9927689000734[/C][C]-13.8727689000734[/C][/ROW]
[ROW][C]15[/C][C]85[/C][C]275.163769814044[/C][C]-190.163769814044[/C][/ROW]
[ROW][C]16[/C][C]0.101[/C][C]38.8661975585468[/C][C]-38.7651975585468[/C][/ROW]
[ROW][C]17[/C][C]1.04[/C][C]163.233340850914[/C][C]-162.193340850914[/C][/ROW]
[ROW][C]18[/C][C]521[/C][C]382.948627334095[/C][C]138.051372665905[/C][/ROW]
[ROW][C]19[/C][C]0.01[/C][C]-272.05166067237[/C][C]272.06166067237[/C][/ROW]
[ROW][C]20[/C][C]62[/C][C]217.125769610939[/C][C]-155.125769610939[/C][/ROW]
[ROW][C]21[/C][C]0.023[/C][C]-23.3173740876366[/C][C]23.3403740876366[/C][/ROW]
[ROW][C]22[/C][C]1.7[/C][C]-102.083231506136[/C][C]103.783231506136[/C][/ROW]
[ROW][C]23[/C][C]3.5[/C][C]-122.81108872153[/C][C]126.31108872153[/C][/ROW]
[ROW][C]24[/C][C]0.48[/C][C]-160.12123170924[/C][C]160.60123170924[/C][/ROW]
[ROW][C]25[/C][C]10[/C][C]55.4484833308623[/C][C]-45.4484833308623[/C][/ROW]
[ROW][C]26[/C][C]1.62[/C][C]-23.3173740876366[/C][C]24.9373740876366[/C][/ROW]
[ROW][C]27[/C][C]192[/C][C]200.543483838624[/C][C]-8.54348383862357[/C][/ROW]
[ROW][C]28[/C][C]2.5[/C][C]159.087769407835[/C][C]-156.587769407835[/C][/ROW]
[ROW][C]29[/C][C]0.28[/C][C]30.575054672389[/C][C]-30.295054672389[/C][/ROW]
[ROW][C]30[/C][C]4.235[/C][C]163.233340850914[/C][C]-158.998340850914[/C][/ROW]
[ROW][C]31[/C][C]6.8[/C][C]121.777626420125[/C][C]-114.977626420125[/C][/ROW]
[ROW][C]32[/C][C]0.75[/C][C]233.708055383255[/C][C]-232.958055383255[/C][/ROW]
[ROW][C]33[/C][C]3.6[/C][C]266.872626927886[/C][C]-263.272626927886[/C][/ROW]
[ROW][C]34[/C][C]55.5[/C][C]337.347341460227[/C][C]-281.847341460227[/C][/ROW]
[ROW][C]35[/C][C]0.9[/C][C]13.9927689000734[/C][C]-13.0927689000734[/C][/ROW]
[ROW][C]36[/C][C]2[/C][C]266.872626927886[/C][C]-264.872626927886[/C][/ROW]
[ROW][C]37[/C][C]0.104[/C][C]-77.2098028476622[/C][C]77.3138028476622[/C][/ROW]
[ROW][C]38[/C][C]4.19[/C][C]67.885197660099[/C][C]-63.6951976600991[/C][/ROW]
[ROW][C]39[/C][C]3.5[/C][C]-60.6275170753466[/C][C]64.1275170753466[/C][/ROW]
[/TABLE]
Source: https://freestatistics.org/blog/index.php?pk=108846&T=4

Globally Unique Identifier (entire table): ba.freestatistics.org/blog/index.php?pk=108846&T=4

As an alternative you can also use a QR Code:  

The GUIDs for individual cells are displayed in the table below:

Multiple Linear Regression - Actuals, Interpolation, and Residuals
Time or IndexActualsInterpolationForecastResidualsPrediction Error
11208.834626724781-207.834626724781
22547382.9486273340952164.05137266590
310.5592.7586263185724-82.2086263185724
40.023-184.994660367713185.017660367713
5160254.435912598649-94.4359125986492
63.318.1383403431523-14.8383403431523
752.16125.923197863203-73.7631978632035
80.42513.9927689000734-13.5677689000734
9465337.347341460227127.652658539773
100.075208.834626724781-208.759626724781
110.785196.397912395545-195.612912395545
120.276.1763405462568-75.9763405462568
1327.66333.201770017148-305.541770017148
140.1213.9927689000734-13.8727689000734
1585275.163769814044-190.163769814044
160.10138.8661975585468-38.7651975585468
171.04163.233340850914-162.193340850914
18521382.948627334095138.051372665905
190.01-272.05166067237272.06166067237
2062217.125769610939-155.125769610939
210.023-23.317374087636623.3403740876366
221.7-102.083231506136103.783231506136
233.5-122.81108872153126.31108872153
240.48-160.12123170924160.60123170924
251055.4484833308623-45.4484833308623
261.62-23.317374087636624.9373740876366
27192200.543483838624-8.54348383862357
282.5159.087769407835-156.587769407835
290.2830.575054672389-30.295054672389
304.235163.233340850914-158.998340850914
316.8121.777626420125-114.977626420125
320.75233.708055383255-232.958055383255
333.6266.872626927886-263.272626927886
3455.5337.347341460227-281.847341460227
350.913.9927689000734-13.0927689000734
362266.872626927886-264.872626927886
370.104-77.209802847662277.3138028476622
384.1967.885197660099-63.6951976600991
393.5-60.627517075346664.1275170753466


Goldfeld-Quandt test for Heteroskedasticity
p-valuesAlternative Hypothesis
breakpoint indexgreater2-sidedless
511.92237862468788e-159.61189312343939e-16
60.999999999999991.93216529735587e-149.66082648677936e-15
70.9999999999999529.61809008221176e-144.80904504110588e-14
80.9999999999996287.44699899762617e-133.72349949881309e-13
90.9999999999999968.26323320225914e-154.13161660112957e-15
100.999999999999992.0275551897683e-141.01377759488415e-14
110.9999999999999656.93158660963737e-143.46579330481869e-14
120.9999999999997634.74982200516793e-132.37491100258397e-13
130.9999999999996676.66345061726289e-133.33172530863145e-13
140.9999999999977574.48541522058061e-122.24270761029030e-12
150.9999999999901411.9717662923619e-119.8588314618095e-12
160.9999999999407951.18410056561407e-105.92050282807035e-11
170.999999999743095.138222619807e-102.5691113099035e-10
1819.93173982611917e-174.96586991305958e-17
1917.35794737573535e-163.67897368786768e-16
200.9999999999999976.79471249667602e-153.39735624833801e-15
210.9999999999999588.42292286567837e-144.21146143283918e-14
220.9999999999995189.63507971242547e-134.81753985621274e-13
230.9999999999948611.02779667857782e-115.13898339288908e-12
240.9999999999492481.01504724035973e-105.07523620179866e-11
250.9999999994934261.01314866761583e-095.06574333807915e-10
260.9999999951900269.61994709720845e-094.80997354860423e-09
270.999999999999968.05728612000054e-144.02864306000027e-14
280.9999999999988322.33503097351607e-121.16751548675804e-12
290.999999999963057.39006255836931e-113.69503127918466e-11
300.9999999990074731.98505481270092e-099.92527406350459e-10
310.999999972917185.41656405285878e-082.70828202642939e-08
320.9999995374636219.25072757560109e-074.62536378780054e-07
330.9999936193690531.27612618934690e-056.38063094673451e-06
340.9999998516646382.96670723364357e-071.48335361682179e-07

\begin{tabular}{lllllllll}
\hline
Goldfeld-Quandt test for Heteroskedasticity \tabularnewline
p-values & Alternative Hypothesis \tabularnewline
breakpoint index & greater & 2-sided & less \tabularnewline
5 & 1 & 1.92237862468788e-15 & 9.61189312343939e-16 \tabularnewline
6 & 0.99999999999999 & 1.93216529735587e-14 & 9.66082648677936e-15 \tabularnewline
7 & 0.999999999999952 & 9.61809008221176e-14 & 4.80904504110588e-14 \tabularnewline
8 & 0.999999999999628 & 7.44699899762617e-13 & 3.72349949881309e-13 \tabularnewline
9 & 0.999999999999996 & 8.26323320225914e-15 & 4.13161660112957e-15 \tabularnewline
10 & 0.99999999999999 & 2.0275551897683e-14 & 1.01377759488415e-14 \tabularnewline
11 & 0.999999999999965 & 6.93158660963737e-14 & 3.46579330481869e-14 \tabularnewline
12 & 0.999999999999763 & 4.74982200516793e-13 & 2.37491100258397e-13 \tabularnewline
13 & 0.999999999999667 & 6.66345061726289e-13 & 3.33172530863145e-13 \tabularnewline
14 & 0.999999999997757 & 4.48541522058061e-12 & 2.24270761029030e-12 \tabularnewline
15 & 0.999999999990141 & 1.9717662923619e-11 & 9.8588314618095e-12 \tabularnewline
16 & 0.999999999940795 & 1.18410056561407e-10 & 5.92050282807035e-11 \tabularnewline
17 & 0.99999999974309 & 5.138222619807e-10 & 2.5691113099035e-10 \tabularnewline
18 & 1 & 9.93173982611917e-17 & 4.96586991305958e-17 \tabularnewline
19 & 1 & 7.35794737573535e-16 & 3.67897368786768e-16 \tabularnewline
20 & 0.999999999999997 & 6.79471249667602e-15 & 3.39735624833801e-15 \tabularnewline
21 & 0.999999999999958 & 8.42292286567837e-14 & 4.21146143283918e-14 \tabularnewline
22 & 0.999999999999518 & 9.63507971242547e-13 & 4.81753985621274e-13 \tabularnewline
23 & 0.999999999994861 & 1.02779667857782e-11 & 5.13898339288908e-12 \tabularnewline
24 & 0.999999999949248 & 1.01504724035973e-10 & 5.07523620179866e-11 \tabularnewline
25 & 0.999999999493426 & 1.01314866761583e-09 & 5.06574333807915e-10 \tabularnewline
26 & 0.999999995190026 & 9.61994709720845e-09 & 4.80997354860423e-09 \tabularnewline
27 & 0.99999999999996 & 8.05728612000054e-14 & 4.02864306000027e-14 \tabularnewline
28 & 0.999999999998832 & 2.33503097351607e-12 & 1.16751548675804e-12 \tabularnewline
29 & 0.99999999996305 & 7.39006255836931e-11 & 3.69503127918466e-11 \tabularnewline
30 & 0.999999999007473 & 1.98505481270092e-09 & 9.92527406350459e-10 \tabularnewline
31 & 0.99999997291718 & 5.41656405285878e-08 & 2.70828202642939e-08 \tabularnewline
32 & 0.999999537463621 & 9.25072757560109e-07 & 4.62536378780054e-07 \tabularnewline
33 & 0.999993619369053 & 1.27612618934690e-05 & 6.38063094673451e-06 \tabularnewline
34 & 0.999999851664638 & 2.96670723364357e-07 & 1.48335361682179e-07 \tabularnewline
\hline
\end{tabular}
%Source: https://freestatistics.org/blog/index.php?pk=108846&T=5

[TABLE]
[ROW][C]Goldfeld-Quandt test for Heteroskedasticity[/C][/ROW]
[ROW][C]p-values[/C][C]Alternative Hypothesis[/C][/ROW]
[ROW][C]breakpoint index[/C][C]greater[/C][C]2-sided[/C][C]less[/C][/ROW]
[ROW][C]5[/C][C]1[/C][C]1.92237862468788e-15[/C][C]9.61189312343939e-16[/C][/ROW]
[ROW][C]6[/C][C]0.99999999999999[/C][C]1.93216529735587e-14[/C][C]9.66082648677936e-15[/C][/ROW]
[ROW][C]7[/C][C]0.999999999999952[/C][C]9.61809008221176e-14[/C][C]4.80904504110588e-14[/C][/ROW]
[ROW][C]8[/C][C]0.999999999999628[/C][C]7.44699899762617e-13[/C][C]3.72349949881309e-13[/C][/ROW]
[ROW][C]9[/C][C]0.999999999999996[/C][C]8.26323320225914e-15[/C][C]4.13161660112957e-15[/C][/ROW]
[ROW][C]10[/C][C]0.99999999999999[/C][C]2.0275551897683e-14[/C][C]1.01377759488415e-14[/C][/ROW]
[ROW][C]11[/C][C]0.999999999999965[/C][C]6.93158660963737e-14[/C][C]3.46579330481869e-14[/C][/ROW]
[ROW][C]12[/C][C]0.999999999999763[/C][C]4.74982200516793e-13[/C][C]2.37491100258397e-13[/C][/ROW]
[ROW][C]13[/C][C]0.999999999999667[/C][C]6.66345061726289e-13[/C][C]3.33172530863145e-13[/C][/ROW]
[ROW][C]14[/C][C]0.999999999997757[/C][C]4.48541522058061e-12[/C][C]2.24270761029030e-12[/C][/ROW]
[ROW][C]15[/C][C]0.999999999990141[/C][C]1.9717662923619e-11[/C][C]9.8588314618095e-12[/C][/ROW]
[ROW][C]16[/C][C]0.999999999940795[/C][C]1.18410056561407e-10[/C][C]5.92050282807035e-11[/C][/ROW]
[ROW][C]17[/C][C]0.99999999974309[/C][C]5.138222619807e-10[/C][C]2.5691113099035e-10[/C][/ROW]
[ROW][C]18[/C][C]1[/C][C]9.93173982611917e-17[/C][C]4.96586991305958e-17[/C][/ROW]
[ROW][C]19[/C][C]1[/C][C]7.35794737573535e-16[/C][C]3.67897368786768e-16[/C][/ROW]
[ROW][C]20[/C][C]0.999999999999997[/C][C]6.79471249667602e-15[/C][C]3.39735624833801e-15[/C][/ROW]
[ROW][C]21[/C][C]0.999999999999958[/C][C]8.42292286567837e-14[/C][C]4.21146143283918e-14[/C][/ROW]
[ROW][C]22[/C][C]0.999999999999518[/C][C]9.63507971242547e-13[/C][C]4.81753985621274e-13[/C][/ROW]
[ROW][C]23[/C][C]0.999999999994861[/C][C]1.02779667857782e-11[/C][C]5.13898339288908e-12[/C][/ROW]
[ROW][C]24[/C][C]0.999999999949248[/C][C]1.01504724035973e-10[/C][C]5.07523620179866e-11[/C][/ROW]
[ROW][C]25[/C][C]0.999999999493426[/C][C]1.01314866761583e-09[/C][C]5.06574333807915e-10[/C][/ROW]
[ROW][C]26[/C][C]0.999999995190026[/C][C]9.61994709720845e-09[/C][C]4.80997354860423e-09[/C][/ROW]
[ROW][C]27[/C][C]0.99999999999996[/C][C]8.05728612000054e-14[/C][C]4.02864306000027e-14[/C][/ROW]
[ROW][C]28[/C][C]0.999999999998832[/C][C]2.33503097351607e-12[/C][C]1.16751548675804e-12[/C][/ROW]
[ROW][C]29[/C][C]0.99999999996305[/C][C]7.39006255836931e-11[/C][C]3.69503127918466e-11[/C][/ROW]
[ROW][C]30[/C][C]0.999999999007473[/C][C]1.98505481270092e-09[/C][C]9.92527406350459e-10[/C][/ROW]
[ROW][C]31[/C][C]0.99999997291718[/C][C]5.41656405285878e-08[/C][C]2.70828202642939e-08[/C][/ROW]
[ROW][C]32[/C][C]0.999999537463621[/C][C]9.25072757560109e-07[/C][C]4.62536378780054e-07[/C][/ROW]
[ROW][C]33[/C][C]0.999993619369053[/C][C]1.27612618934690e-05[/C][C]6.38063094673451e-06[/C][/ROW]
[ROW][C]34[/C][C]0.999999851664638[/C][C]2.96670723364357e-07[/C][C]1.48335361682179e-07[/C][/ROW]
[/TABLE]
Source: https://freestatistics.org/blog/index.php?pk=108846&T=5

Globally Unique Identifier (entire table): ba.freestatistics.org/blog/index.php?pk=108846&T=5

As an alternative you can also use a QR Code:  

The GUIDs for individual cells are displayed in the table below:

Goldfeld-Quandt test for Heteroskedasticity
p-valuesAlternative Hypothesis
breakpoint indexgreater2-sidedless
511.92237862468788e-159.61189312343939e-16
60.999999999999991.93216529735587e-149.66082648677936e-15
70.9999999999999529.61809008221176e-144.80904504110588e-14
80.9999999999996287.44699899762617e-133.72349949881309e-13
90.9999999999999968.26323320225914e-154.13161660112957e-15
100.999999999999992.0275551897683e-141.01377759488415e-14
110.9999999999999656.93158660963737e-143.46579330481869e-14
120.9999999999997634.74982200516793e-132.37491100258397e-13
130.9999999999996676.66345061726289e-133.33172530863145e-13
140.9999999999977574.48541522058061e-122.24270761029030e-12
150.9999999999901411.9717662923619e-119.8588314618095e-12
160.9999999999407951.18410056561407e-105.92050282807035e-11
170.999999999743095.138222619807e-102.5691113099035e-10
1819.93173982611917e-174.96586991305958e-17
1917.35794737573535e-163.67897368786768e-16
200.9999999999999976.79471249667602e-153.39735624833801e-15
210.9999999999999588.42292286567837e-144.21146143283918e-14
220.9999999999995189.63507971242547e-134.81753985621274e-13
230.9999999999948611.02779667857782e-115.13898339288908e-12
240.9999999999492481.01504724035973e-105.07523620179866e-11
250.9999999994934261.01314866761583e-095.06574333807915e-10
260.9999999951900269.61994709720845e-094.80997354860423e-09
270.999999999999968.05728612000054e-144.02864306000027e-14
280.9999999999988322.33503097351607e-121.16751548675804e-12
290.999999999963057.39006255836931e-113.69503127918466e-11
300.9999999990074731.98505481270092e-099.92527406350459e-10
310.999999972917185.41656405285878e-082.70828202642939e-08
320.9999995374636219.25072757560109e-074.62536378780054e-07
330.9999936193690531.27612618934690e-056.38063094673451e-06
340.9999998516646382.96670723364357e-071.48335361682179e-07


Meta Analysis of Goldfeld-Quandt test for Heteroskedasticity
Description# significant tests% significant testsOK/NOK
1% type I error level301NOK
5% type I error level301NOK
10% type I error level301NOK

\begin{tabular}{lllllllll}
\hline
Meta Analysis of Goldfeld-Quandt test for Heteroskedasticity \tabularnewline
Description & # significant tests & % significant tests & OK/NOK \tabularnewline
1% type I error level & 30 & 1 & NOK \tabularnewline
5% type I error level & 30 & 1 & NOK \tabularnewline
10% type I error level & 30 & 1 & NOK \tabularnewline
\hline
\end{tabular}
%Source: https://freestatistics.org/blog/index.php?pk=108846&T=6

[TABLE]
[ROW][C]Meta Analysis of Goldfeld-Quandt test for Heteroskedasticity[/C][/ROW]
[ROW][C]Description[/C][C]# significant tests[/C][C]% significant tests[/C][C]OK/NOK[/C][/ROW]
[ROW][C]1% type I error level[/C][C]30[/C][C]1[/C][C]NOK[/C][/ROW]
[ROW][C]5% type I error level[/C][C]30[/C][C]1[/C][C]NOK[/C][/ROW]
[ROW][C]10% type I error level[/C][C]30[/C][C]1[/C][C]NOK[/C][/ROW]
[/TABLE]
Source: https://freestatistics.org/blog/index.php?pk=108846&T=6

Globally Unique Identifier (entire table): ba.freestatistics.org/blog/index.php?pk=108846&T=6

As an alternative you can also use a QR Code:  

The GUIDs for individual cells are displayed in the table below:

Meta Analysis of Goldfeld-Quandt test for Heteroskedasticity
Description# significant tests% significant testsOK/NOK
1% type I error level301NOK
5% type I error level301NOK
10% type I error level301NOK


Parameters (Session):
par1 = 1 ; par2 = Do not include Seasonal Dummies ; par3 = No Linear Trend ;
Parameters (R input):
par1 = 1 ; par2 = Do not include Seasonal Dummies ; par3 = No Linear Trend ;
R code (references can be found in the software module):
library(lattice)
library(lmtest)
n25 <- 25 #minimum number of obs. for Goldfeld-Quandt test
par1 <- as.numeric(par1)
x <- t(y)
k <- length(x[1,])
n <- length(x[,1])
x1 <- cbind(x[,par1], x[,1:k!=par1])
mycolnames <- c(colnames(x)[par1], colnames(x)[1:k!=par1])
colnames(x1) <- mycolnames #colnames(x)[par1]
x <- x1
if (par3 == 'First Differences'){
x2 <- array(0, dim=c(n-1,k), dimnames=list(1:(n-1), paste('(1-B)',colnames(x),sep='')))
for (i in 1:n-1) {
for (j in 1:k) {
x2[i,j] <- x[i+1,j] - x[i,j]
}
}
x <- x2
}
if (par2 == 'Include Monthly Dummies'){
x2 <- array(0, dim=c(n,11), dimnames=list(1:n, paste('M', seq(1:11), sep ='')))
for (i in 1:11){
x2[seq(i,n,12),i] <- 1
}
x <- cbind(x, x2)
}
if (par2 == 'Include Quarterly Dummies'){
x2 <- array(0, dim=c(n,3), dimnames=list(1:n, paste('Q', seq(1:3), sep ='')))
for (i in 1:3){
x2[seq(i,n,4),i] <- 1
}
x <- cbind(x, x2)
}
k <- length(x[1,])
if (par3 == 'Linear Trend'){
x <- cbind(x, c(1:n))
colnames(x)[k+1] <- 't'
}
x
k <- length(x[1,])
df <- as.data.frame(x)
(mylm <- lm(df))
(mysum <- summary(mylm))
if (n > n25) {
kp3 <- k + 3
nmkm3 <- n - k - 3
gqarr <- array(NA, dim=c(nmkm3-kp3+1,3))
numgqtests <- 0
numsignificant1 <- 0
numsignificant5 <- 0
numsignificant10 <- 0
for (mypoint in kp3:nmkm3) {
j <- 0
numgqtests <- numgqtests + 1
for (myalt in c('greater', 'two.sided', 'less')) {
j <- j + 1
gqarr[mypoint-kp3+1,j] <- gqtest(mylm, point=mypoint, alternative=myalt)$p.value
}
if (gqarr[mypoint-kp3+1,2] < 0.01) numsignificant1 <- numsignificant1 + 1
if (gqarr[mypoint-kp3+1,2] < 0.05) numsignificant5 <- numsignificant5 + 1
if (gqarr[mypoint-kp3+1,2] < 0.10) numsignificant10 <- numsignificant10 + 1
}
gqarr
}
bitmap(file='test0.png')
plot(x[,1], type='l', main='Actuals and Interpolation', ylab='value of Actuals and Interpolation (dots)', xlab='time or index')
points(x[,1]-mysum$resid)
grid()
dev.off()
bitmap(file='test1.png')
plot(mysum$resid, type='b', pch=19, main='Residuals', ylab='value of Residuals', xlab='time or index')
grid()
dev.off()
bitmap(file='test2.png')
hist(mysum$resid, main='Residual Histogram', xlab='values of Residuals')
grid()
dev.off()
bitmap(file='test3.png')
densityplot(~mysum$resid,col='black',main='Residual Density Plot', xlab='values of Residuals')
dev.off()
bitmap(file='test4.png')
qqnorm(mysum$resid, main='Residual Normal Q-Q Plot')
qqline(mysum$resid)
grid()
dev.off()
(myerror <- as.ts(mysum$resid))
bitmap(file='test5.png')
dum <- cbind(lag(myerror,k=1),myerror)
dum
dum1 <- dum[2:length(myerror),]
dum1
z <- as.data.frame(dum1)
z
plot(z,main=paste('Residual Lag plot, lowess, and regression line'), ylab='values of Residuals', xlab='lagged values of Residuals')
lines(lowess(z))
abline(lm(z))
grid()
dev.off()
bitmap(file='test6.png')
acf(mysum$resid, lag.max=length(mysum$resid)/2, main='Residual Autocorrelation Function')
grid()
dev.off()
bitmap(file='test7.png')
pacf(mysum$resid, lag.max=length(mysum$resid)/2, main='Residual Partial Autocorrelation Function')
grid()
dev.off()
bitmap(file='test8.png')
opar <- par(mfrow = c(2,2), oma = c(0, 0, 1.1, 0))
plot(mylm, las = 1, sub='Residual Diagnostics')
par(opar)
dev.off()
if (n > n25) {
bitmap(file='test9.png')
plot(kp3:nmkm3,gqarr[,2], main='Goldfeld-Quandt test',ylab='2-sided p-value',xlab='breakpoint')
grid()
dev.off()
}
load(file='createtable')
a<-table.start()
a<-table.row.start(a)
a<-table.element(a, 'Multiple Linear Regression - Estimated Regression Equation', 1, TRUE)
a<-table.row.end(a)
myeq <- colnames(x)[1]
myeq <- paste(myeq, '[t] = ', sep='')
for (i in 1:k){
if (mysum$coefficients[i,1] > 0) myeq <- paste(myeq, '+', '')
myeq <- paste(myeq, mysum$coefficients[i,1], sep=' ')
if (rownames(mysum$coefficients)[i] != '(Intercept)') {
myeq <- paste(myeq, rownames(mysum$coefficients)[i], sep='')
if (rownames(mysum$coefficients)[i] != 't') myeq <- paste(myeq, '[t]', sep='')
}
}
myeq <- paste(myeq, ' + e[t]')
a<-table.row.start(a)
a<-table.element(a, myeq)
a<-table.row.end(a)
a<-table.end(a)
table.save(a,file='mytable1.tab')
a<-table.start()
a<-table.row.start(a)
a<-table.element(a,hyperlink('ols1.htm','Multiple Linear Regression - Ordinary Least Squares',''), 6, TRUE)
a<-table.row.end(a)
a<-table.row.start(a)
a<-table.element(a,'Variable',header=TRUE)
a<-table.element(a,'Parameter',header=TRUE)
a<-table.element(a,'S.D.',header=TRUE)
a<-table.element(a,'T-STAT
H0: parameter = 0',header=TRUE)
a<-table.element(a,'2-tail p-value',header=TRUE)
a<-table.element(a,'1-tail p-value',header=TRUE)
a<-table.row.end(a)
for (i in 1:k){
a<-table.row.start(a)
a<-table.element(a,rownames(mysum$coefficients)[i],header=TRUE)
a<-table.element(a,mysum$coefficients[i,1])
a<-table.element(a, round(mysum$coefficients[i,2],6))
a<-table.element(a, round(mysum$coefficients[i,3],4))
a<-table.element(a, round(mysum$coefficients[i,4],6))
a<-table.element(a, round(mysum$coefficients[i,4]/2,6))
a<-table.row.end(a)
}
a<-table.end(a)
table.save(a,file='mytable2.tab')
a<-table.start()
a<-table.row.start(a)
a<-table.element(a, 'Multiple Linear Regression - Regression Statistics', 2, TRUE)
a<-table.row.end(a)
a<-table.row.start(a)
a<-table.element(a, 'Multiple R',1,TRUE)
a<-table.element(a, sqrt(mysum$r.squared))
a<-table.row.end(a)
a<-table.row.start(a)
a<-table.element(a, 'R-squared',1,TRUE)
a<-table.element(a, mysum$r.squared)
a<-table.row.end(a)
a<-table.row.start(a)
a<-table.element(a, 'Adjusted R-squared',1,TRUE)
a<-table.element(a, mysum$adj.r.squared)
a<-table.row.end(a)
a<-table.row.start(a)
a<-table.element(a, 'F-TEST (value)',1,TRUE)
a<-table.element(a, mysum$fstatistic[1])
a<-table.row.end(a)
a<-table.row.start(a)
a<-table.element(a, 'F-TEST (DF numerator)',1,TRUE)
a<-table.element(a, mysum$fstatistic[2])
a<-table.row.end(a)
a<-table.row.start(a)
a<-table.element(a, 'F-TEST (DF denominator)',1,TRUE)
a<-table.element(a, mysum$fstatistic[3])
a<-table.row.end(a)
a<-table.row.start(a)
a<-table.element(a, 'p-value',1,TRUE)
a<-table.element(a, 1-pf(mysum$fstatistic[1],mysum$fstatistic[2],mysum$fstatistic[3]))
a<-table.row.end(a)
a<-table.row.start(a)
a<-table.element(a, 'Multiple Linear Regression - Residual Statistics', 2, TRUE)
a<-table.row.end(a)
a<-table.row.start(a)
a<-table.element(a, 'Residual Standard Deviation',1,TRUE)
a<-table.element(a, mysum$sigma)
a<-table.row.end(a)
a<-table.row.start(a)
a<-table.element(a, 'Sum Squared Residuals',1,TRUE)
a<-table.element(a, sum(myerror*myerror))
a<-table.row.end(a)
a<-table.end(a)
table.save(a,file='mytable3.tab')
a<-table.start()
a<-table.row.start(a)
a<-table.element(a, 'Multiple Linear Regression - Actuals, Interpolation, and Residuals', 4, TRUE)
a<-table.row.end(a)
a<-table.row.start(a)
a<-table.element(a, 'Time or Index', 1, TRUE)
a<-table.element(a, 'Actuals', 1, TRUE)
a<-table.element(a, 'Interpolation
Forecast', 1, TRUE)
a<-table.element(a, 'Residuals
Prediction Error', 1, TRUE)
a<-table.row.end(a)
for (i in 1:n) {
a<-table.row.start(a)
a<-table.element(a,i, 1, TRUE)
a<-table.element(a,x[i])
a<-table.element(a,x[i]-mysum$resid[i])
a<-table.element(a,mysum$resid[i])
a<-table.row.end(a)
}
a<-table.end(a)
table.save(a,file='mytable4.tab')
if (n > n25) {
a<-table.start()
a<-table.row.start(a)
a<-table.element(a,'Goldfeld-Quandt test for Heteroskedasticity',4,TRUE)
a<-table.row.end(a)
a<-table.row.start(a)
a<-table.element(a,'p-values',header=TRUE)
a<-table.element(a,'Alternative Hypothesis',3,header=TRUE)
a<-table.row.end(a)
a<-table.row.start(a)
a<-table.element(a,'breakpoint index',header=TRUE)
a<-table.element(a,'greater',header=TRUE)
a<-table.element(a,'2-sided',header=TRUE)
a<-table.element(a,'less',header=TRUE)
a<-table.row.end(a)
for (mypoint in kp3:nmkm3) {
a<-table.row.start(a)
a<-table.element(a,mypoint,header=TRUE)
a<-table.element(a,gqarr[mypoint-kp3+1,1])
a<-table.element(a,gqarr[mypoint-kp3+1,2])
a<-table.element(a,gqarr[mypoint-kp3+1,3])
a<-table.row.end(a)
}
a<-table.end(a)
table.save(a,file='mytable5.tab')
a<-table.start()
a<-table.row.start(a)
a<-table.element(a,'Meta Analysis of Goldfeld-Quandt test for Heteroskedasticity',4,TRUE)
a<-table.row.end(a)
a<-table.row.start(a)
a<-table.element(a,'Description',header=TRUE)
a<-table.element(a,'# significant tests',header=TRUE)
a<-table.element(a,'% significant tests',header=TRUE)
a<-table.element(a,'OK/NOK',header=TRUE)
a<-table.row.end(a)
a<-table.row.start(a)
a<-table.element(a,'1% type I error level',header=TRUE)
a<-table.element(a,numsignificant1)
a<-table.element(a,numsignificant1/numgqtests)
if (numsignificant1/numgqtests < 0.01) dum <- 'OK' else dum <- 'NOK'
a<-table.element(a,dum)
a<-table.row.end(a)
a<-table.row.start(a)
a<-table.element(a,'5% type I error level',header=TRUE)
a<-table.element(a,numsignificant5)
a<-table.element(a,numsignificant5/numgqtests)
if (numsignificant5/numgqtests < 0.05) dum <- 'OK' else dum <- 'NOK'
a<-table.element(a,dum)
a<-table.row.end(a)
a<-table.row.start(a)
a<-table.element(a,'10% type I error level',header=TRUE)
a<-table.element(a,numsignificant10)
a<-table.element(a,numsignificant10/numgqtests)
if (numsignificant10/numgqtests < 0.1) dum <- 'OK' else dum <- 'NOK'
a<-table.element(a,dum)
a<-table.row.end(a)
a<-table.end(a)
table.save(a,file='mytable6.tab')
}