Free Statistics

of Irreproducible Research!

Author's title

Author*The author of this computation has been verified*
R Software Modulerwasp_correlation.wasp
Title produced by softwarePearson Correlation
Date of computationMon, 13 Dec 2010 11:02:58 +0000
Cite this page as followsStatistical Computations at FreeStatistics.org, Office for Research Development and Education, URL https://freestatistics.org/blog/index.php?v=date/2010/Dec/13/t12922382673jb2cdfajlaiekb.htm/, Retrieved Mon, 06 May 2024 11:12:33 +0000
Statistical Computations at FreeStatistics.org, Office for Research Development and Education, URL https://freestatistics.org/blog/index.php?pk=108841, Retrieved Mon, 06 May 2024 11:12:33 +0000
QR Codes:

Original text written by user:
IsPrivate?No (this computation is public)
User-defined keywords
Estimated Impact110
Family? (F = Feedback message, R = changed R code, M = changed R Module, P = changed Parameters, D = changed Data)
-       [Pearson Correlation] [correlatie gewich...] [2010-12-13 11:02:58] [4f70e6cd0867f10d298e58e8e27859b5] [Current]
- RM D    [Kendall tau Correlation Matrix] [Correlatie gewich...] [2010-12-13 19:04:36] [1251ac2db27b84d4a3ba43449388906b]
Feedback Forum

Post a new message
Dataseries X:
6654000
1000
3385
.920
2547000
10550
.023
160000
3300
52160
.425
465000
.550
187100
.075
3000
.785
.200
1410
60000
529000
27660
.120
207000
85000
36330
.101
1040
521000
100000
35000
.005
.010
62000
.122
1350
.023
.048
1700
3500
250000
.480
10000
1620
192000
2500
4288
.280
4235
6800
.750
3600
14830
55500
1400
.060
.900
2000
.104
4190
3500
4050
Dataseries Y:
3
3
1
3
4
4
1
4
1
1
4
5
2
5
1
2
2
2
1
1
5
5
2
1
1
1
3
4
5
1
4
4
1
1
1
3
3
3
1
1
5
2
4
2
4
5
2
3
1
2
2
3
5
5
2
2
2
3
2
4
1
1


Summary of computational transaction
Raw Inputview raw input (R code)
Raw Outputview raw output of R engine
Computing time1 seconds
R Server'Gwilym Jenkins' @ 72.249.127.135

\begin{tabular}{lllllllll}
\hline
Summary of computational transaction \tabularnewline
Raw Input & view raw input (R code)  \tabularnewline
Raw Output & view raw output of R engine  \tabularnewline
Computing time & 1 seconds \tabularnewline
R Server & 'Gwilym Jenkins' @ 72.249.127.135 \tabularnewline
\hline
\end{tabular}
%Source: https://freestatistics.org/blog/index.php?pk=108841&T=0

[TABLE]
[ROW][C]Summary of computational transaction[/C][/ROW]
[ROW][C]Raw Input[/C][C]view raw input (R code) [/C][/ROW]
[ROW][C]Raw Output[/C][C]view raw output of R engine [/C][/ROW]
[ROW][C]Computing time[/C][C]1 seconds[/C][/ROW]
[ROW][C]R Server[/C][C]'Gwilym Jenkins' @ 72.249.127.135[/C][/ROW]
[/TABLE]
Source: https://freestatistics.org/blog/index.php?pk=108841&T=0

Globally Unique Identifier (entire table): ba.freestatistics.org/blog/index.php?pk=108841&T=0

As an alternative you can also use a QR Code:  

The GUIDs for individual cells are displayed in the table below:

Summary of computational transaction
Raw Inputview raw input (R code)
Raw Outputview raw output of R engine
Computing time1 seconds
R Server'Gwilym Jenkins' @ 72.249.127.135


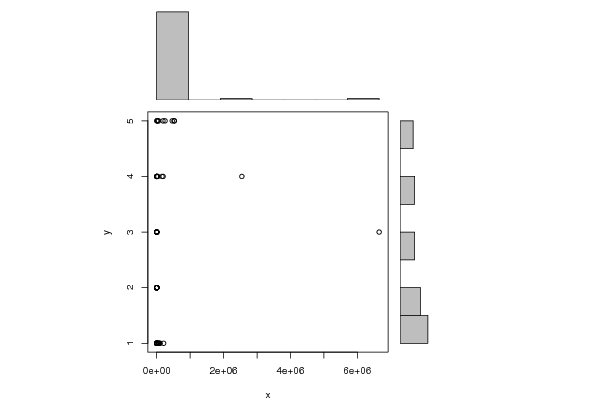
Pearson Product Moment Correlation - Ungrouped Data
StatisticVariable XVariable Y
Mean198693.6125967742.61290322580645
Biased Variance795483291008.3682.04370447450572
Biased Standard Deviation891898.6999701071.42958192297809
Covariance173136.962677419
Correlation0.133599047303509
Determination0.0178487054404053
T-Test1.04421466861488
p-value (2 sided)0.300575016240076
p-value (1 sided)0.150287508120038
Degrees of Freedom60
Number of Observations62

\begin{tabular}{lllllllll}
\hline
Pearson Product Moment Correlation - Ungrouped Data \tabularnewline
Statistic & Variable X & Variable Y \tabularnewline
Mean & 198693.612596774 & 2.61290322580645 \tabularnewline
Biased Variance & 795483291008.368 & 2.04370447450572 \tabularnewline
Biased Standard Deviation & 891898.699970107 & 1.42958192297809 \tabularnewline
Covariance & 173136.962677419 \tabularnewline
Correlation & 0.133599047303509 \tabularnewline
Determination & 0.0178487054404053 \tabularnewline
T-Test & 1.04421466861488 \tabularnewline
p-value (2 sided) & 0.300575016240076 \tabularnewline
p-value (1 sided) & 0.150287508120038 \tabularnewline
Degrees of Freedom & 60 \tabularnewline
Number of Observations & 62 \tabularnewline
\hline
\end{tabular}
%Source: https://freestatistics.org/blog/index.php?pk=108841&T=1

[TABLE]
[ROW][C]Pearson Product Moment Correlation - Ungrouped Data[/C][/ROW]
[ROW][C]Statistic[/C][C]Variable X[/C][C]Variable Y[/C][/ROW]
[ROW][C]Mean[/C][C]198693.612596774[/C][C]2.61290322580645[/C][/ROW]
[ROW][C]Biased Variance[/C][C]795483291008.368[/C][C]2.04370447450572[/C][/ROW]
[ROW][C]Biased Standard Deviation[/C][C]891898.699970107[/C][C]1.42958192297809[/C][/ROW]
[ROW][C]Covariance[/C][C]173136.962677419[/C][/ROW]
[ROW][C]Correlation[/C][C]0.133599047303509[/C][/ROW]
[ROW][C]Determination[/C][C]0.0178487054404053[/C][/ROW]
[ROW][C]T-Test[/C][C]1.04421466861488[/C][/ROW]
[ROW][C]p-value (2 sided)[/C][C]0.300575016240076[/C][/ROW]
[ROW][C]p-value (1 sided)[/C][C]0.150287508120038[/C][/ROW]
[ROW][C]Degrees of Freedom[/C][C]60[/C][/ROW]
[ROW][C]Number of Observations[/C][C]62[/C][/ROW]
[/TABLE]
Source: https://freestatistics.org/blog/index.php?pk=108841&T=1

Globally Unique Identifier (entire table): ba.freestatistics.org/blog/index.php?pk=108841&T=1

As an alternative you can also use a QR Code:  

The GUIDs for individual cells are displayed in the table below:

Pearson Product Moment Correlation - Ungrouped Data
StatisticVariable XVariable Y
Mean198693.6125967742.61290322580645
Biased Variance795483291008.3682.04370447450572
Biased Standard Deviation891898.6999701071.42958192297809
Covariance173136.962677419
Correlation0.133599047303509
Determination0.0178487054404053
T-Test1.04421466861488
p-value (2 sided)0.300575016240076
p-value (1 sided)0.150287508120038
Degrees of Freedom60
Number of Observations62


Parameters (Session):
Parameters (R input):
R code (references can be found in the software module):
bitmap(file='test1.png')
histx <- hist(x, plot=FALSE)
histy <- hist(y, plot=FALSE)
maxcounts <- max(c(histx$counts, histx$counts))
xrange <- c(min(x),max(x))
yrange <- c(min(y),max(y))
nf <- layout(matrix(c(2,0,1,3),2,2,byrow=TRUE), c(3,1), c(1,3), TRUE)
par(mar=c(4,4,1,1))
plot(x, y, xlim=xrange, ylim=yrange, xlab=xlab, ylab=ylab)
par(mar=c(0,4,1,1))
barplot(histx$counts, axes=FALSE, ylim=c(0, maxcounts), space=0)
par(mar=c(4,0,1,1))
barplot(histy$counts, axes=FALSE, xlim=c(0, maxcounts), space=0, horiz=TRUE)
dev.off()
lx = length(x)
makebiased = (lx-1)/lx
varx = var(x)*makebiased
vary = var(y)*makebiased
corxy <- cor.test(x,y,method='pearson')
cxy <- as.matrix(corxy$estimate)[1,1]
load(file='createtable')
a<-table.start()
a<-table.row.start(a)
a<-table.element(a,'Pearson Product Moment Correlation - Ungrouped Data',3,TRUE)
a<-table.row.end(a)
a<-table.row.start(a)
a<-table.element(a,'Statistic',1,TRUE)
a<-table.element(a,'Variable X',1,TRUE)
a<-table.element(a,'Variable Y',1,TRUE)
a<-table.row.end(a)
a<-table.row.start(a)
a<-table.element(a,hyperlink('arithmetic_mean.htm','Mean',''),header=TRUE)
a<-table.element(a,mean(x))
a<-table.element(a,mean(y))
a<-table.row.end(a)
a<-table.row.start(a)
a<-table.element(a,hyperlink('biased.htm','Biased Variance',''),header=TRUE)
a<-table.element(a,varx)
a<-table.element(a,vary)
a<-table.row.end(a)
a<-table.row.start(a)
a<-table.element(a,hyperlink('biased1.htm','Biased Standard Deviation',''),header=TRUE)
a<-table.element(a,sqrt(varx))
a<-table.element(a,sqrt(vary))
a<-table.row.end(a)
a<-table.row.start(a)
a<-table.element(a,hyperlink('covariance.htm','Covariance',''),header=TRUE)
a<-table.element(a,cov(x,y),2)
a<-table.row.end(a)
a<-table.row.start(a)
a<-table.element(a,hyperlink('pearson_correlation.htm','Correlation',''),header=TRUE)
a<-table.element(a,cxy,2)
a<-table.row.end(a)
a<-table.row.start(a)
a<-table.element(a,hyperlink('coeff_of_determination.htm','Determination',''),header=TRUE)
a<-table.element(a,cxy*cxy,2)
a<-table.row.end(a)
a<-table.row.start(a)
a<-table.element(a,hyperlink('ttest_statistic.htm','T-Test',''),header=TRUE)
a<-table.element(a,as.matrix(corxy$statistic)[1,1],2)
a<-table.row.end(a)
a<-table.row.start(a)
a<-table.element(a,'p-value (2 sided)',header=TRUE)
a<-table.element(a,(p2 <- as.matrix(corxy$p.value)[1,1]),2)
a<-table.row.end(a)
a<-table.row.start(a)
a<-table.element(a,'p-value (1 sided)',header=TRUE)
a<-table.element(a,p2/2,2)
a<-table.row.end(a)
a<-table.row.start(a)
a<-table.element(a,'Degrees of Freedom',header=TRUE)
a<-table.element(a,lx-2,2)
a<-table.row.end(a)
a<-table.row.start(a)
a<-table.element(a,'Number of Observations',header=TRUE)
a<-table.element(a,lx,2)
a<-table.row.end(a)
a<-table.end(a)
table.save(a,file='mytable.tab')