| Multiple Linear Regression - Estimated Regression Equation |
| life[t] = + 19.5803665973447 -8.06766786814694P[t] + 7.46042791343927S[t] + 1.79548729423336D[t] + e[t] |
| Multiple Linear Regression - Ordinary Least Squares | |||||
| Variable | Parameter | S.D. | T-STAT H0: parameter = 0 | 2-tail p-value | 1-tail p-value |
| (Intercept) | 19.5803665973447 | 4.564603 | 4.2896 | 7.5e-05 | 3.7e-05 |
| P | -8.06766786814694 | 4.124543 | -1.956 | 0.055645 | 0.027822 |
| S | 7.46042791343927 | 2.334764 | 3.1954 | 0.002333 | 0.001167 |
| D | 1.79548729423336 | 5.330018 | 0.3369 | 0.737526 | 0.368763 |
| Multiple Linear Regression - Regression Statistics | |
| Multiple R | 0.562763516761305 |
| R-squared | 0.316702775797552 |
| Adjusted R-squared | 0.278741818897416 |
| F-TEST (value) | 8.34285544041219 |
| F-TEST (DF numerator) | 3 |
| F-TEST (DF denominator) | 54 |
| p-value | 0.000118783409815082 |
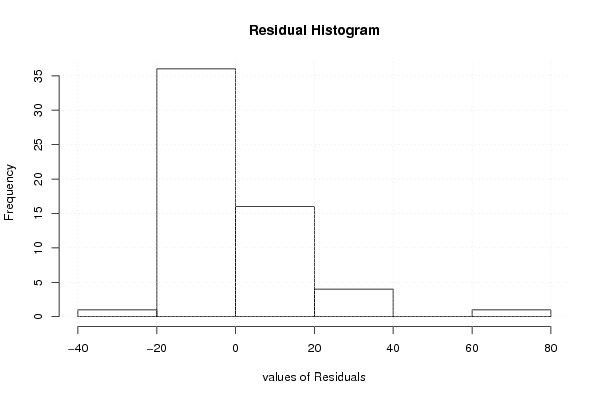
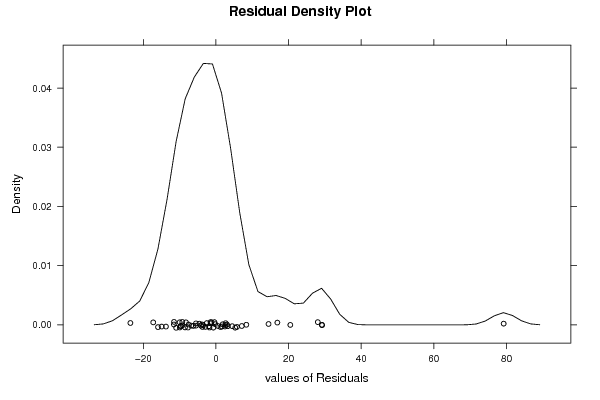
| Multiple Linear Regression - Residual Statistics | |
| Residual Standard Deviation | 15.4620120043801 |
| Sum Squared Residuals | 12909.9860220742 |
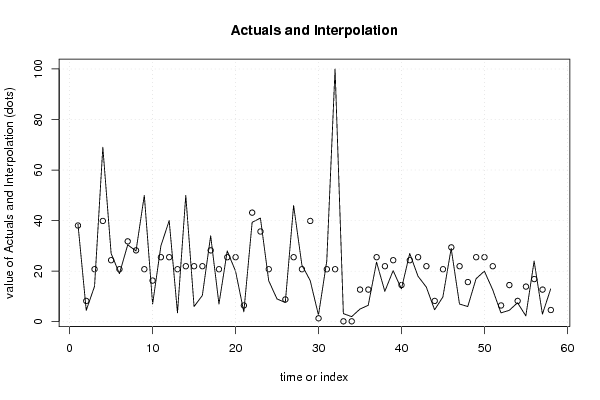
| Multiple Linear Regression - Actuals, Interpolation, and Residuals | |||
| Time or Index | Actuals | Interpolation Forecast | Residuals Prediction Error |
| 1 | 38.6 | 38.0659644428005 | 0.534035557199484 |
| 2 | 4.5 | 8.22425278904318 | -3.72425278904318 |
| 3 | 14 | 20.7686139368704 | -6.76861393687038 |
| 4 | 69 | 39.8614517370337 | 29.1385482629663 |
| 5 | 27 | 24.3333559554475 | 2.66664404455252 |
| 6 | 19 | 20.7686139368704 | -1.76861393687041 |
| 7 | 30.4 | 31.7937838688868 | -1.39378386888676 |
| 8 | 28 | 28.2290418503097 | -0.229041850309684 |
| 9 | 50 | 20.7686139368704 | 29.2313860631296 |
| 10 | 7 | 16.2656880873005 | -9.26568808730053 |
| 11 | 30 | 25.5216032949732 | 4.47839670502682 |
| 12 | 40 | 25.5216032949732 | 14.4783967050268 |
| 13 | 3.5 | 20.7686139368704 | -17.2686139368704 |
| 14 | 50 | 21.9568612763961 | 28.0431387236039 |
| 15 | 6 | 21.9568612763961 | -15.9568612763961 |
| 16 | 10.4 | 21.9568612763961 | -11.5568612763961 |
| 17 | 34 | 28.2290418503097 | 5.77095814969032 |
| 18 | 7 | 20.7686139368704 | -13.7686139368704 |
| 19 | 28 | 25.5216032949732 | 2.47839670502682 |
| 20 | 20 | 25.5216032949732 | -5.52160329497318 |
| 21 | 3.9 | 6.42876549480988 | -2.52876549480988 |
| 22 | 39.3 | 43.1498976771882 | -3.84989767718823 |
| 23 | 41 | 35.6894697637490 | 5.31053023625104 |
| 24 | 16.2 | 20.7686139368704 | -4.56861393687041 |
| 25 | 9 | -7.91108294725065 | 16.9110829472507 |
| 26 | 7.6 | 8.80526017386126 | -1.20526017386126 |
| 27 | 46 | 25.5216032949732 | 20.4783967050268 |
| 28 | 22.4 | 20.7686139368704 | 1.63138606312959 |
| 29 | 16.3 | 39.8614517370337 | -23.5614517370337 |
| 30 | 2.6 | 1.34483226042199 | 1.25516773957801 |
| 31 | 24 | 20.7686139368704 | 3.23138606312959 |
| 32 | 100 | 20.7686139368704 | 79.2313860631296 |
| 33 | 3.2 | 0.156584920896298 | 3.0434150791037 |
| 34 | 2 | 0.156584920896296 | 1.84341507910370 |
| 35 | 5 | 12.7009460687235 | -7.70094606872346 |
| 36 | 6.5 | 12.7009460687235 | -6.20094606872346 |
| 37 | 23.6 | 25.5216032949732 | -1.92160329497317 |
| 38 | 12 | 21.9568612763961 | -9.9568612763961 |
| 39 | 20.2 | 24.3333559554475 | -4.13335595544748 |
| 40 | 13 | 14.4964333629568 | -1.49643336295683 |
| 41 | 27 | 24.3333559554475 | 2.66664404455252 |
| 42 | 18 | 25.5216032949732 | -7.52160329497318 |
| 43 | 13.7 | 21.9568612763961 | -8.2568612763961 |
| 44 | 4.7 | 8.22425278904325 | -3.52425278904325 |
| 45 | 9.8 | 20.7686139368704 | -10.9686139368704 |
| 46 | 29 | 29.4172891898354 | -0.417289189835375 |
| 47 | 7 | 21.9568612763961 | -14.9568612763961 |
| 48 | 6 | 15.6846807024825 | -9.68468070248252 |
| 49 | 17 | 25.5216032949732 | -8.52160329497317 |
| 50 | 20 | 25.5216032949732 | -5.52160329497318 |
| 51 | 12.7 | 21.9568612763961 | -9.2568612763961 |
| 52 | 3.5 | 6.42876549480988 | -2.92876549480988 |
| 53 | 4.5 | 14.4964333629568 | -9.99643336295683 |
| 54 | 7.5 | 8.22425278904325 | -0.724252789043248 |
| 55 | 2.3 | 13.8891934082491 | -11.5891934082491 |
| 56 | 24 | 16.8729280420082 | 7.12707195799179 |
| 57 | 3 | 12.7009460687235 | -9.70094606872346 |
| 58 | 13 | 4.63327820057651 | 8.36672179942349 |
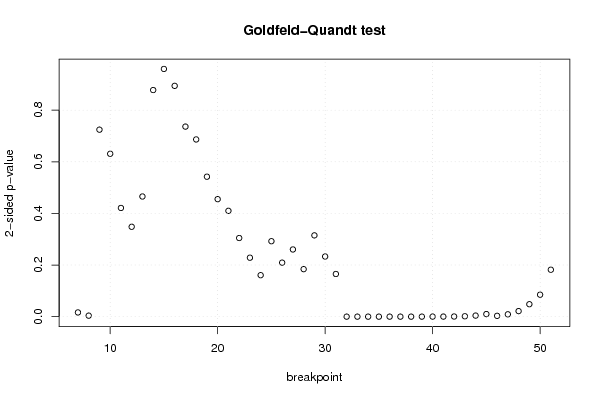
| Goldfeld-Quandt test for Heteroskedasticity | |||
| p-values | Alternative Hypothesis | ||
| breakpoint index | greater | 2-sided | less |
| 7 | 0.00815323170708075 | 0.0163064634141615 | 0.99184676829292 |
| 8 | 0.00191183854351187 | 0.00382367708702373 | 0.998088161456488 |
| 9 | 0.362139761492073 | 0.724279522984146 | 0.637860238507927 |
| 10 | 0.315480022123223 | 0.630960044246446 | 0.684519977876777 |
| 11 | 0.210513470586382 | 0.421026941172764 | 0.789486529413618 |
| 12 | 0.174071504126231 | 0.348143008252462 | 0.82592849587377 |
| 13 | 0.232707979333573 | 0.465415958667146 | 0.767292020666427 |
| 14 | 0.438903307459828 | 0.877806614919656 | 0.561096692540172 |
| 15 | 0.479756887037811 | 0.959513774075622 | 0.520243112962189 |
| 16 | 0.44702649200079 | 0.89405298400158 | 0.55297350799921 |
| 17 | 0.368076503456684 | 0.736153006913369 | 0.631923496543316 |
| 18 | 0.343219001787383 | 0.686438003574765 | 0.656780998212617 |
| 19 | 0.271034947850164 | 0.542069895700328 | 0.728965052149836 |
| 20 | 0.227558114784279 | 0.455116229568558 | 0.772441885215721 |
| 21 | 0.20498283068016 | 0.40996566136032 | 0.79501716931984 |
| 22 | 0.152296795155582 | 0.304593590311164 | 0.847703204844418 |
| 23 | 0.114156789886044 | 0.228313579772088 | 0.885843210113956 |
| 24 | 0.0803135502968284 | 0.160627100593657 | 0.919686449703172 |
| 25 | 0.146131716341785 | 0.292263432683570 | 0.853868283658215 |
| 26 | 0.104616831514972 | 0.209233663029945 | 0.895383168485028 |
| 27 | 0.130146159352980 | 0.260292318705959 | 0.86985384064702 |
| 28 | 0.0920021307241957 | 0.184004261448391 | 0.907997869275804 |
| 29 | 0.157453991612763 | 0.314907983225526 | 0.842546008387237 |
| 30 | 0.116490293006187 | 0.232980586012374 | 0.883509706993813 |
| 31 | 0.0826286799590133 | 0.165257359918027 | 0.917371320040987 |
| 32 | 0.999999990486445 | 1.90271103782769e-08 | 9.51355518913844e-09 |
| 33 | 0.999999963586228 | 7.28275449191597e-08 | 3.64137724595799e-08 |
| 34 | 0.999999864872038 | 2.70255924754785e-07 | 1.35127962377392e-07 |
| 35 | 0.99999959051007 | 8.18979859314991e-07 | 4.09489929657496e-07 |
| 36 | 0.999998661151374 | 2.67769725229317e-06 | 1.33884862614658e-06 |
| 37 | 0.99999567950415 | 8.64099170030567e-06 | 4.32049585015283e-06 |
| 38 | 0.999987934002366 | 2.41319952681617e-05 | 1.20659976340808e-05 |
| 39 | 0.999963726601876 | 7.25467962487549e-05 | 3.62733981243774e-05 |
| 40 | 0.999921809481005 | 0.00015638103799086 | 7.819051899543e-05 |
| 41 | 0.999892731251586 | 0.000214537496827278 | 0.000107268748413639 |
| 42 | 0.999722336208676 | 0.00055532758264759 | 0.000277663791323795 |
| 43 | 0.999245695500836 | 0.00150860899832805 | 0.000754304499164027 |
| 44 | 0.997972316073826 | 0.00405536785234797 | 0.00202768392617399 |
| 45 | 0.994999797273992 | 0.0100004054520155 | 0.00500020272600774 |
| 46 | 0.99843507259323 | 0.00312985481353982 | 0.00156492740676991 |
| 47 | 0.995468413907723 | 0.00906317218455415 | 0.00453158609227708 |
| 48 | 0.98926743953696 | 0.0214651209260818 | 0.0107325604630409 |
| 49 | 0.97592870671166 | 0.0481425865766807 | 0.0240712932883404 |
| 50 | 0.957488322230123 | 0.0850233555397548 | 0.0425116777698774 |
| 51 | 0.909143465584048 | 0.181713068831904 | 0.090856534415952 |
| Meta Analysis of Goldfeld-Quandt test for Heteroskedasticity | |||
| Description | # significant tests | % significant tests | OK/NOK |
| 1% type I error level | 16 | 0.355555555555556 | NOK |
| 5% type I error level | 20 | 0.444444444444444 | NOK |
| 10% type I error level | 21 | 0.466666666666667 | NOK |