Free Statistics

of Irreproducible Research!

Author's title

Author*The author of this computation has been verified*
R Software ModulePatrick.Wessarwasp_pairs.wasp
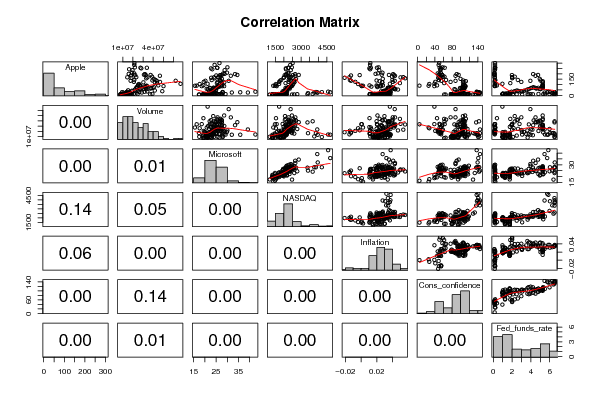
Title produced by softwareKendall tau Correlation Matrix
Date of computationMon, 13 Dec 2010 10:08:55 +0000
Cite this page as followsStatistical Computations at FreeStatistics.org, Office for Research Development and Education, URL https://freestatistics.org/blog/index.php?v=date/2010/Dec/13/t1292236320dq6nuaoonjk02zt.htm/, Retrieved Mon, 06 May 2024 18:50:39 +0000
Statistical Computations at FreeStatistics.org, Office for Research Development and Education, URL https://freestatistics.org/blog/index.php?pk=108793, Retrieved Mon, 06 May 2024 18:50:39 +0000
QR Codes:

Original text written by user:
IsPrivate?No (this computation is public)
User-defined keywords
Estimated Impact99
Family? (F = Feedback message, R = changed R code, M = changed R Module, P = changed Parameters, D = changed Data)
-     [Kendall tau Correlation Matrix] [] [2010-12-05 17:44:33] [b98453cac15ba1066b407e146608df68]
- R PD    [Kendall tau Correlation Matrix] [WS10 - Correlatio...] [2010-12-13 10:08:55] [ee4a783fb13f41eb2e9bc8a0c4f26279] [Current]
Feedback Forum

Post a new message
Dataseries X:
25.94	23688100	39.18	3940.35	0,0274	 144.7	5,45
28.66	13741000	35.78	4696.69	0,0322	 140.8	5,73
33.95	14143500	42.54	4572.83	0,0376	 137.1	5,85
31.01	16763800	27.92	3860.66	0,0307	 137.7	6,02
21.00	16634600	25.05	3400.91	0,0319	 144.7	6,27
26.19	13693300	32.03	3966.11	0,0373	 139.2	6,53
25.41	10545800	27.95	3766.99	0,0366	 143.0	6,54
30.47	9409900	27.95	4206.35	0,0341	 140.8	6,5
12.88	39182200	24.15	3672.82	0,0345	 142.5	6,52
9.78	37005800	27.57	3369.63	0,0345	 135.8	6,51
8.25	15818500	22.97	2597.93	0,0345	 132.6	6,51
7.44	16952000	17.37	2470.52	0,0339	 128.6	6,4
10.81	24563400	24.45	2772.73	0,0373	 115.7	5,98
9.12	14163200	23.62	2151.83	0,0353	 109.2	5,49
11.03	18184800	21.90	1840.26	0,0292	 116.9	5,31
12.74	20810300	27.12	2116.24	0,0327	 109.9	4,8
9.98	12843000	27.70	2110.49	0,0362	 116.1	4,21
11.62	13866700	29.23	2160.54	0,0325	 118.9	3,97
9.40	15119200	26.50	2027.13	0,0272	 116.3	3,77
9.27	8301600	22.84	1805.43	0,0272	 114.0	3,65
7.76	14039600	20.49	1498.80	0,0265	 97.0	3,07
8.78	12139700	23.28	1690.20	0,0213	 85.3	2,49
10.65	9649000	25.71	1930.58	0,019	 84.9	2,09
10.95	8513600	26.52	1950.40	0,0155	 94.6	1,82
12.36	15278600	25.51	1934.03	0,0114	 97.8	1,73
10.85	15590900	23.36	1731.49	0,0114	 95.0	1,74
11.84	9691100	24.15	1845.35	0,0148	 110.7	1,73
12.14	10882700	20.92	1688.23	0,0164	 108.5	1,75
11.65	10294800	20.38	1615.73	0,0118	 110.3	1,75
8.86	16031900	21.90	1463.21	0,0107	 106.3	1,75
7.63	13683600	19.21	1328.26	0,0146	 97.4	1,73
7.38	8677200	19.65	1314.85	0,018	 94.5	1,74
7.25	9874100	17.51	1172.06	0,0151	 93.7	1,75
8.03	10725500	21.41	1329.75	0,0203	 79.6	1,75
7.75	8348400	23.09	1478.78	0,022	 84.9	1,34
7.16	8046200	20.70	1335.51	0,0238	 80.7	1,24
7.18	10862300	19.00	1320.91	0,026	 78.8	1,24
7.51	8100300	19.04	1337.52	0,0298	 64.8	1,26
7.07	7287500	19.45	1341.17	0,0302	 61.4	1,25
7.11	14002500	20.54	1464.31	0,0222	 81.0	1,26
8.98	19037900	19.77	1595.91	0,0206	 83.6	1,26
9.53	10774600	20.60	1622.80	0,0211	 83.5	1,22
10.54	8960600	21.21	1735.02	0,0211	 77.0	1,01
11.31	7773300	21.30	1810.45	0,0216	 81.7	1,03
10.36	9579700	22.33	1786.94	0,0232	 77.0	1,01
11.44	11270700	21.12	1932.21	0,0204	 81.7	1,01
10.45	9492800	20.77	1960.26	0,0177	 92.5	1
10.69	9136800	22.11	2003.37	0,0188	 91.7	0,98
11.28	14487600	22.34	2066.15	0,0193	 96.4	1
11.96	10133200	21.43	2029.82	0,0169	 88.5	1,01
13.52	18659700	20.14	1994.22	0,0174	 88.5	1
12.89	15980700	21.11	1920.15	0,0229	 93.0	1
14.03	9732100	21.19	1986.74	0,0305	 93.1	1
16.27	14626300	23.07	2047.79	0,0327	 102.8	1,03
16.17	16904000	23.01	1887.36	0,0299	 105.7	1,26
17.25	13616700	22.12	1838.10	0,0265	 98.7	1,43
19.38	13772900	22.40	1896.84	0,0254	 96.7	1,61
26.20	28749200	22.66	1974.99	0,0319	 92.9	1,76
33.53	31408300	24.21	2096.81	0,0352	 92.6	1,93
32.20	26342800	24.13	2175.44	0,0326	 102.7	2,16
38.45	48909500	23.73	2062.41	0,0297	 105.1	2,28
44.86	41542400	22.79	2051.72	0,0301	 104.4	2,5
41.67	24857200	21.89	1999.23	0,0315	 103.0	2,63
36.06	34093700	22.92	1921.65	0,0351	 97.5	2,79
39.76	22555200	23.44	2068.22	0,028	 103.1	3
36.81	19067500	22.57	2056.96	0,0253	 106.2	3,04
42.65	19029100	23.27	2184.83	0,0317	 103.6	3,26
46.89	15223200	24.95	2152.09	0,0364	 105.5	3,5
53.61	21903700	23.45	2151.69	0,0469	 87.5	3,62
57.59	33306600	23.42	2120.30	0,0435	 85.2	3,78
67.82	23898100	25.30	2232.82	0,0346	 98.3	4
71.89	23279600	23.90	2205.32	0,0342	 103.8	4,16
75.51	40699800	25.73	2305.82	0,0399	 106.8	4,29
68.49	37646000	24.64	2281.39	0,036	 102.7	4,49
62.72	37277000	24.95	2339.79	0,0336	 107.5	4,59
70.39	39246800	22.15	2322.57	0,0355	 109.8	4,79
59.77	27418400	20.85	2178.88	0,0417	 104.7	4,94
57.27	30318700	21.45	2172.09	0,0432	 105.7	4,99
67.96	32808100	22.15	2091.47	0,0415	 107.0	5,24
67.85	28668200	23.75	2183.75	0,0382	 100.2	5,25
76.98	32370300	25.27	2258.43	0,0206	 105.9	5,25
81.08	24171100	26.53	2366.71	0,0131	 105.1	5,25
91.66	25009100	27.22	2431.77	0,0197	 105.3	5,25
84.84	32084300	27.69	2415.29	0,0254	 110.0	5,24
85.73	50117500	28.61	2463.93	0,0208	 110.2	5,25
84.61	27522200	26.21	2416.15	0,0242	 111.2	5,26
92.91	26816800	25.93	2421.64	0,0278	 108.2	5,26
99.80	25136100	27.86	2525.09	0,0257	 106.3	5,25
121.19	30295600	28.65	2604.52	0,0269	 108.5	5,25
122.04	41526100	27.51	2603.23	0,0269	 105.3	5,25
131.76	43845100	27.06	2546.27	0,0236	 111.9	5,26
138.48	39188900	26.91	2596.36	0,0197	 105.6	5,02
153.47	40496400	27.60	2701.50	0,0276	 99.5	4,94
189.95	37438400	34.48	2859.12	0,0354	 95.2	4,76
182.22	46553700	31.58	2660.96	0,0431	 87.8	4,49
198.08	31771400	33.46	2652.28	0,0408	 90.6	4,24
135.36	62108100	30.64	2389.86	0,0428	 87.9	3,94
125.02	46645400	25.66	2271.48	0,0403	 76.4	2,98
143.50	42313100	26.78	2279.10	0,0398	 65.9	2,61
173.95	38841700	26.91	2412.80	0,0394	 62.3	2,28
188.75	32650300	26.82	2522.66	0,0418	 57.2	1,98
167.44	34281100	26.05	2292.98	0,0502	 50.4	2
158.95	33096200	24.36	2325.55	0,056	 51.9	2,01
169.53	23273800	25.94	2367.52	0,0537	 58.5	2
113.66	43697600	25.37	2091.88	0,0494	 61.4	1,81
107.59	66902300	21.23	1720.95	0,0366	 38.8	0,97
92.67	44957200	19.35	1535.57	0,0107	 44.9	0,39
85.35	33800900	18.61	1577.03	0,0009	 38.6	0,16
90.13	33487900	16.37	1476.42	0,0003	 4.0	0,15
89.31	27394900	15.56	1377.84	0,0024	 25.3	0,22
105.12	25963400	17.70	1528.59	-0,0038	 26.9	0,18
125.83	20952600	19.52	1717.30	-0,0074	 40.8	0,15
135.81	17702900	20.26	1774.33	-0,0128	 54.8	0,18
142.43	21282100	23.05	1835.04	-0,0143	 49.3	0,21
163.39	18449100	22.81	1978.50	-0,021	 47.4	0,16
168.21	14415700	24.04	2009.06	-0,0148	 54.5	0,16
185.35	17906300	25.08	2122.42	-0,0129	 53.4	0,15
188.50	22197500	27.04	2045.11	-0,0018	 48.7	0,12
199.91	15856500	28.81	2144.60	0,0184	 50.6	0,12
210.73	19068700	29.86	2269.15	0,0272	 53.6	0,12
192.06	30855100	27.61	2147.35	0,0263	 56.5	0,11
204.62	21209000	28.22	2238.26	0,0214	 46.4	0,13
235.00	19541600	28.83	2397.96	0,0231	 52.3	0,16
261.09	21955000	30.06	2461.19	0,0224	 57.7	0,2
256.88	33725900	25.51	2257.04	0,0202	 62.7	0,2
251.53	28192800	22.75	2109.24	0,0105	 54.3	0,18
257.25	27377000	25.52	2254.70	0,0124	 51.0	0,18
243.10	16228100	23.33	2114.03	0,0115	 53.2	0,19
283.75	21278900	24.34	2368.62	0,0114	 48.6	0,19
300.98	21457400	26.51	2507.41	0,0117	 49.9	0,19


Summary of computational transaction
Raw Inputview raw input (R code)
Raw Outputview raw output of R engine
Computing time4 seconds
R Server'George Udny Yule' @ 72.249.76.132

\begin{tabular}{lllllllll}
\hline
Summary of computational transaction \tabularnewline
Raw Input & view raw input (R code)  \tabularnewline
Raw Output & view raw output of R engine  \tabularnewline
Computing time & 4 seconds \tabularnewline
R Server & 'George Udny Yule' @ 72.249.76.132 \tabularnewline
\hline
\end{tabular}
%Source: https://freestatistics.org/blog/index.php?pk=108793&T=0

[TABLE]
[ROW][C]Summary of computational transaction[/C][/ROW]
[ROW][C]Raw Input[/C][C]view raw input (R code) [/C][/ROW]
[ROW][C]Raw Output[/C][C]view raw output of R engine [/C][/ROW]
[ROW][C]Computing time[/C][C]4 seconds[/C][/ROW]
[ROW][C]R Server[/C][C]'George Udny Yule' @ 72.249.76.132[/C][/ROW]
[/TABLE]
Source: https://freestatistics.org/blog/index.php?pk=108793&T=0

Globally Unique Identifier (entire table): ba.freestatistics.org/blog/index.php?pk=108793&T=0

As an alternative you can also use a QR Code:  

The GUIDs for individual cells are displayed in the table below:

Summary of computational transaction
Raw Inputview raw input (R code)
Raw Outputview raw output of R engine
Computing time4 seconds
R Server'George Udny Yule' @ 72.249.76.132


Correlations for all pairs of data series (method=pearson)
AppleVolumeMicrosoftNASDAQInflationCons_confidenceFed_funds_rate
Apple10.4180.3230.129-0.163-0.59-0.291
Volume0.41810.2150.1710.297-0.130.226
Microsoft0.3230.21510.7680.3220.3350.438
NASDAQ0.1290.1710.76810.360.5350.649
Inflation-0.1630.2970.3220.3610.4360.548
Cons_confidence-0.59-0.130.3350.5350.43610.813
Fed_funds_rate-0.2910.2260.4380.6490.5480.8131

\begin{tabular}{lllllllll}
\hline
Correlations for all pairs of data series (method=pearson) \tabularnewline
  & Apple & Volume & Microsoft & NASDAQ & Inflation & Cons_confidence & Fed_funds_rate \tabularnewline
Apple & 1 & 0.418 & 0.323 & 0.129 & -0.163 & -0.59 & -0.291 \tabularnewline
Volume & 0.418 & 1 & 0.215 & 0.171 & 0.297 & -0.13 & 0.226 \tabularnewline
Microsoft & 0.323 & 0.215 & 1 & 0.768 & 0.322 & 0.335 & 0.438 \tabularnewline
NASDAQ & 0.129 & 0.171 & 0.768 & 1 & 0.36 & 0.535 & 0.649 \tabularnewline
Inflation & -0.163 & 0.297 & 0.322 & 0.36 & 1 & 0.436 & 0.548 \tabularnewline
Cons_confidence & -0.59 & -0.13 & 0.335 & 0.535 & 0.436 & 1 & 0.813 \tabularnewline
Fed_funds_rate & -0.291 & 0.226 & 0.438 & 0.649 & 0.548 & 0.813 & 1 \tabularnewline
\hline
\end{tabular}
%Source: https://freestatistics.org/blog/index.php?pk=108793&T=1

[TABLE]
[ROW][C]Correlations for all pairs of data series (method=pearson)[/C][/ROW]
[ROW][C] [/C][C]Apple[/C][C]Volume[/C][C]Microsoft[/C][C]NASDAQ[/C][C]Inflation[/C][C]Cons_confidence[/C][C]Fed_funds_rate[/C][/ROW]
[ROW][C]Apple[/C][C]1[/C][C]0.418[/C][C]0.323[/C][C]0.129[/C][C]-0.163[/C][C]-0.59[/C][C]-0.291[/C][/ROW]
[ROW][C]Volume[/C][C]0.418[/C][C]1[/C][C]0.215[/C][C]0.171[/C][C]0.297[/C][C]-0.13[/C][C]0.226[/C][/ROW]
[ROW][C]Microsoft[/C][C]0.323[/C][C]0.215[/C][C]1[/C][C]0.768[/C][C]0.322[/C][C]0.335[/C][C]0.438[/C][/ROW]
[ROW][C]NASDAQ[/C][C]0.129[/C][C]0.171[/C][C]0.768[/C][C]1[/C][C]0.36[/C][C]0.535[/C][C]0.649[/C][/ROW]
[ROW][C]Inflation[/C][C]-0.163[/C][C]0.297[/C][C]0.322[/C][C]0.36[/C][C]1[/C][C]0.436[/C][C]0.548[/C][/ROW]
[ROW][C]Cons_confidence[/C][C]-0.59[/C][C]-0.13[/C][C]0.335[/C][C]0.535[/C][C]0.436[/C][C]1[/C][C]0.813[/C][/ROW]
[ROW][C]Fed_funds_rate[/C][C]-0.291[/C][C]0.226[/C][C]0.438[/C][C]0.649[/C][C]0.548[/C][C]0.813[/C][C]1[/C][/ROW]
[/TABLE]
Source: https://freestatistics.org/blog/index.php?pk=108793&T=1

Globally Unique Identifier (entire table): ba.freestatistics.org/blog/index.php?pk=108793&T=1

As an alternative you can also use a QR Code:  

The GUIDs for individual cells are displayed in the table below:

Correlations for all pairs of data series (method=pearson)
AppleVolumeMicrosoftNASDAQInflationCons_confidenceFed_funds_rate
Apple10.4180.3230.129-0.163-0.59-0.291
Volume0.41810.2150.1710.297-0.130.226
Microsoft0.3230.21510.7680.3220.3350.438
NASDAQ0.1290.1710.76810.360.5350.649
Inflation-0.1630.2970.3220.3610.4360.548
Cons_confidence-0.59-0.130.3350.5350.43610.813
Fed_funds_rate-0.2910.2260.4380.6490.5480.8131


Correlations for all pairs of data series with p-values
pairPearson rSpearman rhoKendall tau
Apple;Volume0.41770.6570.4509
p-value(0)(0)(0)
Apple;Microsoft0.32350.48060.3489
p-value(2e-04)(0)(0)
Apple;NASDAQ0.1290.47730.3665
p-value(0.1436)(0)(0)
Apple;Inflation-0.1630.00990.0283
p-value(0.0638)(0.9113)(0.6334)
Apple;Cons_confidence-0.5898-0.4087-0.2318
p-value(0)(0)(1e-04)
Apple;Fed_funds_rate-0.2913-0.1938-0.1041
p-value(8e-04)(0.0272)(0.0806)
Volume;Microsoft0.2150.32040.22
p-value(0.014)(2e-04)(2e-04)
Volume;NASDAQ0.1710.46160.3269
p-value(0.0517)(0)(0)
Volume;Inflation0.29670.33650.2191
p-value(6e-04)(1e-04)(2e-04)
Volume;Cons_confidence-0.13-0.0633-0.0344
p-value(0.1404)(0.4745)(0.5622)
Volume;Fed_funds_rate0.22560.22680.1344
p-value(0.0099)(0.0095)(0.0241)
Microsoft;NASDAQ0.7680.80160.6273
p-value(0)(0)(0)
Microsoft;Inflation0.32210.34250.2363
p-value(2e-04)(1e-04)(1e-04)
Microsoft;Cons_confidence0.33490.27530.2045
p-value(1e-04)(0.0015)(6e-04)
Microsoft;Fed_funds_rate0.43820.40490.3006
p-value(0)(0)(0)
NASDAQ;Inflation0.36010.4940.3282
p-value(0)(0)(0)
NASDAQ;Cons_confidence0.53490.42050.3008
p-value(0)(0)(0)
NASDAQ;Fed_funds_rate0.64860.60950.4338
p-value(0)(0)(0)
Inflation;Cons_confidence0.43610.36640.2466
p-value(0)(0)(0)
Inflation;Fed_funds_rate0.5480.61080.4216
p-value(0)(0)(0)
Cons_confidence;Fed_funds_rate0.81330.84010.6546
p-value(0)(0)(0)

\begin{tabular}{lllllllll}
\hline
Correlations for all pairs of data series with p-values \tabularnewline
pair & Pearson r & Spearman rho & Kendall tau \tabularnewline
Apple;Volume & 0.4177 & 0.657 & 0.4509 \tabularnewline
p-value & (0) & (0) & (0) \tabularnewline
Apple;Microsoft & 0.3235 & 0.4806 & 0.3489 \tabularnewline
p-value & (2e-04) & (0) & (0) \tabularnewline
Apple;NASDAQ & 0.129 & 0.4773 & 0.3665 \tabularnewline
p-value & (0.1436) & (0) & (0) \tabularnewline
Apple;Inflation & -0.163 & 0.0099 & 0.0283 \tabularnewline
p-value & (0.0638) & (0.9113) & (0.6334) \tabularnewline
Apple;Cons_confidence & -0.5898 & -0.4087 & -0.2318 \tabularnewline
p-value & (0) & (0) & (1e-04) \tabularnewline
Apple;Fed_funds_rate & -0.2913 & -0.1938 & -0.1041 \tabularnewline
p-value & (8e-04) & (0.0272) & (0.0806) \tabularnewline
Volume;Microsoft & 0.215 & 0.3204 & 0.22 \tabularnewline
p-value & (0.014) & (2e-04) & (2e-04) \tabularnewline
Volume;NASDAQ & 0.171 & 0.4616 & 0.3269 \tabularnewline
p-value & (0.0517) & (0) & (0) \tabularnewline
Volume;Inflation & 0.2967 & 0.3365 & 0.2191 \tabularnewline
p-value & (6e-04) & (1e-04) & (2e-04) \tabularnewline
Volume;Cons_confidence & -0.13 & -0.0633 & -0.0344 \tabularnewline
p-value & (0.1404) & (0.4745) & (0.5622) \tabularnewline
Volume;Fed_funds_rate & 0.2256 & 0.2268 & 0.1344 \tabularnewline
p-value & (0.0099) & (0.0095) & (0.0241) \tabularnewline
Microsoft;NASDAQ & 0.768 & 0.8016 & 0.6273 \tabularnewline
p-value & (0) & (0) & (0) \tabularnewline
Microsoft;Inflation & 0.3221 & 0.3425 & 0.2363 \tabularnewline
p-value & (2e-04) & (1e-04) & (1e-04) \tabularnewline
Microsoft;Cons_confidence & 0.3349 & 0.2753 & 0.2045 \tabularnewline
p-value & (1e-04) & (0.0015) & (6e-04) \tabularnewline
Microsoft;Fed_funds_rate & 0.4382 & 0.4049 & 0.3006 \tabularnewline
p-value & (0) & (0) & (0) \tabularnewline
NASDAQ;Inflation & 0.3601 & 0.494 & 0.3282 \tabularnewline
p-value & (0) & (0) & (0) \tabularnewline
NASDAQ;Cons_confidence & 0.5349 & 0.4205 & 0.3008 \tabularnewline
p-value & (0) & (0) & (0) \tabularnewline
NASDAQ;Fed_funds_rate & 0.6486 & 0.6095 & 0.4338 \tabularnewline
p-value & (0) & (0) & (0) \tabularnewline
Inflation;Cons_confidence & 0.4361 & 0.3664 & 0.2466 \tabularnewline
p-value & (0) & (0) & (0) \tabularnewline
Inflation;Fed_funds_rate & 0.548 & 0.6108 & 0.4216 \tabularnewline
p-value & (0) & (0) & (0) \tabularnewline
Cons_confidence;Fed_funds_rate & 0.8133 & 0.8401 & 0.6546 \tabularnewline
p-value & (0) & (0) & (0) \tabularnewline
\hline
\end{tabular}
%Source: https://freestatistics.org/blog/index.php?pk=108793&T=2

[TABLE]
[ROW][C]Correlations for all pairs of data series with p-values[/C][/ROW]
[ROW][C]pair[/C][C]Pearson r[/C][C]Spearman rho[/C][C]Kendall tau[/C][/ROW]
[ROW][C]Apple;Volume[/C][C]0.4177[/C][C]0.657[/C][C]0.4509[/C][/ROW]
[ROW][C]p-value[/C][C](0)[/C][C](0)[/C][C](0)[/C][/ROW]
[ROW][C]Apple;Microsoft[/C][C]0.3235[/C][C]0.4806[/C][C]0.3489[/C][/ROW]
[ROW][C]p-value[/C][C](2e-04)[/C][C](0)[/C][C](0)[/C][/ROW]
[ROW][C]Apple;NASDAQ[/C][C]0.129[/C][C]0.4773[/C][C]0.3665[/C][/ROW]
[ROW][C]p-value[/C][C](0.1436)[/C][C](0)[/C][C](0)[/C][/ROW]
[ROW][C]Apple;Inflation[/C][C]-0.163[/C][C]0.0099[/C][C]0.0283[/C][/ROW]
[ROW][C]p-value[/C][C](0.0638)[/C][C](0.9113)[/C][C](0.6334)[/C][/ROW]
[ROW][C]Apple;Cons_confidence[/C][C]-0.5898[/C][C]-0.4087[/C][C]-0.2318[/C][/ROW]
[ROW][C]p-value[/C][C](0)[/C][C](0)[/C][C](1e-04)[/C][/ROW]
[ROW][C]Apple;Fed_funds_rate[/C][C]-0.2913[/C][C]-0.1938[/C][C]-0.1041[/C][/ROW]
[ROW][C]p-value[/C][C](8e-04)[/C][C](0.0272)[/C][C](0.0806)[/C][/ROW]
[ROW][C]Volume;Microsoft[/C][C]0.215[/C][C]0.3204[/C][C]0.22[/C][/ROW]
[ROW][C]p-value[/C][C](0.014)[/C][C](2e-04)[/C][C](2e-04)[/C][/ROW]
[ROW][C]Volume;NASDAQ[/C][C]0.171[/C][C]0.4616[/C][C]0.3269[/C][/ROW]
[ROW][C]p-value[/C][C](0.0517)[/C][C](0)[/C][C](0)[/C][/ROW]
[ROW][C]Volume;Inflation[/C][C]0.2967[/C][C]0.3365[/C][C]0.2191[/C][/ROW]
[ROW][C]p-value[/C][C](6e-04)[/C][C](1e-04)[/C][C](2e-04)[/C][/ROW]
[ROW][C]Volume;Cons_confidence[/C][C]-0.13[/C][C]-0.0633[/C][C]-0.0344[/C][/ROW]
[ROW][C]p-value[/C][C](0.1404)[/C][C](0.4745)[/C][C](0.5622)[/C][/ROW]
[ROW][C]Volume;Fed_funds_rate[/C][C]0.2256[/C][C]0.2268[/C][C]0.1344[/C][/ROW]
[ROW][C]p-value[/C][C](0.0099)[/C][C](0.0095)[/C][C](0.0241)[/C][/ROW]
[ROW][C]Microsoft;NASDAQ[/C][C]0.768[/C][C]0.8016[/C][C]0.6273[/C][/ROW]
[ROW][C]p-value[/C][C](0)[/C][C](0)[/C][C](0)[/C][/ROW]
[ROW][C]Microsoft;Inflation[/C][C]0.3221[/C][C]0.3425[/C][C]0.2363[/C][/ROW]
[ROW][C]p-value[/C][C](2e-04)[/C][C](1e-04)[/C][C](1e-04)[/C][/ROW]
[ROW][C]Microsoft;Cons_confidence[/C][C]0.3349[/C][C]0.2753[/C][C]0.2045[/C][/ROW]
[ROW][C]p-value[/C][C](1e-04)[/C][C](0.0015)[/C][C](6e-04)[/C][/ROW]
[ROW][C]Microsoft;Fed_funds_rate[/C][C]0.4382[/C][C]0.4049[/C][C]0.3006[/C][/ROW]
[ROW][C]p-value[/C][C](0)[/C][C](0)[/C][C](0)[/C][/ROW]
[ROW][C]NASDAQ;Inflation[/C][C]0.3601[/C][C]0.494[/C][C]0.3282[/C][/ROW]
[ROW][C]p-value[/C][C](0)[/C][C](0)[/C][C](0)[/C][/ROW]
[ROW][C]NASDAQ;Cons_confidence[/C][C]0.5349[/C][C]0.4205[/C][C]0.3008[/C][/ROW]
[ROW][C]p-value[/C][C](0)[/C][C](0)[/C][C](0)[/C][/ROW]
[ROW][C]NASDAQ;Fed_funds_rate[/C][C]0.6486[/C][C]0.6095[/C][C]0.4338[/C][/ROW]
[ROW][C]p-value[/C][C](0)[/C][C](0)[/C][C](0)[/C][/ROW]
[ROW][C]Inflation;Cons_confidence[/C][C]0.4361[/C][C]0.3664[/C][C]0.2466[/C][/ROW]
[ROW][C]p-value[/C][C](0)[/C][C](0)[/C][C](0)[/C][/ROW]
[ROW][C]Inflation;Fed_funds_rate[/C][C]0.548[/C][C]0.6108[/C][C]0.4216[/C][/ROW]
[ROW][C]p-value[/C][C](0)[/C][C](0)[/C][C](0)[/C][/ROW]
[ROW][C]Cons_confidence;Fed_funds_rate[/C][C]0.8133[/C][C]0.8401[/C][C]0.6546[/C][/ROW]
[ROW][C]p-value[/C][C](0)[/C][C](0)[/C][C](0)[/C][/ROW]
[/TABLE]
Source: https://freestatistics.org/blog/index.php?pk=108793&T=2

Globally Unique Identifier (entire table): ba.freestatistics.org/blog/index.php?pk=108793&T=2

As an alternative you can also use a QR Code:  

The GUIDs for individual cells are displayed in the table below:

Correlations for all pairs of data series with p-values
pairPearson rSpearman rhoKendall tau
Apple;Volume0.41770.6570.4509
p-value(0)(0)(0)
Apple;Microsoft0.32350.48060.3489
p-value(2e-04)(0)(0)
Apple;NASDAQ0.1290.47730.3665
p-value(0.1436)(0)(0)
Apple;Inflation-0.1630.00990.0283
p-value(0.0638)(0.9113)(0.6334)
Apple;Cons_confidence-0.5898-0.4087-0.2318
p-value(0)(0)(1e-04)
Apple;Fed_funds_rate-0.2913-0.1938-0.1041
p-value(8e-04)(0.0272)(0.0806)
Volume;Microsoft0.2150.32040.22
p-value(0.014)(2e-04)(2e-04)
Volume;NASDAQ0.1710.46160.3269
p-value(0.0517)(0)(0)
Volume;Inflation0.29670.33650.2191
p-value(6e-04)(1e-04)(2e-04)
Volume;Cons_confidence-0.13-0.0633-0.0344
p-value(0.1404)(0.4745)(0.5622)
Volume;Fed_funds_rate0.22560.22680.1344
p-value(0.0099)(0.0095)(0.0241)
Microsoft;NASDAQ0.7680.80160.6273
p-value(0)(0)(0)
Microsoft;Inflation0.32210.34250.2363
p-value(2e-04)(1e-04)(1e-04)
Microsoft;Cons_confidence0.33490.27530.2045
p-value(1e-04)(0.0015)(6e-04)
Microsoft;Fed_funds_rate0.43820.40490.3006
p-value(0)(0)(0)
NASDAQ;Inflation0.36010.4940.3282
p-value(0)(0)(0)
NASDAQ;Cons_confidence0.53490.42050.3008
p-value(0)(0)(0)
NASDAQ;Fed_funds_rate0.64860.60950.4338
p-value(0)(0)(0)
Inflation;Cons_confidence0.43610.36640.2466
p-value(0)(0)(0)
Inflation;Fed_funds_rate0.5480.61080.4216
p-value(0)(0)(0)
Cons_confidence;Fed_funds_rate0.81330.84010.6546
p-value(0)(0)(0)


Parameters (Session):
par1 = pearson ;
Parameters (R input):
par1 = pearson ;
R code (references can be found in the software module):
panel.tau <- function(x, y, digits=2, prefix='', cex.cor)
{
usr <- par('usr'); on.exit(par(usr))
par(usr = c(0, 1, 0, 1))
rr <- cor.test(x, y, method=par1)
r <- round(rr$p.value,2)
txt <- format(c(r, 0.123456789), digits=digits)[1]
txt <- paste(prefix, txt, sep='')
if(missing(cex.cor)) cex <- 0.5/strwidth(txt)
text(0.5, 0.5, txt, cex = cex)
}
panel.hist <- function(x, ...)
{
usr <- par('usr'); on.exit(par(usr))
par(usr = c(usr[1:2], 0, 1.5) )
h <- hist(x, plot = FALSE)
breaks <- h$breaks; nB <- length(breaks)
y <- h$counts; y <- y/max(y)
rect(breaks[-nB], 0, breaks[-1], y, col='grey', ...)
}
bitmap(file='test1.png')
pairs(t(y),diag.panel=panel.hist, upper.panel=panel.smooth, lower.panel=panel.tau, main=main)
dev.off()
load(file='createtable')
n <- length(y[,1])
n
a<-table.start()
a<-table.row.start(a)
a<-table.element(a,paste('Correlations for all pairs of data series (method=',par1,')',sep=''),n+1,TRUE)
a<-table.row.end(a)
a<-table.row.start(a)
a<-table.element(a,' ',header=TRUE)
for (i in 1:n) {
a<-table.element(a,dimnames(t(x))[[2]][i],header=TRUE)
}
a<-table.row.end(a)
for (i in 1:n) {
a<-table.row.start(a)
a<-table.element(a,dimnames(t(x))[[2]][i],header=TRUE)
for (j in 1:n) {
r <- cor.test(y[i,],y[j,],method=par1)
a<-table.element(a,round(r$estimate,3))
}
a<-table.row.end(a)
}
a<-table.end(a)
table.save(a,file='mytable.tab')
a<-table.start()
a<-table.row.start(a)
a<-table.element(a,'Correlations for all pairs of data series with p-values',4,TRUE)
a<-table.row.end(a)
a<-table.row.start(a)
a<-table.element(a,'pair',1,TRUE)
a<-table.element(a,'Pearson r',1,TRUE)
a<-table.element(a,'Spearman rho',1,TRUE)
a<-table.element(a,'Kendall tau',1,TRUE)
a<-table.row.end(a)
cor.test(y[1,],y[2,],method=par1)
for (i in 1:(n-1))
{
for (j in (i+1):n)
{
a<-table.row.start(a)
dum <- paste(dimnames(t(x))[[2]][i],';',dimnames(t(x))[[2]][j],sep='')
a<-table.element(a,dum,header=TRUE)
rp <- cor.test(y[i,],y[j,],method='pearson')
a<-table.element(a,round(rp$estimate,4))
rs <- cor.test(y[i,],y[j,],method='spearman')
a<-table.element(a,round(rs$estimate,4))
rk <- cor.test(y[i,],y[j,],method='kendall')
a<-table.element(a,round(rk$estimate,4))
a<-table.row.end(a)
a<-table.row.start(a)
a<-table.element(a,'p-value',header=T)
a<-table.element(a,paste('(',round(rp$p.value,4),')',sep=''))
a<-table.element(a,paste('(',round(rs$p.value,4),')',sep=''))
a<-table.element(a,paste('(',round(rk$p.value,4),')',sep=''))
a<-table.row.end(a)
}
}
a<-table.end(a)
table.save(a,file='mytable1.tab')