| Tabulation of Results | ||
| Tnfm x Stat | ||
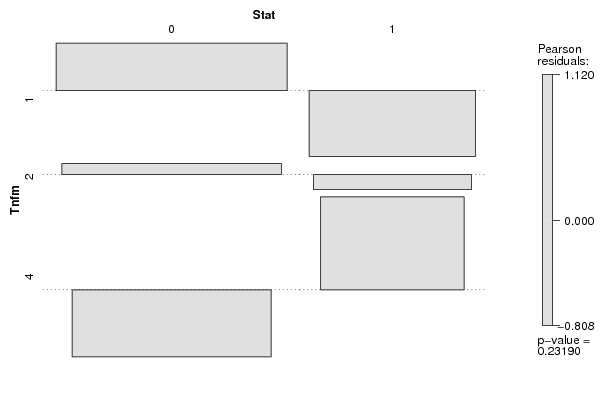
| 0 | 1 | 1 | 23 | 8 | 2 | 19 | 9 | 4 | 12 | 11 |
| Tabulation of Expected Results | ||
| Tnfm x Stat | ||
| 0 | 1 | 1 | 20.41 | 10.59 | 2 | 18.44 | 9.56 | 4 | 15.15 | 7.85 |
| Statistical Results | |
| Pearson's Chi-squared test with simulated p-value (based on 2000 replicates) | |
| Exact Pearson Chi Square Statistic | 2.92 |
| P value | 0.26 |