Free Statistics

of Irreproducible Research!

Author's title

Author*The author of this computation has been verified*
R Software Modulerwasp_autocorrelation.wasp
Title produced by software(Partial) Autocorrelation Function
Date of computationMon, 13 Dec 2010 09:59:22 +0000
Cite this page as followsStatistical Computations at FreeStatistics.org, Office for Research Development and Education, URL https://freestatistics.org/blog/index.php?v=date/2010/Dec/13/t129223440558kd9mkoxyee7h6.htm/, Retrieved Mon, 06 May 2024 22:22:25 +0000
Statistical Computations at FreeStatistics.org, Office for Research Development and Education, URL https://freestatistics.org/blog/index.php?pk=108745, Retrieved Mon, 06 May 2024 22:22:25 +0000
QR Codes:

Original text written by user:
IsPrivate?No (this computation is public)
User-defined keywords
Estimated Impact154
Family? (F = Feedback message, R = changed R code, M = changed R Module, P = changed Parameters, D = changed Data)
-     [(Partial) Autocorrelation Function] [] [2010-12-13 08:35:23] [21eff0c210342db4afbdafe426a7c254]
-   PD  [(Partial) Autocorrelation Function] [] [2010-12-13 09:29:04] [21eff0c210342db4afbdafe426a7c254]
-    D      [(Partial) Autocorrelation Function] [] [2010-12-13 09:59:22] [81d69fb83507cea26168920232cdff1b] [Current]
Feedback Forum

Post a new message
Dataseries X:
31293
30236
30160
32436
30695
27525
26434
25739
25204
24977
24320
22680
22052
21467
21383
21777
21928
21814
22937
23595
20830
19650
19195
19644
18483
18079
19178
18391
18441
18584
20108
20148
19394
17745
17696
17032
16438
15683
15594
15713
15937
16171
15928
16348
15579
15305
15648
14954
15137
15839
16050
15168
17064
16005
14886
14931
14544
13812


Summary of computational transaction
Raw Inputview raw input (R code)
Raw Outputview raw output of R engine
Computing time2 seconds
R Server'Sir Ronald Aylmer Fisher' @ 193.190.124.24

\begin{tabular}{lllllllll}
\hline
Summary of computational transaction \tabularnewline
Raw Input & view raw input (R code)  \tabularnewline
Raw Output & view raw output of R engine  \tabularnewline
Computing time & 2 seconds \tabularnewline
R Server & 'Sir Ronald Aylmer Fisher' @ 193.190.124.24 \tabularnewline
\hline
\end{tabular}
%Source: https://freestatistics.org/blog/index.php?pk=108745&T=0

[TABLE]
[ROW][C]Summary of computational transaction[/C][/ROW]
[ROW][C]Raw Input[/C][C]view raw input (R code) [/C][/ROW]
[ROW][C]Raw Output[/C][C]view raw output of R engine [/C][/ROW]
[ROW][C]Computing time[/C][C]2 seconds[/C][/ROW]
[ROW][C]R Server[/C][C]'Sir Ronald Aylmer Fisher' @ 193.190.124.24[/C][/ROW]
[/TABLE]
Source: https://freestatistics.org/blog/index.php?pk=108745&T=0

Globally Unique Identifier (entire table): ba.freestatistics.org/blog/index.php?pk=108745&T=0

As an alternative you can also use a QR Code:  

The GUIDs for individual cells are displayed in the table below:

Summary of computational transaction
Raw Inputview raw input (R code)
Raw Outputview raw output of R engine
Computing time2 seconds
R Server'Sir Ronald Aylmer Fisher' @ 193.190.124.24


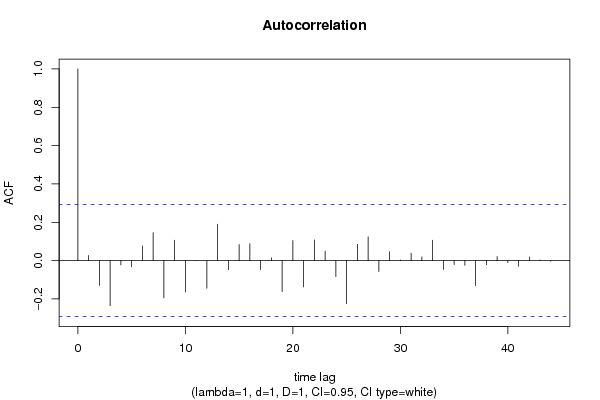
Autocorrelation Function
Time lag kACF(k)T-STATP-value
10.0270180.18120.428497
2-0.129154-0.86640.195436
3-0.234797-1.57510.061123
4-0.02222-0.14910.441088
5-0.032196-0.2160.414992
60.0760410.51010.306237
70.145380.97520.167327
8-0.195052-1.30850.098682
90.1065310.71460.239264
10-0.163883-1.09940.138729
11-2.2e-05-1e-040.499942
12-0.143882-0.96520.169804
130.1904991.27790.103918
14-0.047453-0.31830.375855
150.0838110.56220.288377
160.0887580.59540.277277
17-0.045918-0.3080.379742
180.0145470.09760.461347
19-0.16105-1.08040.142869
200.1044620.70080.243532
21-0.137138-0.920.181252
220.1077190.72260.236832
230.0490930.32930.371718
24-0.082554-0.55380.291232
25-0.224366-1.50510.069644
260.0851530.57120.285345
270.1250560.83890.20298
28-0.057107-0.38310.351731
290.0461450.30960.379165
300.0037190.02490.490103
310.0383340.25720.399116
320.0197080.13220.447706
330.1068890.7170.23853
34-0.045635-0.30610.38046
35-0.0198-0.13280.447464
36-0.02452-0.16450.435044
37-0.130251-0.87380.193446
38-0.022051-0.14790.441531
390.0209650.14060.444391
40-0.009823-0.06590.473878
41-0.029161-0.19560.422895
420.0184120.12350.451125
430.0029730.01990.492087
44-0.003184-0.02140.491527
45NANANA
46NANANA
47NANANA
48NANANA

\begin{tabular}{lllllllll}
\hline
Autocorrelation Function \tabularnewline
Time lag k & ACF(k) & T-STAT & P-value \tabularnewline
1 & 0.027018 & 0.1812 & 0.428497 \tabularnewline
2 & -0.129154 & -0.8664 & 0.195436 \tabularnewline
3 & -0.234797 & -1.5751 & 0.061123 \tabularnewline
4 & -0.02222 & -0.1491 & 0.441088 \tabularnewline
5 & -0.032196 & -0.216 & 0.414992 \tabularnewline
6 & 0.076041 & 0.5101 & 0.306237 \tabularnewline
7 & 0.14538 & 0.9752 & 0.167327 \tabularnewline
8 & -0.195052 & -1.3085 & 0.098682 \tabularnewline
9 & 0.106531 & 0.7146 & 0.239264 \tabularnewline
10 & -0.163883 & -1.0994 & 0.138729 \tabularnewline
11 & -2.2e-05 & -1e-04 & 0.499942 \tabularnewline
12 & -0.143882 & -0.9652 & 0.169804 \tabularnewline
13 & 0.190499 & 1.2779 & 0.103918 \tabularnewline
14 & -0.047453 & -0.3183 & 0.375855 \tabularnewline
15 & 0.083811 & 0.5622 & 0.288377 \tabularnewline
16 & 0.088758 & 0.5954 & 0.277277 \tabularnewline
17 & -0.045918 & -0.308 & 0.379742 \tabularnewline
18 & 0.014547 & 0.0976 & 0.461347 \tabularnewline
19 & -0.16105 & -1.0804 & 0.142869 \tabularnewline
20 & 0.104462 & 0.7008 & 0.243532 \tabularnewline
21 & -0.137138 & -0.92 & 0.181252 \tabularnewline
22 & 0.107719 & 0.7226 & 0.236832 \tabularnewline
23 & 0.049093 & 0.3293 & 0.371718 \tabularnewline
24 & -0.082554 & -0.5538 & 0.291232 \tabularnewline
25 & -0.224366 & -1.5051 & 0.069644 \tabularnewline
26 & 0.085153 & 0.5712 & 0.285345 \tabularnewline
27 & 0.125056 & 0.8389 & 0.20298 \tabularnewline
28 & -0.057107 & -0.3831 & 0.351731 \tabularnewline
29 & 0.046145 & 0.3096 & 0.379165 \tabularnewline
30 & 0.003719 & 0.0249 & 0.490103 \tabularnewline
31 & 0.038334 & 0.2572 & 0.399116 \tabularnewline
32 & 0.019708 & 0.1322 & 0.447706 \tabularnewline
33 & 0.106889 & 0.717 & 0.23853 \tabularnewline
34 & -0.045635 & -0.3061 & 0.38046 \tabularnewline
35 & -0.0198 & -0.1328 & 0.447464 \tabularnewline
36 & -0.02452 & -0.1645 & 0.435044 \tabularnewline
37 & -0.130251 & -0.8738 & 0.193446 \tabularnewline
38 & -0.022051 & -0.1479 & 0.441531 \tabularnewline
39 & 0.020965 & 0.1406 & 0.444391 \tabularnewline
40 & -0.009823 & -0.0659 & 0.473878 \tabularnewline
41 & -0.029161 & -0.1956 & 0.422895 \tabularnewline
42 & 0.018412 & 0.1235 & 0.451125 \tabularnewline
43 & 0.002973 & 0.0199 & 0.492087 \tabularnewline
44 & -0.003184 & -0.0214 & 0.491527 \tabularnewline
45 & NA & NA & NA \tabularnewline
46 & NA & NA & NA \tabularnewline
47 & NA & NA & NA \tabularnewline
48 & NA & NA & NA \tabularnewline
\hline
\end{tabular}
%Source: https://freestatistics.org/blog/index.php?pk=108745&T=1

[TABLE]
[ROW][C]Autocorrelation Function[/C][/ROW]
[ROW][C]Time lag k[/C][C]ACF(k)[/C][C]T-STAT[/C][C]P-value[/C][/ROW]
[ROW][C]1[/C][C]0.027018[/C][C]0.1812[/C][C]0.428497[/C][/ROW]
[ROW][C]2[/C][C]-0.129154[/C][C]-0.8664[/C][C]0.195436[/C][/ROW]
[ROW][C]3[/C][C]-0.234797[/C][C]-1.5751[/C][C]0.061123[/C][/ROW]
[ROW][C]4[/C][C]-0.02222[/C][C]-0.1491[/C][C]0.441088[/C][/ROW]
[ROW][C]5[/C][C]-0.032196[/C][C]-0.216[/C][C]0.414992[/C][/ROW]
[ROW][C]6[/C][C]0.076041[/C][C]0.5101[/C][C]0.306237[/C][/ROW]
[ROW][C]7[/C][C]0.14538[/C][C]0.9752[/C][C]0.167327[/C][/ROW]
[ROW][C]8[/C][C]-0.195052[/C][C]-1.3085[/C][C]0.098682[/C][/ROW]
[ROW][C]9[/C][C]0.106531[/C][C]0.7146[/C][C]0.239264[/C][/ROW]
[ROW][C]10[/C][C]-0.163883[/C][C]-1.0994[/C][C]0.138729[/C][/ROW]
[ROW][C]11[/C][C]-2.2e-05[/C][C]-1e-04[/C][C]0.499942[/C][/ROW]
[ROW][C]12[/C][C]-0.143882[/C][C]-0.9652[/C][C]0.169804[/C][/ROW]
[ROW][C]13[/C][C]0.190499[/C][C]1.2779[/C][C]0.103918[/C][/ROW]
[ROW][C]14[/C][C]-0.047453[/C][C]-0.3183[/C][C]0.375855[/C][/ROW]
[ROW][C]15[/C][C]0.083811[/C][C]0.5622[/C][C]0.288377[/C][/ROW]
[ROW][C]16[/C][C]0.088758[/C][C]0.5954[/C][C]0.277277[/C][/ROW]
[ROW][C]17[/C][C]-0.045918[/C][C]-0.308[/C][C]0.379742[/C][/ROW]
[ROW][C]18[/C][C]0.014547[/C][C]0.0976[/C][C]0.461347[/C][/ROW]
[ROW][C]19[/C][C]-0.16105[/C][C]-1.0804[/C][C]0.142869[/C][/ROW]
[ROW][C]20[/C][C]0.104462[/C][C]0.7008[/C][C]0.243532[/C][/ROW]
[ROW][C]21[/C][C]-0.137138[/C][C]-0.92[/C][C]0.181252[/C][/ROW]
[ROW][C]22[/C][C]0.107719[/C][C]0.7226[/C][C]0.236832[/C][/ROW]
[ROW][C]23[/C][C]0.049093[/C][C]0.3293[/C][C]0.371718[/C][/ROW]
[ROW][C]24[/C][C]-0.082554[/C][C]-0.5538[/C][C]0.291232[/C][/ROW]
[ROW][C]25[/C][C]-0.224366[/C][C]-1.5051[/C][C]0.069644[/C][/ROW]
[ROW][C]26[/C][C]0.085153[/C][C]0.5712[/C][C]0.285345[/C][/ROW]
[ROW][C]27[/C][C]0.125056[/C][C]0.8389[/C][C]0.20298[/C][/ROW]
[ROW][C]28[/C][C]-0.057107[/C][C]-0.3831[/C][C]0.351731[/C][/ROW]
[ROW][C]29[/C][C]0.046145[/C][C]0.3096[/C][C]0.379165[/C][/ROW]
[ROW][C]30[/C][C]0.003719[/C][C]0.0249[/C][C]0.490103[/C][/ROW]
[ROW][C]31[/C][C]0.038334[/C][C]0.2572[/C][C]0.399116[/C][/ROW]
[ROW][C]32[/C][C]0.019708[/C][C]0.1322[/C][C]0.447706[/C][/ROW]
[ROW][C]33[/C][C]0.106889[/C][C]0.717[/C][C]0.23853[/C][/ROW]
[ROW][C]34[/C][C]-0.045635[/C][C]-0.3061[/C][C]0.38046[/C][/ROW]
[ROW][C]35[/C][C]-0.0198[/C][C]-0.1328[/C][C]0.447464[/C][/ROW]
[ROW][C]36[/C][C]-0.02452[/C][C]-0.1645[/C][C]0.435044[/C][/ROW]
[ROW][C]37[/C][C]-0.130251[/C][C]-0.8738[/C][C]0.193446[/C][/ROW]
[ROW][C]38[/C][C]-0.022051[/C][C]-0.1479[/C][C]0.441531[/C][/ROW]
[ROW][C]39[/C][C]0.020965[/C][C]0.1406[/C][C]0.444391[/C][/ROW]
[ROW][C]40[/C][C]-0.009823[/C][C]-0.0659[/C][C]0.473878[/C][/ROW]
[ROW][C]41[/C][C]-0.029161[/C][C]-0.1956[/C][C]0.422895[/C][/ROW]
[ROW][C]42[/C][C]0.018412[/C][C]0.1235[/C][C]0.451125[/C][/ROW]
[ROW][C]43[/C][C]0.002973[/C][C]0.0199[/C][C]0.492087[/C][/ROW]
[ROW][C]44[/C][C]-0.003184[/C][C]-0.0214[/C][C]0.491527[/C][/ROW]
[ROW][C]45[/C][C]NA[/C][C]NA[/C][C]NA[/C][/ROW]
[ROW][C]46[/C][C]NA[/C][C]NA[/C][C]NA[/C][/ROW]
[ROW][C]47[/C][C]NA[/C][C]NA[/C][C]NA[/C][/ROW]
[ROW][C]48[/C][C]NA[/C][C]NA[/C][C]NA[/C][/ROW]
[/TABLE]
Source: https://freestatistics.org/blog/index.php?pk=108745&T=1

Globally Unique Identifier (entire table): ba.freestatistics.org/blog/index.php?pk=108745&T=1

As an alternative you can also use a QR Code:  

The GUIDs for individual cells are displayed in the table below:

Autocorrelation Function
Time lag kACF(k)T-STATP-value
10.0270180.18120.428497
2-0.129154-0.86640.195436
3-0.234797-1.57510.061123
4-0.02222-0.14910.441088
5-0.032196-0.2160.414992
60.0760410.51010.306237
70.145380.97520.167327
8-0.195052-1.30850.098682
90.1065310.71460.239264
10-0.163883-1.09940.138729
11-2.2e-05-1e-040.499942
12-0.143882-0.96520.169804
130.1904991.27790.103918
14-0.047453-0.31830.375855
150.0838110.56220.288377
160.0887580.59540.277277
17-0.045918-0.3080.379742
180.0145470.09760.461347
19-0.16105-1.08040.142869
200.1044620.70080.243532
21-0.137138-0.920.181252
220.1077190.72260.236832
230.0490930.32930.371718
24-0.082554-0.55380.291232
25-0.224366-1.50510.069644
260.0851530.57120.285345
270.1250560.83890.20298
28-0.057107-0.38310.351731
290.0461450.30960.379165
300.0037190.02490.490103
310.0383340.25720.399116
320.0197080.13220.447706
330.1068890.7170.23853
34-0.045635-0.30610.38046
35-0.0198-0.13280.447464
36-0.02452-0.16450.435044
37-0.130251-0.87380.193446
38-0.022051-0.14790.441531
390.0209650.14060.444391
40-0.009823-0.06590.473878
41-0.029161-0.19560.422895
420.0184120.12350.451125
430.0029730.01990.492087
44-0.003184-0.02140.491527
45NANANA
46NANANA
47NANANA
48NANANA


Partial Autocorrelation Function
Time lag kPACF(k)T-STATP-value
10.0270180.18120.428497
2-0.129979-0.87190.193939
3-0.231418-1.55240.063786
4-0.034134-0.2290.409963
5-0.09817-0.65850.256771
60.0144080.09670.461717
70.1252980.84050.202529
8-0.232746-1.56130.062729
90.1915931.28520.102641
10-0.207049-1.38890.085845
11-0.030601-0.20530.41914
12-0.135699-0.91030.183758
130.0949770.63710.263636
14-0.123992-0.83180.204967
150.1378730.92490.17998
160.0291240.19540.422992
170.0572170.38380.351457
180.0170420.11430.454745
19-0.098365-0.65990.256356
200.0373530.25060.401642
21-0.099807-0.66950.25329
22-0.055202-0.37030.356445
230.161071.08050.142841
24-0.259293-1.73940.044401
25-0.096676-0.64850.259972
260.1615651.08380.142111
27-0.073945-0.4960.31114
28-0.016074-0.10780.457305
29-0.01581-0.10610.458004
300.0413340.27730.391418
310.0218230.14640.442133
320.0851610.57130.285328
33-0.029135-0.19540.422964
340.1703121.14250.129646
35-0.091302-0.61250.271654
36-0.056146-0.37660.354106
37-0.044908-0.30130.382304
38-0.055366-0.37140.356039
39-0.086223-0.57840.282939
40-0.003117-0.02090.491704
41-0.055044-0.36920.356838
420.0361880.24280.40465
43-0.044014-0.29530.384577
440.0220020.14760.44166
45NANANA
46NANANA
47NANANA
48NANANA

\begin{tabular}{lllllllll}
\hline
Partial Autocorrelation Function \tabularnewline
Time lag k & PACF(k) & T-STAT & P-value \tabularnewline
1 & 0.027018 & 0.1812 & 0.428497 \tabularnewline
2 & -0.129979 & -0.8719 & 0.193939 \tabularnewline
3 & -0.231418 & -1.5524 & 0.063786 \tabularnewline
4 & -0.034134 & -0.229 & 0.409963 \tabularnewline
5 & -0.09817 & -0.6585 & 0.256771 \tabularnewline
6 & 0.014408 & 0.0967 & 0.461717 \tabularnewline
7 & 0.125298 & 0.8405 & 0.202529 \tabularnewline
8 & -0.232746 & -1.5613 & 0.062729 \tabularnewline
9 & 0.191593 & 1.2852 & 0.102641 \tabularnewline
10 & -0.207049 & -1.3889 & 0.085845 \tabularnewline
11 & -0.030601 & -0.2053 & 0.41914 \tabularnewline
12 & -0.135699 & -0.9103 & 0.183758 \tabularnewline
13 & 0.094977 & 0.6371 & 0.263636 \tabularnewline
14 & -0.123992 & -0.8318 & 0.204967 \tabularnewline
15 & 0.137873 & 0.9249 & 0.17998 \tabularnewline
16 & 0.029124 & 0.1954 & 0.422992 \tabularnewline
17 & 0.057217 & 0.3838 & 0.351457 \tabularnewline
18 & 0.017042 & 0.1143 & 0.454745 \tabularnewline
19 & -0.098365 & -0.6599 & 0.256356 \tabularnewline
20 & 0.037353 & 0.2506 & 0.401642 \tabularnewline
21 & -0.099807 & -0.6695 & 0.25329 \tabularnewline
22 & -0.055202 & -0.3703 & 0.356445 \tabularnewline
23 & 0.16107 & 1.0805 & 0.142841 \tabularnewline
24 & -0.259293 & -1.7394 & 0.044401 \tabularnewline
25 & -0.096676 & -0.6485 & 0.259972 \tabularnewline
26 & 0.161565 & 1.0838 & 0.142111 \tabularnewline
27 & -0.073945 & -0.496 & 0.31114 \tabularnewline
28 & -0.016074 & -0.1078 & 0.457305 \tabularnewline
29 & -0.01581 & -0.1061 & 0.458004 \tabularnewline
30 & 0.041334 & 0.2773 & 0.391418 \tabularnewline
31 & 0.021823 & 0.1464 & 0.442133 \tabularnewline
32 & 0.085161 & 0.5713 & 0.285328 \tabularnewline
33 & -0.029135 & -0.1954 & 0.422964 \tabularnewline
34 & 0.170312 & 1.1425 & 0.129646 \tabularnewline
35 & -0.091302 & -0.6125 & 0.271654 \tabularnewline
36 & -0.056146 & -0.3766 & 0.354106 \tabularnewline
37 & -0.044908 & -0.3013 & 0.382304 \tabularnewline
38 & -0.055366 & -0.3714 & 0.356039 \tabularnewline
39 & -0.086223 & -0.5784 & 0.282939 \tabularnewline
40 & -0.003117 & -0.0209 & 0.491704 \tabularnewline
41 & -0.055044 & -0.3692 & 0.356838 \tabularnewline
42 & 0.036188 & 0.2428 & 0.40465 \tabularnewline
43 & -0.044014 & -0.2953 & 0.384577 \tabularnewline
44 & 0.022002 & 0.1476 & 0.44166 \tabularnewline
45 & NA & NA & NA \tabularnewline
46 & NA & NA & NA \tabularnewline
47 & NA & NA & NA \tabularnewline
48 & NA & NA & NA \tabularnewline
\hline
\end{tabular}
%Source: https://freestatistics.org/blog/index.php?pk=108745&T=2

[TABLE]
[ROW][C]Partial Autocorrelation Function[/C][/ROW]
[ROW][C]Time lag k[/C][C]PACF(k)[/C][C]T-STAT[/C][C]P-value[/C][/ROW]
[ROW][C]1[/C][C]0.027018[/C][C]0.1812[/C][C]0.428497[/C][/ROW]
[ROW][C]2[/C][C]-0.129979[/C][C]-0.8719[/C][C]0.193939[/C][/ROW]
[ROW][C]3[/C][C]-0.231418[/C][C]-1.5524[/C][C]0.063786[/C][/ROW]
[ROW][C]4[/C][C]-0.034134[/C][C]-0.229[/C][C]0.409963[/C][/ROW]
[ROW][C]5[/C][C]-0.09817[/C][C]-0.6585[/C][C]0.256771[/C][/ROW]
[ROW][C]6[/C][C]0.014408[/C][C]0.0967[/C][C]0.461717[/C][/ROW]
[ROW][C]7[/C][C]0.125298[/C][C]0.8405[/C][C]0.202529[/C][/ROW]
[ROW][C]8[/C][C]-0.232746[/C][C]-1.5613[/C][C]0.062729[/C][/ROW]
[ROW][C]9[/C][C]0.191593[/C][C]1.2852[/C][C]0.102641[/C][/ROW]
[ROW][C]10[/C][C]-0.207049[/C][C]-1.3889[/C][C]0.085845[/C][/ROW]
[ROW][C]11[/C][C]-0.030601[/C][C]-0.2053[/C][C]0.41914[/C][/ROW]
[ROW][C]12[/C][C]-0.135699[/C][C]-0.9103[/C][C]0.183758[/C][/ROW]
[ROW][C]13[/C][C]0.094977[/C][C]0.6371[/C][C]0.263636[/C][/ROW]
[ROW][C]14[/C][C]-0.123992[/C][C]-0.8318[/C][C]0.204967[/C][/ROW]
[ROW][C]15[/C][C]0.137873[/C][C]0.9249[/C][C]0.17998[/C][/ROW]
[ROW][C]16[/C][C]0.029124[/C][C]0.1954[/C][C]0.422992[/C][/ROW]
[ROW][C]17[/C][C]0.057217[/C][C]0.3838[/C][C]0.351457[/C][/ROW]
[ROW][C]18[/C][C]0.017042[/C][C]0.1143[/C][C]0.454745[/C][/ROW]
[ROW][C]19[/C][C]-0.098365[/C][C]-0.6599[/C][C]0.256356[/C][/ROW]
[ROW][C]20[/C][C]0.037353[/C][C]0.2506[/C][C]0.401642[/C][/ROW]
[ROW][C]21[/C][C]-0.099807[/C][C]-0.6695[/C][C]0.25329[/C][/ROW]
[ROW][C]22[/C][C]-0.055202[/C][C]-0.3703[/C][C]0.356445[/C][/ROW]
[ROW][C]23[/C][C]0.16107[/C][C]1.0805[/C][C]0.142841[/C][/ROW]
[ROW][C]24[/C][C]-0.259293[/C][C]-1.7394[/C][C]0.044401[/C][/ROW]
[ROW][C]25[/C][C]-0.096676[/C][C]-0.6485[/C][C]0.259972[/C][/ROW]
[ROW][C]26[/C][C]0.161565[/C][C]1.0838[/C][C]0.142111[/C][/ROW]
[ROW][C]27[/C][C]-0.073945[/C][C]-0.496[/C][C]0.31114[/C][/ROW]
[ROW][C]28[/C][C]-0.016074[/C][C]-0.1078[/C][C]0.457305[/C][/ROW]
[ROW][C]29[/C][C]-0.01581[/C][C]-0.1061[/C][C]0.458004[/C][/ROW]
[ROW][C]30[/C][C]0.041334[/C][C]0.2773[/C][C]0.391418[/C][/ROW]
[ROW][C]31[/C][C]0.021823[/C][C]0.1464[/C][C]0.442133[/C][/ROW]
[ROW][C]32[/C][C]0.085161[/C][C]0.5713[/C][C]0.285328[/C][/ROW]
[ROW][C]33[/C][C]-0.029135[/C][C]-0.1954[/C][C]0.422964[/C][/ROW]
[ROW][C]34[/C][C]0.170312[/C][C]1.1425[/C][C]0.129646[/C][/ROW]
[ROW][C]35[/C][C]-0.091302[/C][C]-0.6125[/C][C]0.271654[/C][/ROW]
[ROW][C]36[/C][C]-0.056146[/C][C]-0.3766[/C][C]0.354106[/C][/ROW]
[ROW][C]37[/C][C]-0.044908[/C][C]-0.3013[/C][C]0.382304[/C][/ROW]
[ROW][C]38[/C][C]-0.055366[/C][C]-0.3714[/C][C]0.356039[/C][/ROW]
[ROW][C]39[/C][C]-0.086223[/C][C]-0.5784[/C][C]0.282939[/C][/ROW]
[ROW][C]40[/C][C]-0.003117[/C][C]-0.0209[/C][C]0.491704[/C][/ROW]
[ROW][C]41[/C][C]-0.055044[/C][C]-0.3692[/C][C]0.356838[/C][/ROW]
[ROW][C]42[/C][C]0.036188[/C][C]0.2428[/C][C]0.40465[/C][/ROW]
[ROW][C]43[/C][C]-0.044014[/C][C]-0.2953[/C][C]0.384577[/C][/ROW]
[ROW][C]44[/C][C]0.022002[/C][C]0.1476[/C][C]0.44166[/C][/ROW]
[ROW][C]45[/C][C]NA[/C][C]NA[/C][C]NA[/C][/ROW]
[ROW][C]46[/C][C]NA[/C][C]NA[/C][C]NA[/C][/ROW]
[ROW][C]47[/C][C]NA[/C][C]NA[/C][C]NA[/C][/ROW]
[ROW][C]48[/C][C]NA[/C][C]NA[/C][C]NA[/C][/ROW]
[/TABLE]
Source: https://freestatistics.org/blog/index.php?pk=108745&T=2

Globally Unique Identifier (entire table): ba.freestatistics.org/blog/index.php?pk=108745&T=2

As an alternative you can also use a QR Code:  

The GUIDs for individual cells are displayed in the table below:

Partial Autocorrelation Function
Time lag kPACF(k)T-STATP-value
10.0270180.18120.428497
2-0.129979-0.87190.193939
3-0.231418-1.55240.063786
4-0.034134-0.2290.409963
5-0.09817-0.65850.256771
60.0144080.09670.461717
70.1252980.84050.202529
8-0.232746-1.56130.062729
90.1915931.28520.102641
10-0.207049-1.38890.085845
11-0.030601-0.20530.41914
12-0.135699-0.91030.183758
130.0949770.63710.263636
14-0.123992-0.83180.204967
150.1378730.92490.17998
160.0291240.19540.422992
170.0572170.38380.351457
180.0170420.11430.454745
19-0.098365-0.65990.256356
200.0373530.25060.401642
21-0.099807-0.66950.25329
22-0.055202-0.37030.356445
230.161071.08050.142841
24-0.259293-1.73940.044401
25-0.096676-0.64850.259972
260.1615651.08380.142111
27-0.073945-0.4960.31114
28-0.016074-0.10780.457305
29-0.01581-0.10610.458004
300.0413340.27730.391418
310.0218230.14640.442133
320.0851610.57130.285328
33-0.029135-0.19540.422964
340.1703121.14250.129646
35-0.091302-0.61250.271654
36-0.056146-0.37660.354106
37-0.044908-0.30130.382304
38-0.055366-0.37140.356039
39-0.086223-0.57840.282939
40-0.003117-0.02090.491704
41-0.055044-0.36920.356838
420.0361880.24280.40465
43-0.044014-0.29530.384577
440.0220020.14760.44166
45NANANA
46NANANA
47NANANA
48NANANA


Parameters (Session):
par1 = 48 ; par2 = 1 ; par3 = 0 ; par4 = 0 ; par5 = 12 ; par6 = White Noise ; par7 = 0.95 ;
Parameters (R input):
par1 = 48 ; par2 = 1 ; par3 = 1 ; par4 = 1 ; par5 = 12 ; par6 = White Noise ; par7 = 0.95 ;
R code (references can be found in the software module):
if (par1 == 'Default') {
par1 = 10*log10(length(x))
} else {
par1 <- as.numeric(par1)
}
par2 <- as.numeric(par2)
par3 <- as.numeric(par3)
par4 <- as.numeric(par4)
par5 <- as.numeric(par5)
if (par6 == 'White Noise') par6 <- 'white' else par6 <- 'ma'
par7 <- as.numeric(par7)
if (par2 == 0) {
x <- log(x)
} else {
x <- (x ^ par2 - 1) / par2
}
if (par3 > 0) x <- diff(x,lag=1,difference=par3)
if (par4 > 0) x <- diff(x,lag=par5,difference=par4)
bitmap(file='pic1.png')
racf <- acf(x, par1, main='Autocorrelation', xlab='time lag', ylab='ACF', ci.type=par6, ci=par7, sub=paste('(lambda=',par2,', d=',par3,', D=',par4,', CI=', par7, ', CI type=',par6,')',sep=''))
dev.off()
bitmap(file='pic2.png')
rpacf <- pacf(x,par1,main='Partial Autocorrelation',xlab='lags',ylab='PACF')
dev.off()
(myacf <- c(racf$acf))
(mypacf <- c(rpacf$acf))
lengthx <- length(x)
sqrtn <- sqrt(lengthx)
load(file='createtable')
a<-table.start()
a<-table.row.start(a)
a<-table.element(a,'Autocorrelation Function',4,TRUE)
a<-table.row.end(a)
a<-table.row.start(a)
a<-table.element(a,'Time lag k',header=TRUE)
a<-table.element(a,hyperlink('basics.htm','ACF(k)','click here for more information about the Autocorrelation Function'),header=TRUE)
a<-table.element(a,'T-STAT',header=TRUE)
a<-table.element(a,'P-value',header=TRUE)
a<-table.row.end(a)
for (i in 2:(par1+1)) {
a<-table.row.start(a)
a<-table.element(a,i-1,header=TRUE)
a<-table.element(a,round(myacf[i],6))
mytstat <- myacf[i]*sqrtn
a<-table.element(a,round(mytstat,4))
a<-table.element(a,round(1-pt(abs(mytstat),lengthx),6))
a<-table.row.end(a)
}
a<-table.end(a)
table.save(a,file='mytable.tab')
a<-table.start()
a<-table.row.start(a)
a<-table.element(a,'Partial Autocorrelation Function',4,TRUE)
a<-table.row.end(a)
a<-table.row.start(a)
a<-table.element(a,'Time lag k',header=TRUE)
a<-table.element(a,hyperlink('basics.htm','PACF(k)','click here for more information about the Partial Autocorrelation Function'),header=TRUE)
a<-table.element(a,'T-STAT',header=TRUE)
a<-table.element(a,'P-value',header=TRUE)
a<-table.row.end(a)
for (i in 1:par1) {
a<-table.row.start(a)
a<-table.element(a,i,header=TRUE)
a<-table.element(a,round(mypacf[i],6))
mytstat <- mypacf[i]*sqrtn
a<-table.element(a,round(mytstat,4))
a<-table.element(a,round(1-pt(abs(mytstat),lengthx),6))
a<-table.row.end(a)
}
a<-table.end(a)
table.save(a,file='mytable1.tab')