Free Statistics

of Irreproducible Research!

Author's title

Author*The author of this computation has been verified*
R Software Modulerwasp_autocorrelation.wasp
Title produced by software(Partial) Autocorrelation Function
Date of computationMon, 13 Dec 2010 09:51:46 +0000
Cite this page as followsStatistical Computations at FreeStatistics.org, Office for Research Development and Education, URL https://freestatistics.org/blog/index.php?v=date/2010/Dec/13/t1292233843mavy3n3zw4n3jsq.htm/, Retrieved Mon, 06 May 2024 14:11:30 +0000
Statistical Computations at FreeStatistics.org, Office for Research Development and Education, URL https://freestatistics.org/blog/index.php?pk=108737, Retrieved Mon, 06 May 2024 14:11:30 +0000
QR Codes:

Original text written by user:
IsPrivate?No (this computation is public)
User-defined keywords
Estimated Impact165
Family? (F = Feedback message, R = changed R code, M = changed R Module, P = changed Parameters, D = changed Data)
-     [(Partial) Autocorrelation Function] [] [2010-12-13 08:35:23] [21eff0c210342db4afbdafe426a7c254]
-   PD  [(Partial) Autocorrelation Function] [] [2010-12-13 09:29:04] [21eff0c210342db4afbdafe426a7c254]
-    D      [(Partial) Autocorrelation Function] [] [2010-12-13 09:51:46] [81d69fb83507cea26168920232cdff1b] [Current]
Feedback Forum

Post a new message
Dataseries X:
31293
30236
30160
32436
30695
27525
26434
25739
25204
24977
24320
22680
22052
21467
21383
21777
21928
21814
22937
23595
20830
19650
19195
19644
18483
18079
19178
18391
18441
18584
20108
20148
19394
17745
17696
17032
16438
15683
15594
15713
15937
16171
15928
16348
15579
15305
15648
14954
15137
15839
16050
15168
17064
16005
14886
14931
14544
13812


Summary of computational transaction
Raw Inputview raw input (R code)
Raw Outputview raw output of R engine
Computing time1 seconds
R Server'George Udny Yule' @ 72.249.76.132

\begin{tabular}{lllllllll}
\hline
Summary of computational transaction \tabularnewline
Raw Input & view raw input (R code)  \tabularnewline
Raw Output & view raw output of R engine  \tabularnewline
Computing time & 1 seconds \tabularnewline
R Server & 'George Udny Yule' @ 72.249.76.132 \tabularnewline
\hline
\end{tabular}
%Source: https://freestatistics.org/blog/index.php?pk=108737&T=0

[TABLE]
[ROW][C]Summary of computational transaction[/C][/ROW]
[ROW][C]Raw Input[/C][C]view raw input (R code) [/C][/ROW]
[ROW][C]Raw Output[/C][C]view raw output of R engine [/C][/ROW]
[ROW][C]Computing time[/C][C]1 seconds[/C][/ROW]
[ROW][C]R Server[/C][C]'George Udny Yule' @ 72.249.76.132[/C][/ROW]
[/TABLE]
Source: https://freestatistics.org/blog/index.php?pk=108737&T=0

Globally Unique Identifier (entire table): ba.freestatistics.org/blog/index.php?pk=108737&T=0

As an alternative you can also use a QR Code:  

The GUIDs for individual cells are displayed in the table below:

Summary of computational transaction
Raw Inputview raw input (R code)
Raw Outputview raw output of R engine
Computing time1 seconds
R Server'George Udny Yule' @ 72.249.76.132


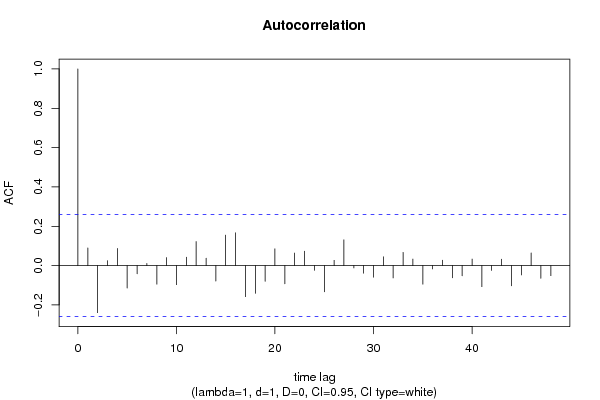
Autocorrelation Function
Time lag kACF(k)T-STATP-value
10.089990.67940.249815
2-0.239598-1.80890.037869
30.0247080.18650.426343
40.0872990.65910.256245
5-0.113996-0.86060.196519
6-0.041514-0.31340.377552
70.0112730.08510.466237
8-0.094539-0.71380.239147
90.041210.31110.378418
10-0.096764-0.73060.234022
110.0425040.32090.374731
120.1224490.92450.17957
130.0377130.28470.388443
14-0.078789-0.59480.277152
150.1550051.17030.123383
160.1665941.25780.106805
17-0.158071-1.19340.118827
18-0.140661-1.0620.146365
19-0.080057-0.60440.273982
200.0854220.64490.260783
21-0.09287-0.70120.243031
220.0635640.47990.316568
230.0735750.55550.290371
24-0.024083-0.18180.428183
25-0.133155-1.00530.159502
260.0272090.20540.418987
270.1310520.98940.163319
28-0.011624-0.08780.465187
29-0.038676-0.2920.385674
30-0.059-0.44540.328845
310.0445050.3360.369052
32-0.062714-0.47350.318839
330.0672650.50780.306762
340.0330670.24960.401879
35-0.094506-0.71350.239223
36-0.017078-0.12890.448931
370.027370.20660.418515
38-0.062309-0.47040.319923
39-0.051738-0.39060.348771
400.0331810.25050.401547
41-0.107357-0.81050.210504
42-0.024441-0.18450.427127
430.0324550.2450.403657
44-0.102558-0.77430.220978
45-0.047219-0.35650.361392
460.0641910.48460.314896
47-0.06468-0.48830.313597
48-0.051629-0.38980.349072

\begin{tabular}{lllllllll}
\hline
Autocorrelation Function \tabularnewline
Time lag k & ACF(k) & T-STAT & P-value \tabularnewline
1 & 0.08999 & 0.6794 & 0.249815 \tabularnewline
2 & -0.239598 & -1.8089 & 0.037869 \tabularnewline
3 & 0.024708 & 0.1865 & 0.426343 \tabularnewline
4 & 0.087299 & 0.6591 & 0.256245 \tabularnewline
5 & -0.113996 & -0.8606 & 0.196519 \tabularnewline
6 & -0.041514 & -0.3134 & 0.377552 \tabularnewline
7 & 0.011273 & 0.0851 & 0.466237 \tabularnewline
8 & -0.094539 & -0.7138 & 0.239147 \tabularnewline
9 & 0.04121 & 0.3111 & 0.378418 \tabularnewline
10 & -0.096764 & -0.7306 & 0.234022 \tabularnewline
11 & 0.042504 & 0.3209 & 0.374731 \tabularnewline
12 & 0.122449 & 0.9245 & 0.17957 \tabularnewline
13 & 0.037713 & 0.2847 & 0.388443 \tabularnewline
14 & -0.078789 & -0.5948 & 0.277152 \tabularnewline
15 & 0.155005 & 1.1703 & 0.123383 \tabularnewline
16 & 0.166594 & 1.2578 & 0.106805 \tabularnewline
17 & -0.158071 & -1.1934 & 0.118827 \tabularnewline
18 & -0.140661 & -1.062 & 0.146365 \tabularnewline
19 & -0.080057 & -0.6044 & 0.273982 \tabularnewline
20 & 0.085422 & 0.6449 & 0.260783 \tabularnewline
21 & -0.09287 & -0.7012 & 0.243031 \tabularnewline
22 & 0.063564 & 0.4799 & 0.316568 \tabularnewline
23 & 0.073575 & 0.5555 & 0.290371 \tabularnewline
24 & -0.024083 & -0.1818 & 0.428183 \tabularnewline
25 & -0.133155 & -1.0053 & 0.159502 \tabularnewline
26 & 0.027209 & 0.2054 & 0.418987 \tabularnewline
27 & 0.131052 & 0.9894 & 0.163319 \tabularnewline
28 & -0.011624 & -0.0878 & 0.465187 \tabularnewline
29 & -0.038676 & -0.292 & 0.385674 \tabularnewline
30 & -0.059 & -0.4454 & 0.328845 \tabularnewline
31 & 0.044505 & 0.336 & 0.369052 \tabularnewline
32 & -0.062714 & -0.4735 & 0.318839 \tabularnewline
33 & 0.067265 & 0.5078 & 0.306762 \tabularnewline
34 & 0.033067 & 0.2496 & 0.401879 \tabularnewline
35 & -0.094506 & -0.7135 & 0.239223 \tabularnewline
36 & -0.017078 & -0.1289 & 0.448931 \tabularnewline
37 & 0.02737 & 0.2066 & 0.418515 \tabularnewline
38 & -0.062309 & -0.4704 & 0.319923 \tabularnewline
39 & -0.051738 & -0.3906 & 0.348771 \tabularnewline
40 & 0.033181 & 0.2505 & 0.401547 \tabularnewline
41 & -0.107357 & -0.8105 & 0.210504 \tabularnewline
42 & -0.024441 & -0.1845 & 0.427127 \tabularnewline
43 & 0.032455 & 0.245 & 0.403657 \tabularnewline
44 & -0.102558 & -0.7743 & 0.220978 \tabularnewline
45 & -0.047219 & -0.3565 & 0.361392 \tabularnewline
46 & 0.064191 & 0.4846 & 0.314896 \tabularnewline
47 & -0.06468 & -0.4883 & 0.313597 \tabularnewline
48 & -0.051629 & -0.3898 & 0.349072 \tabularnewline
\hline
\end{tabular}
%Source: https://freestatistics.org/blog/index.php?pk=108737&T=1

[TABLE]
[ROW][C]Autocorrelation Function[/C][/ROW]
[ROW][C]Time lag k[/C][C]ACF(k)[/C][C]T-STAT[/C][C]P-value[/C][/ROW]
[ROW][C]1[/C][C]0.08999[/C][C]0.6794[/C][C]0.249815[/C][/ROW]
[ROW][C]2[/C][C]-0.239598[/C][C]-1.8089[/C][C]0.037869[/C][/ROW]
[ROW][C]3[/C][C]0.024708[/C][C]0.1865[/C][C]0.426343[/C][/ROW]
[ROW][C]4[/C][C]0.087299[/C][C]0.6591[/C][C]0.256245[/C][/ROW]
[ROW][C]5[/C][C]-0.113996[/C][C]-0.8606[/C][C]0.196519[/C][/ROW]
[ROW][C]6[/C][C]-0.041514[/C][C]-0.3134[/C][C]0.377552[/C][/ROW]
[ROW][C]7[/C][C]0.011273[/C][C]0.0851[/C][C]0.466237[/C][/ROW]
[ROW][C]8[/C][C]-0.094539[/C][C]-0.7138[/C][C]0.239147[/C][/ROW]
[ROW][C]9[/C][C]0.04121[/C][C]0.3111[/C][C]0.378418[/C][/ROW]
[ROW][C]10[/C][C]-0.096764[/C][C]-0.7306[/C][C]0.234022[/C][/ROW]
[ROW][C]11[/C][C]0.042504[/C][C]0.3209[/C][C]0.374731[/C][/ROW]
[ROW][C]12[/C][C]0.122449[/C][C]0.9245[/C][C]0.17957[/C][/ROW]
[ROW][C]13[/C][C]0.037713[/C][C]0.2847[/C][C]0.388443[/C][/ROW]
[ROW][C]14[/C][C]-0.078789[/C][C]-0.5948[/C][C]0.277152[/C][/ROW]
[ROW][C]15[/C][C]0.155005[/C][C]1.1703[/C][C]0.123383[/C][/ROW]
[ROW][C]16[/C][C]0.166594[/C][C]1.2578[/C][C]0.106805[/C][/ROW]
[ROW][C]17[/C][C]-0.158071[/C][C]-1.1934[/C][C]0.118827[/C][/ROW]
[ROW][C]18[/C][C]-0.140661[/C][C]-1.062[/C][C]0.146365[/C][/ROW]
[ROW][C]19[/C][C]-0.080057[/C][C]-0.6044[/C][C]0.273982[/C][/ROW]
[ROW][C]20[/C][C]0.085422[/C][C]0.6449[/C][C]0.260783[/C][/ROW]
[ROW][C]21[/C][C]-0.09287[/C][C]-0.7012[/C][C]0.243031[/C][/ROW]
[ROW][C]22[/C][C]0.063564[/C][C]0.4799[/C][C]0.316568[/C][/ROW]
[ROW][C]23[/C][C]0.073575[/C][C]0.5555[/C][C]0.290371[/C][/ROW]
[ROW][C]24[/C][C]-0.024083[/C][C]-0.1818[/C][C]0.428183[/C][/ROW]
[ROW][C]25[/C][C]-0.133155[/C][C]-1.0053[/C][C]0.159502[/C][/ROW]
[ROW][C]26[/C][C]0.027209[/C][C]0.2054[/C][C]0.418987[/C][/ROW]
[ROW][C]27[/C][C]0.131052[/C][C]0.9894[/C][C]0.163319[/C][/ROW]
[ROW][C]28[/C][C]-0.011624[/C][C]-0.0878[/C][C]0.465187[/C][/ROW]
[ROW][C]29[/C][C]-0.038676[/C][C]-0.292[/C][C]0.385674[/C][/ROW]
[ROW][C]30[/C][C]-0.059[/C][C]-0.4454[/C][C]0.328845[/C][/ROW]
[ROW][C]31[/C][C]0.044505[/C][C]0.336[/C][C]0.369052[/C][/ROW]
[ROW][C]32[/C][C]-0.062714[/C][C]-0.4735[/C][C]0.318839[/C][/ROW]
[ROW][C]33[/C][C]0.067265[/C][C]0.5078[/C][C]0.306762[/C][/ROW]
[ROW][C]34[/C][C]0.033067[/C][C]0.2496[/C][C]0.401879[/C][/ROW]
[ROW][C]35[/C][C]-0.094506[/C][C]-0.7135[/C][C]0.239223[/C][/ROW]
[ROW][C]36[/C][C]-0.017078[/C][C]-0.1289[/C][C]0.448931[/C][/ROW]
[ROW][C]37[/C][C]0.02737[/C][C]0.2066[/C][C]0.418515[/C][/ROW]
[ROW][C]38[/C][C]-0.062309[/C][C]-0.4704[/C][C]0.319923[/C][/ROW]
[ROW][C]39[/C][C]-0.051738[/C][C]-0.3906[/C][C]0.348771[/C][/ROW]
[ROW][C]40[/C][C]0.033181[/C][C]0.2505[/C][C]0.401547[/C][/ROW]
[ROW][C]41[/C][C]-0.107357[/C][C]-0.8105[/C][C]0.210504[/C][/ROW]
[ROW][C]42[/C][C]-0.024441[/C][C]-0.1845[/C][C]0.427127[/C][/ROW]
[ROW][C]43[/C][C]0.032455[/C][C]0.245[/C][C]0.403657[/C][/ROW]
[ROW][C]44[/C][C]-0.102558[/C][C]-0.7743[/C][C]0.220978[/C][/ROW]
[ROW][C]45[/C][C]-0.047219[/C][C]-0.3565[/C][C]0.361392[/C][/ROW]
[ROW][C]46[/C][C]0.064191[/C][C]0.4846[/C][C]0.314896[/C][/ROW]
[ROW][C]47[/C][C]-0.06468[/C][C]-0.4883[/C][C]0.313597[/C][/ROW]
[ROW][C]48[/C][C]-0.051629[/C][C]-0.3898[/C][C]0.349072[/C][/ROW]
[/TABLE]
Source: https://freestatistics.org/blog/index.php?pk=108737&T=1

Globally Unique Identifier (entire table): ba.freestatistics.org/blog/index.php?pk=108737&T=1

As an alternative you can also use a QR Code:  

The GUIDs for individual cells are displayed in the table below:

Autocorrelation Function
Time lag kACF(k)T-STATP-value
10.089990.67940.249815
2-0.239598-1.80890.037869
30.0247080.18650.426343
40.0872990.65910.256245
5-0.113996-0.86060.196519
6-0.041514-0.31340.377552
70.0112730.08510.466237
8-0.094539-0.71380.239147
90.041210.31110.378418
10-0.096764-0.73060.234022
110.0425040.32090.374731
120.1224490.92450.17957
130.0377130.28470.388443
14-0.078789-0.59480.277152
150.1550051.17030.123383
160.1665941.25780.106805
17-0.158071-1.19340.118827
18-0.140661-1.0620.146365
19-0.080057-0.60440.273982
200.0854220.64490.260783
21-0.09287-0.70120.243031
220.0635640.47990.316568
230.0735750.55550.290371
24-0.024083-0.18180.428183
25-0.133155-1.00530.159502
260.0272090.20540.418987
270.1310520.98940.163319
28-0.011624-0.08780.465187
29-0.038676-0.2920.385674
30-0.059-0.44540.328845
310.0445050.3360.369052
32-0.062714-0.47350.318839
330.0672650.50780.306762
340.0330670.24960.401879
35-0.094506-0.71350.239223
36-0.017078-0.12890.448931
370.027370.20660.418515
38-0.062309-0.47040.319923
39-0.051738-0.39060.348771
400.0331810.25050.401547
41-0.107357-0.81050.210504
42-0.024441-0.18450.427127
430.0324550.2450.403657
44-0.102558-0.77430.220978
45-0.047219-0.35650.361392
460.0641910.48460.314896
47-0.06468-0.48830.313597
48-0.051629-0.38980.349072


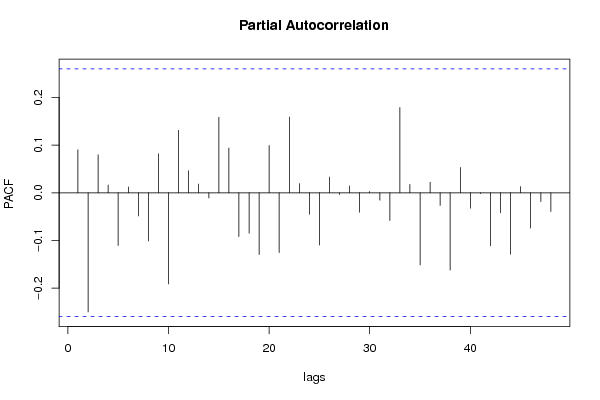
Partial Autocorrelation Function
Time lag kPACF(k)T-STATP-value
10.089990.67940.249815
2-0.249719-1.88530.032243
30.0797010.60170.274871
40.0160980.12150.451847
5-0.110416-0.83360.203987
60.0122090.09220.463442
7-0.048519-0.36630.357744
8-0.101034-0.76280.224367
90.0817590.61730.269758
10-0.19107-1.44250.07731
110.1308710.98810.16365
120.046020.34740.36477
130.0183070.13820.44528
14-0.010767-0.08130.467748
150.1581181.19380.118757
160.0938730.70870.240692
17-0.091715-0.69240.245739
18-0.084706-0.63950.262524
19-0.129519-0.97780.166142
200.0990520.74780.228819
21-0.125176-0.94510.17431
220.158771.19870.117804
230.0193830.14630.442084
24-0.044963-0.33950.367755
25-0.109513-0.82680.205898
260.0328860.24830.402405
27-0.003361-0.02540.489922
280.0144570.10910.456734
29-0.04066-0.3070.379989
300.002750.02080.491753
31-0.015378-0.11610.453991
32-0.058263-0.43990.330845
330.1788061.350.091183
340.0176480.13320.447236
35-0.151222-1.14170.129176
360.0221670.16740.433842
37-0.026578-0.20070.42084
38-0.161859-1.2220.113367
390.0530690.40070.345083
40-0.032292-0.24380.404132
41-0.001499-0.01130.495505
42-0.111139-0.83910.202464
43-0.041887-0.31620.376488
44-0.128768-0.97220.167536
450.0129840.0980.461127
46-0.073867-0.55770.289622
47-0.018494-0.13960.444723
48-0.039337-0.2970.383778

\begin{tabular}{lllllllll}
\hline
Partial Autocorrelation Function \tabularnewline
Time lag k & PACF(k) & T-STAT & P-value \tabularnewline
1 & 0.08999 & 0.6794 & 0.249815 \tabularnewline
2 & -0.249719 & -1.8853 & 0.032243 \tabularnewline
3 & 0.079701 & 0.6017 & 0.274871 \tabularnewline
4 & 0.016098 & 0.1215 & 0.451847 \tabularnewline
5 & -0.110416 & -0.8336 & 0.203987 \tabularnewline
6 & 0.012209 & 0.0922 & 0.463442 \tabularnewline
7 & -0.048519 & -0.3663 & 0.357744 \tabularnewline
8 & -0.101034 & -0.7628 & 0.224367 \tabularnewline
9 & 0.081759 & 0.6173 & 0.269758 \tabularnewline
10 & -0.19107 & -1.4425 & 0.07731 \tabularnewline
11 & 0.130871 & 0.9881 & 0.16365 \tabularnewline
12 & 0.04602 & 0.3474 & 0.36477 \tabularnewline
13 & 0.018307 & 0.1382 & 0.44528 \tabularnewline
14 & -0.010767 & -0.0813 & 0.467748 \tabularnewline
15 & 0.158118 & 1.1938 & 0.118757 \tabularnewline
16 & 0.093873 & 0.7087 & 0.240692 \tabularnewline
17 & -0.091715 & -0.6924 & 0.245739 \tabularnewline
18 & -0.084706 & -0.6395 & 0.262524 \tabularnewline
19 & -0.129519 & -0.9778 & 0.166142 \tabularnewline
20 & 0.099052 & 0.7478 & 0.228819 \tabularnewline
21 & -0.125176 & -0.9451 & 0.17431 \tabularnewline
22 & 0.15877 & 1.1987 & 0.117804 \tabularnewline
23 & 0.019383 & 0.1463 & 0.442084 \tabularnewline
24 & -0.044963 & -0.3395 & 0.367755 \tabularnewline
25 & -0.109513 & -0.8268 & 0.205898 \tabularnewline
26 & 0.032886 & 0.2483 & 0.402405 \tabularnewline
27 & -0.003361 & -0.0254 & 0.489922 \tabularnewline
28 & 0.014457 & 0.1091 & 0.456734 \tabularnewline
29 & -0.04066 & -0.307 & 0.379989 \tabularnewline
30 & 0.00275 & 0.0208 & 0.491753 \tabularnewline
31 & -0.015378 & -0.1161 & 0.453991 \tabularnewline
32 & -0.058263 & -0.4399 & 0.330845 \tabularnewline
33 & 0.178806 & 1.35 & 0.091183 \tabularnewline
34 & 0.017648 & 0.1332 & 0.447236 \tabularnewline
35 & -0.151222 & -1.1417 & 0.129176 \tabularnewline
36 & 0.022167 & 0.1674 & 0.433842 \tabularnewline
37 & -0.026578 & -0.2007 & 0.42084 \tabularnewline
38 & -0.161859 & -1.222 & 0.113367 \tabularnewline
39 & 0.053069 & 0.4007 & 0.345083 \tabularnewline
40 & -0.032292 & -0.2438 & 0.404132 \tabularnewline
41 & -0.001499 & -0.0113 & 0.495505 \tabularnewline
42 & -0.111139 & -0.8391 & 0.202464 \tabularnewline
43 & -0.041887 & -0.3162 & 0.376488 \tabularnewline
44 & -0.128768 & -0.9722 & 0.167536 \tabularnewline
45 & 0.012984 & 0.098 & 0.461127 \tabularnewline
46 & -0.073867 & -0.5577 & 0.289622 \tabularnewline
47 & -0.018494 & -0.1396 & 0.444723 \tabularnewline
48 & -0.039337 & -0.297 & 0.383778 \tabularnewline
\hline
\end{tabular}
%Source: https://freestatistics.org/blog/index.php?pk=108737&T=2

[TABLE]
[ROW][C]Partial Autocorrelation Function[/C][/ROW]
[ROW][C]Time lag k[/C][C]PACF(k)[/C][C]T-STAT[/C][C]P-value[/C][/ROW]
[ROW][C]1[/C][C]0.08999[/C][C]0.6794[/C][C]0.249815[/C][/ROW]
[ROW][C]2[/C][C]-0.249719[/C][C]-1.8853[/C][C]0.032243[/C][/ROW]
[ROW][C]3[/C][C]0.079701[/C][C]0.6017[/C][C]0.274871[/C][/ROW]
[ROW][C]4[/C][C]0.016098[/C][C]0.1215[/C][C]0.451847[/C][/ROW]
[ROW][C]5[/C][C]-0.110416[/C][C]-0.8336[/C][C]0.203987[/C][/ROW]
[ROW][C]6[/C][C]0.012209[/C][C]0.0922[/C][C]0.463442[/C][/ROW]
[ROW][C]7[/C][C]-0.048519[/C][C]-0.3663[/C][C]0.357744[/C][/ROW]
[ROW][C]8[/C][C]-0.101034[/C][C]-0.7628[/C][C]0.224367[/C][/ROW]
[ROW][C]9[/C][C]0.081759[/C][C]0.6173[/C][C]0.269758[/C][/ROW]
[ROW][C]10[/C][C]-0.19107[/C][C]-1.4425[/C][C]0.07731[/C][/ROW]
[ROW][C]11[/C][C]0.130871[/C][C]0.9881[/C][C]0.16365[/C][/ROW]
[ROW][C]12[/C][C]0.04602[/C][C]0.3474[/C][C]0.36477[/C][/ROW]
[ROW][C]13[/C][C]0.018307[/C][C]0.1382[/C][C]0.44528[/C][/ROW]
[ROW][C]14[/C][C]-0.010767[/C][C]-0.0813[/C][C]0.467748[/C][/ROW]
[ROW][C]15[/C][C]0.158118[/C][C]1.1938[/C][C]0.118757[/C][/ROW]
[ROW][C]16[/C][C]0.093873[/C][C]0.7087[/C][C]0.240692[/C][/ROW]
[ROW][C]17[/C][C]-0.091715[/C][C]-0.6924[/C][C]0.245739[/C][/ROW]
[ROW][C]18[/C][C]-0.084706[/C][C]-0.6395[/C][C]0.262524[/C][/ROW]
[ROW][C]19[/C][C]-0.129519[/C][C]-0.9778[/C][C]0.166142[/C][/ROW]
[ROW][C]20[/C][C]0.099052[/C][C]0.7478[/C][C]0.228819[/C][/ROW]
[ROW][C]21[/C][C]-0.125176[/C][C]-0.9451[/C][C]0.17431[/C][/ROW]
[ROW][C]22[/C][C]0.15877[/C][C]1.1987[/C][C]0.117804[/C][/ROW]
[ROW][C]23[/C][C]0.019383[/C][C]0.1463[/C][C]0.442084[/C][/ROW]
[ROW][C]24[/C][C]-0.044963[/C][C]-0.3395[/C][C]0.367755[/C][/ROW]
[ROW][C]25[/C][C]-0.109513[/C][C]-0.8268[/C][C]0.205898[/C][/ROW]
[ROW][C]26[/C][C]0.032886[/C][C]0.2483[/C][C]0.402405[/C][/ROW]
[ROW][C]27[/C][C]-0.003361[/C][C]-0.0254[/C][C]0.489922[/C][/ROW]
[ROW][C]28[/C][C]0.014457[/C][C]0.1091[/C][C]0.456734[/C][/ROW]
[ROW][C]29[/C][C]-0.04066[/C][C]-0.307[/C][C]0.379989[/C][/ROW]
[ROW][C]30[/C][C]0.00275[/C][C]0.0208[/C][C]0.491753[/C][/ROW]
[ROW][C]31[/C][C]-0.015378[/C][C]-0.1161[/C][C]0.453991[/C][/ROW]
[ROW][C]32[/C][C]-0.058263[/C][C]-0.4399[/C][C]0.330845[/C][/ROW]
[ROW][C]33[/C][C]0.178806[/C][C]1.35[/C][C]0.091183[/C][/ROW]
[ROW][C]34[/C][C]0.017648[/C][C]0.1332[/C][C]0.447236[/C][/ROW]
[ROW][C]35[/C][C]-0.151222[/C][C]-1.1417[/C][C]0.129176[/C][/ROW]
[ROW][C]36[/C][C]0.022167[/C][C]0.1674[/C][C]0.433842[/C][/ROW]
[ROW][C]37[/C][C]-0.026578[/C][C]-0.2007[/C][C]0.42084[/C][/ROW]
[ROW][C]38[/C][C]-0.161859[/C][C]-1.222[/C][C]0.113367[/C][/ROW]
[ROW][C]39[/C][C]0.053069[/C][C]0.4007[/C][C]0.345083[/C][/ROW]
[ROW][C]40[/C][C]-0.032292[/C][C]-0.2438[/C][C]0.404132[/C][/ROW]
[ROW][C]41[/C][C]-0.001499[/C][C]-0.0113[/C][C]0.495505[/C][/ROW]
[ROW][C]42[/C][C]-0.111139[/C][C]-0.8391[/C][C]0.202464[/C][/ROW]
[ROW][C]43[/C][C]-0.041887[/C][C]-0.3162[/C][C]0.376488[/C][/ROW]
[ROW][C]44[/C][C]-0.128768[/C][C]-0.9722[/C][C]0.167536[/C][/ROW]
[ROW][C]45[/C][C]0.012984[/C][C]0.098[/C][C]0.461127[/C][/ROW]
[ROW][C]46[/C][C]-0.073867[/C][C]-0.5577[/C][C]0.289622[/C][/ROW]
[ROW][C]47[/C][C]-0.018494[/C][C]-0.1396[/C][C]0.444723[/C][/ROW]
[ROW][C]48[/C][C]-0.039337[/C][C]-0.297[/C][C]0.383778[/C][/ROW]
[/TABLE]
Source: https://freestatistics.org/blog/index.php?pk=108737&T=2

Globally Unique Identifier (entire table): ba.freestatistics.org/blog/index.php?pk=108737&T=2

As an alternative you can also use a QR Code:  

The GUIDs for individual cells are displayed in the table below:

Partial Autocorrelation Function
Time lag kPACF(k)T-STATP-value
10.089990.67940.249815
2-0.249719-1.88530.032243
30.0797010.60170.274871
40.0160980.12150.451847
5-0.110416-0.83360.203987
60.0122090.09220.463442
7-0.048519-0.36630.357744
8-0.101034-0.76280.224367
90.0817590.61730.269758
10-0.19107-1.44250.07731
110.1308710.98810.16365
120.046020.34740.36477
130.0183070.13820.44528
14-0.010767-0.08130.467748
150.1581181.19380.118757
160.0938730.70870.240692
17-0.091715-0.69240.245739
18-0.084706-0.63950.262524
19-0.129519-0.97780.166142
200.0990520.74780.228819
21-0.125176-0.94510.17431
220.158771.19870.117804
230.0193830.14630.442084
24-0.044963-0.33950.367755
25-0.109513-0.82680.205898
260.0328860.24830.402405
27-0.003361-0.02540.489922
280.0144570.10910.456734
29-0.04066-0.3070.379989
300.002750.02080.491753
31-0.015378-0.11610.453991
32-0.058263-0.43990.330845
330.1788061.350.091183
340.0176480.13320.447236
35-0.151222-1.14170.129176
360.0221670.16740.433842
37-0.026578-0.20070.42084
38-0.161859-1.2220.113367
390.0530690.40070.345083
40-0.032292-0.24380.404132
41-0.001499-0.01130.495505
42-0.111139-0.83910.202464
43-0.041887-0.31620.376488
44-0.128768-0.97220.167536
450.0129840.0980.461127
46-0.073867-0.55770.289622
47-0.018494-0.13960.444723
48-0.039337-0.2970.383778


Parameters (Session):
par1 = 48 ; par2 = 1 ; par3 = 0 ; par4 = 0 ; par5 = 12 ; par6 = White Noise ; par7 = 0.95 ;
Parameters (R input):
par1 = 48 ; par2 = 1 ; par3 = 1 ; par4 = 0 ; par5 = 12 ; par6 = White Noise ; par7 = 0.95 ;
R code (references can be found in the software module):
if (par1 == 'Default') {
par1 = 10*log10(length(x))
} else {
par1 <- as.numeric(par1)
}
par2 <- as.numeric(par2)
par3 <- as.numeric(par3)
par4 <- as.numeric(par4)
par5 <- as.numeric(par5)
if (par6 == 'White Noise') par6 <- 'white' else par6 <- 'ma'
par7 <- as.numeric(par7)
if (par2 == 0) {
x <- log(x)
} else {
x <- (x ^ par2 - 1) / par2
}
if (par3 > 0) x <- diff(x,lag=1,difference=par3)
if (par4 > 0) x <- diff(x,lag=par5,difference=par4)
bitmap(file='pic1.png')
racf <- acf(x, par1, main='Autocorrelation', xlab='time lag', ylab='ACF', ci.type=par6, ci=par7, sub=paste('(lambda=',par2,', d=',par3,', D=',par4,', CI=', par7, ', CI type=',par6,')',sep=''))
dev.off()
bitmap(file='pic2.png')
rpacf <- pacf(x,par1,main='Partial Autocorrelation',xlab='lags',ylab='PACF')
dev.off()
(myacf <- c(racf$acf))
(mypacf <- c(rpacf$acf))
lengthx <- length(x)
sqrtn <- sqrt(lengthx)
load(file='createtable')
a<-table.start()
a<-table.row.start(a)
a<-table.element(a,'Autocorrelation Function',4,TRUE)
a<-table.row.end(a)
a<-table.row.start(a)
a<-table.element(a,'Time lag k',header=TRUE)
a<-table.element(a,hyperlink('basics.htm','ACF(k)','click here for more information about the Autocorrelation Function'),header=TRUE)
a<-table.element(a,'T-STAT',header=TRUE)
a<-table.element(a,'P-value',header=TRUE)
a<-table.row.end(a)
for (i in 2:(par1+1)) {
a<-table.row.start(a)
a<-table.element(a,i-1,header=TRUE)
a<-table.element(a,round(myacf[i],6))
mytstat <- myacf[i]*sqrtn
a<-table.element(a,round(mytstat,4))
a<-table.element(a,round(1-pt(abs(mytstat),lengthx),6))
a<-table.row.end(a)
}
a<-table.end(a)
table.save(a,file='mytable.tab')
a<-table.start()
a<-table.row.start(a)
a<-table.element(a,'Partial Autocorrelation Function',4,TRUE)
a<-table.row.end(a)
a<-table.row.start(a)
a<-table.element(a,'Time lag k',header=TRUE)
a<-table.element(a,hyperlink('basics.htm','PACF(k)','click here for more information about the Partial Autocorrelation Function'),header=TRUE)
a<-table.element(a,'T-STAT',header=TRUE)
a<-table.element(a,'P-value',header=TRUE)
a<-table.row.end(a)
for (i in 1:par1) {
a<-table.row.start(a)
a<-table.element(a,i,header=TRUE)
a<-table.element(a,round(mypacf[i],6))
mytstat <- mypacf[i]*sqrtn
a<-table.element(a,round(mytstat,4))
a<-table.element(a,round(1-pt(abs(mytstat),lengthx),6))
a<-table.row.end(a)
}
a<-table.end(a)
table.save(a,file='mytable1.tab')