Free Statistics

of Irreproducible Research!

Author's title

Author*The author of this computation has been verified*
R Software Modulerwasp_autocorrelation.wasp
Title produced by software(Partial) Autocorrelation Function
Date of computationMon, 13 Dec 2010 09:24:16 +0000
Cite this page as followsStatistical Computations at FreeStatistics.org, Office for Research Development and Education, URL https://freestatistics.org/blog/index.php?v=date/2010/Dec/13/t1292232266ipq6juirh74njp7.htm/, Retrieved Tue, 07 May 2024 01:22:51 +0000
Statistical Computations at FreeStatistics.org, Office for Research Development and Education, URL https://freestatistics.org/blog/index.php?pk=108722, Retrieved Tue, 07 May 2024 01:22:51 +0000
QR Codes:

Original text written by user:
IsPrivate?No (this computation is public)
User-defined keywords
Estimated Impact182
Family? (F = Feedback message, R = changed R code, M = changed R Module, P = changed Parameters, D = changed Data)
-     [(Partial) Autocorrelation Function] [] [2010-12-13 08:35:23] [21eff0c210342db4afbdafe426a7c254]
-   PD    [(Partial) Autocorrelation Function] [] [2010-12-13 09:24:16] [81d69fb83507cea26168920232cdff1b] [Current]
Feedback Forum

Post a new message
Dataseries X:
113
95.4
86.2
111.7
97.5
99.7
111.5
91.8
86.3
88.7
95.1
105.1
104.5
89.1
82.6
102.7
91.8
94.1
103.1
93.2
91
94.3
99.4
115.7
116.8
99.8
96
115.9
109.1
117.3
109.8
112.8
110.7
100
113.3
122.4
112.5
104.2
92.5
117.2
109.3
106.1
118.8
105.3
106
102
112.9
116.5
114.8
100.5
85.4
114.6
109.9
100.7
115.5
100.7
99
102.3


Summary of computational transaction
Raw Inputview raw input (R code)
Raw Outputview raw output of R engine
Computing time2 seconds
R Server'RServer@AstonUniversity' @ vre.aston.ac.uk

\begin{tabular}{lllllllll}
\hline
Summary of computational transaction \tabularnewline
Raw Input & view raw input (R code)  \tabularnewline
Raw Output & view raw output of R engine  \tabularnewline
Computing time & 2 seconds \tabularnewline
R Server & 'RServer@AstonUniversity' @ vre.aston.ac.uk \tabularnewline
\hline
\end{tabular}
%Source: https://freestatistics.org/blog/index.php?pk=108722&T=0

[TABLE]
[ROW][C]Summary of computational transaction[/C][/ROW]
[ROW][C]Raw Input[/C][C]view raw input (R code) [/C][/ROW]
[ROW][C]Raw Output[/C][C]view raw output of R engine [/C][/ROW]
[ROW][C]Computing time[/C][C]2 seconds[/C][/ROW]
[ROW][C]R Server[/C][C]'RServer@AstonUniversity' @ vre.aston.ac.uk[/C][/ROW]
[/TABLE]
Source: https://freestatistics.org/blog/index.php?pk=108722&T=0

Globally Unique Identifier (entire table): ba.freestatistics.org/blog/index.php?pk=108722&T=0

As an alternative you can also use a QR Code:  

The GUIDs for individual cells are displayed in the table below:

Summary of computational transaction
Raw Inputview raw input (R code)
Raw Outputview raw output of R engine
Computing time2 seconds
R Server'RServer@AstonUniversity' @ vre.aston.ac.uk


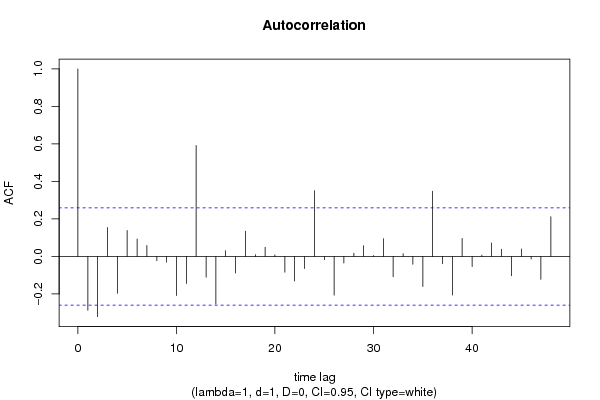
Autocorrelation Function
Time lag kACF(k)T-STATP-value
1-0.287273-2.16890.01714
2-0.320895-2.42270.009303
30.155031.17040.123346
4-0.1958-1.47830.072422
50.1389741.04920.149251
60.0931860.70350.242292
70.0587790.44380.329443
8-0.022485-0.16980.432899
9-0.030256-0.22840.410065
10-0.208299-1.57260.06067
11-0.14468-1.09230.139646
120.5921164.47041.9e-05
13-0.110137-0.83150.204577
14-0.253324-1.91260.030417
150.0303430.22910.409813
16-0.087775-0.66270.255101
170.1342511.01360.157536
180.0098370.07430.470528
190.0489880.36990.356432
200.0087720.06620.473713
21-0.08351-0.63050.265447
22-0.130977-0.98890.163457
23-0.06409-0.48390.315165
240.350952.64960.005205
25-0.017664-0.13340.447188
26-0.2064-1.55830.062351
27-0.034468-0.26020.397813
280.0169430.12790.449334
290.0570570.43080.334129
300.0050330.0380.484912
310.0942780.71180.23975
32-0.108017-0.81550.209088
330.0148890.11240.455447
34-0.041255-0.31150.378289
35-0.159783-1.20630.116336
360.3477192.62520.005549
37-0.038888-0.29360.385065
38-0.205772-1.55350.062914
390.0960920.72550.235562
40-0.053985-0.40760.342554
410.0072920.05510.478144
420.0723970.54660.293399
430.0384860.29060.386219
44-0.102527-0.77410.221047
450.0395860.29890.383065
46-0.013513-0.1020.459549
47-0.122072-0.92160.180306
480.2118051.59910.057664

\begin{tabular}{lllllllll}
\hline
Autocorrelation Function \tabularnewline
Time lag k & ACF(k) & T-STAT & P-value \tabularnewline
1 & -0.287273 & -2.1689 & 0.01714 \tabularnewline
2 & -0.320895 & -2.4227 & 0.009303 \tabularnewline
3 & 0.15503 & 1.1704 & 0.123346 \tabularnewline
4 & -0.1958 & -1.4783 & 0.072422 \tabularnewline
5 & 0.138974 & 1.0492 & 0.149251 \tabularnewline
6 & 0.093186 & 0.7035 & 0.242292 \tabularnewline
7 & 0.058779 & 0.4438 & 0.329443 \tabularnewline
8 & -0.022485 & -0.1698 & 0.432899 \tabularnewline
9 & -0.030256 & -0.2284 & 0.410065 \tabularnewline
10 & -0.208299 & -1.5726 & 0.06067 \tabularnewline
11 & -0.14468 & -1.0923 & 0.139646 \tabularnewline
12 & 0.592116 & 4.4704 & 1.9e-05 \tabularnewline
13 & -0.110137 & -0.8315 & 0.204577 \tabularnewline
14 & -0.253324 & -1.9126 & 0.030417 \tabularnewline
15 & 0.030343 & 0.2291 & 0.409813 \tabularnewline
16 & -0.087775 & -0.6627 & 0.255101 \tabularnewline
17 & 0.134251 & 1.0136 & 0.157536 \tabularnewline
18 & 0.009837 & 0.0743 & 0.470528 \tabularnewline
19 & 0.048988 & 0.3699 & 0.356432 \tabularnewline
20 & 0.008772 & 0.0662 & 0.473713 \tabularnewline
21 & -0.08351 & -0.6305 & 0.265447 \tabularnewline
22 & -0.130977 & -0.9889 & 0.163457 \tabularnewline
23 & -0.06409 & -0.4839 & 0.315165 \tabularnewline
24 & 0.35095 & 2.6496 & 0.005205 \tabularnewline
25 & -0.017664 & -0.1334 & 0.447188 \tabularnewline
26 & -0.2064 & -1.5583 & 0.062351 \tabularnewline
27 & -0.034468 & -0.2602 & 0.397813 \tabularnewline
28 & 0.016943 & 0.1279 & 0.449334 \tabularnewline
29 & 0.057057 & 0.4308 & 0.334129 \tabularnewline
30 & 0.005033 & 0.038 & 0.484912 \tabularnewline
31 & 0.094278 & 0.7118 & 0.23975 \tabularnewline
32 & -0.108017 & -0.8155 & 0.209088 \tabularnewline
33 & 0.014889 & 0.1124 & 0.455447 \tabularnewline
34 & -0.041255 & -0.3115 & 0.378289 \tabularnewline
35 & -0.159783 & -1.2063 & 0.116336 \tabularnewline
36 & 0.347719 & 2.6252 & 0.005549 \tabularnewline
37 & -0.038888 & -0.2936 & 0.385065 \tabularnewline
38 & -0.205772 & -1.5535 & 0.062914 \tabularnewline
39 & 0.096092 & 0.7255 & 0.235562 \tabularnewline
40 & -0.053985 & -0.4076 & 0.342554 \tabularnewline
41 & 0.007292 & 0.0551 & 0.478144 \tabularnewline
42 & 0.072397 & 0.5466 & 0.293399 \tabularnewline
43 & 0.038486 & 0.2906 & 0.386219 \tabularnewline
44 & -0.102527 & -0.7741 & 0.221047 \tabularnewline
45 & 0.039586 & 0.2989 & 0.383065 \tabularnewline
46 & -0.013513 & -0.102 & 0.459549 \tabularnewline
47 & -0.122072 & -0.9216 & 0.180306 \tabularnewline
48 & 0.211805 & 1.5991 & 0.057664 \tabularnewline
\hline
\end{tabular}
%Source: https://freestatistics.org/blog/index.php?pk=108722&T=1

[TABLE]
[ROW][C]Autocorrelation Function[/C][/ROW]
[ROW][C]Time lag k[/C][C]ACF(k)[/C][C]T-STAT[/C][C]P-value[/C][/ROW]
[ROW][C]1[/C][C]-0.287273[/C][C]-2.1689[/C][C]0.01714[/C][/ROW]
[ROW][C]2[/C][C]-0.320895[/C][C]-2.4227[/C][C]0.009303[/C][/ROW]
[ROW][C]3[/C][C]0.15503[/C][C]1.1704[/C][C]0.123346[/C][/ROW]
[ROW][C]4[/C][C]-0.1958[/C][C]-1.4783[/C][C]0.072422[/C][/ROW]
[ROW][C]5[/C][C]0.138974[/C][C]1.0492[/C][C]0.149251[/C][/ROW]
[ROW][C]6[/C][C]0.093186[/C][C]0.7035[/C][C]0.242292[/C][/ROW]
[ROW][C]7[/C][C]0.058779[/C][C]0.4438[/C][C]0.329443[/C][/ROW]
[ROW][C]8[/C][C]-0.022485[/C][C]-0.1698[/C][C]0.432899[/C][/ROW]
[ROW][C]9[/C][C]-0.030256[/C][C]-0.2284[/C][C]0.410065[/C][/ROW]
[ROW][C]10[/C][C]-0.208299[/C][C]-1.5726[/C][C]0.06067[/C][/ROW]
[ROW][C]11[/C][C]-0.14468[/C][C]-1.0923[/C][C]0.139646[/C][/ROW]
[ROW][C]12[/C][C]0.592116[/C][C]4.4704[/C][C]1.9e-05[/C][/ROW]
[ROW][C]13[/C][C]-0.110137[/C][C]-0.8315[/C][C]0.204577[/C][/ROW]
[ROW][C]14[/C][C]-0.253324[/C][C]-1.9126[/C][C]0.030417[/C][/ROW]
[ROW][C]15[/C][C]0.030343[/C][C]0.2291[/C][C]0.409813[/C][/ROW]
[ROW][C]16[/C][C]-0.087775[/C][C]-0.6627[/C][C]0.255101[/C][/ROW]
[ROW][C]17[/C][C]0.134251[/C][C]1.0136[/C][C]0.157536[/C][/ROW]
[ROW][C]18[/C][C]0.009837[/C][C]0.0743[/C][C]0.470528[/C][/ROW]
[ROW][C]19[/C][C]0.048988[/C][C]0.3699[/C][C]0.356432[/C][/ROW]
[ROW][C]20[/C][C]0.008772[/C][C]0.0662[/C][C]0.473713[/C][/ROW]
[ROW][C]21[/C][C]-0.08351[/C][C]-0.6305[/C][C]0.265447[/C][/ROW]
[ROW][C]22[/C][C]-0.130977[/C][C]-0.9889[/C][C]0.163457[/C][/ROW]
[ROW][C]23[/C][C]-0.06409[/C][C]-0.4839[/C][C]0.315165[/C][/ROW]
[ROW][C]24[/C][C]0.35095[/C][C]2.6496[/C][C]0.005205[/C][/ROW]
[ROW][C]25[/C][C]-0.017664[/C][C]-0.1334[/C][C]0.447188[/C][/ROW]
[ROW][C]26[/C][C]-0.2064[/C][C]-1.5583[/C][C]0.062351[/C][/ROW]
[ROW][C]27[/C][C]-0.034468[/C][C]-0.2602[/C][C]0.397813[/C][/ROW]
[ROW][C]28[/C][C]0.016943[/C][C]0.1279[/C][C]0.449334[/C][/ROW]
[ROW][C]29[/C][C]0.057057[/C][C]0.4308[/C][C]0.334129[/C][/ROW]
[ROW][C]30[/C][C]0.005033[/C][C]0.038[/C][C]0.484912[/C][/ROW]
[ROW][C]31[/C][C]0.094278[/C][C]0.7118[/C][C]0.23975[/C][/ROW]
[ROW][C]32[/C][C]-0.108017[/C][C]-0.8155[/C][C]0.209088[/C][/ROW]
[ROW][C]33[/C][C]0.014889[/C][C]0.1124[/C][C]0.455447[/C][/ROW]
[ROW][C]34[/C][C]-0.041255[/C][C]-0.3115[/C][C]0.378289[/C][/ROW]
[ROW][C]35[/C][C]-0.159783[/C][C]-1.2063[/C][C]0.116336[/C][/ROW]
[ROW][C]36[/C][C]0.347719[/C][C]2.6252[/C][C]0.005549[/C][/ROW]
[ROW][C]37[/C][C]-0.038888[/C][C]-0.2936[/C][C]0.385065[/C][/ROW]
[ROW][C]38[/C][C]-0.205772[/C][C]-1.5535[/C][C]0.062914[/C][/ROW]
[ROW][C]39[/C][C]0.096092[/C][C]0.7255[/C][C]0.235562[/C][/ROW]
[ROW][C]40[/C][C]-0.053985[/C][C]-0.4076[/C][C]0.342554[/C][/ROW]
[ROW][C]41[/C][C]0.007292[/C][C]0.0551[/C][C]0.478144[/C][/ROW]
[ROW][C]42[/C][C]0.072397[/C][C]0.5466[/C][C]0.293399[/C][/ROW]
[ROW][C]43[/C][C]0.038486[/C][C]0.2906[/C][C]0.386219[/C][/ROW]
[ROW][C]44[/C][C]-0.102527[/C][C]-0.7741[/C][C]0.221047[/C][/ROW]
[ROW][C]45[/C][C]0.039586[/C][C]0.2989[/C][C]0.383065[/C][/ROW]
[ROW][C]46[/C][C]-0.013513[/C][C]-0.102[/C][C]0.459549[/C][/ROW]
[ROW][C]47[/C][C]-0.122072[/C][C]-0.9216[/C][C]0.180306[/C][/ROW]
[ROW][C]48[/C][C]0.211805[/C][C]1.5991[/C][C]0.057664[/C][/ROW]
[/TABLE]
Source: https://freestatistics.org/blog/index.php?pk=108722&T=1

Globally Unique Identifier (entire table): ba.freestatistics.org/blog/index.php?pk=108722&T=1

As an alternative you can also use a QR Code:  

The GUIDs for individual cells are displayed in the table below:

Autocorrelation Function
Time lag kACF(k)T-STATP-value
1-0.287273-2.16890.01714
2-0.320895-2.42270.009303
30.155031.17040.123346
4-0.1958-1.47830.072422
50.1389741.04920.149251
60.0931860.70350.242292
70.0587790.44380.329443
8-0.022485-0.16980.432899
9-0.030256-0.22840.410065
10-0.208299-1.57260.06067
11-0.14468-1.09230.139646
120.5921164.47041.9e-05
13-0.110137-0.83150.204577
14-0.253324-1.91260.030417
150.0303430.22910.409813
16-0.087775-0.66270.255101
170.1342511.01360.157536
180.0098370.07430.470528
190.0489880.36990.356432
200.0087720.06620.473713
21-0.08351-0.63050.265447
22-0.130977-0.98890.163457
23-0.06409-0.48390.315165
240.350952.64960.005205
25-0.017664-0.13340.447188
26-0.2064-1.55830.062351
27-0.034468-0.26020.397813
280.0169430.12790.449334
290.0570570.43080.334129
300.0050330.0380.484912
310.0942780.71180.23975
32-0.108017-0.81550.209088
330.0148890.11240.455447
34-0.041255-0.31150.378289
35-0.159783-1.20630.116336
360.3477192.62520.005549
37-0.038888-0.29360.385065
38-0.205772-1.55350.062914
390.0960920.72550.235562
40-0.053985-0.40760.342554
410.0072920.05510.478144
420.0723970.54660.293399
430.0384860.29060.386219
44-0.102527-0.77410.221047
450.0395860.29890.383065
46-0.013513-0.1020.459549
47-0.122072-0.92160.180306
480.2118051.59910.057664


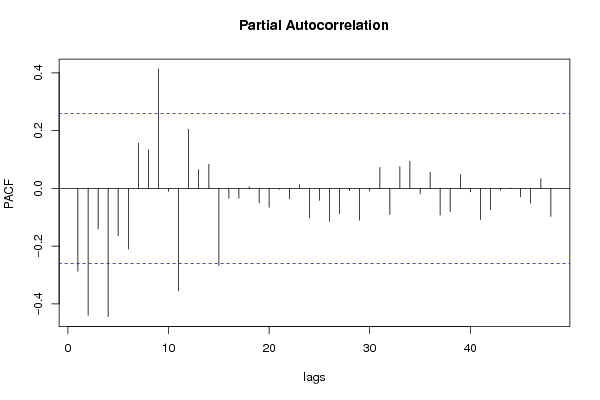
Partial Autocorrelation Function
Time lag kPACF(k)T-STATP-value
1-0.287273-2.16890.01714
2-0.439708-3.31970.000788
3-0.140531-1.0610.146586
4-0.444158-3.35330.000712
5-0.163672-1.23570.11082
6-0.210041-1.58580.059162
70.1567151.18320.120826
80.1339671.01140.158043
90.4135753.12240.001408
10-0.009764-0.07370.470748
11-0.354671-2.67770.004833
120.2046281.54490.063951
130.064680.48830.313597
140.0836190.63130.265181
15-0.267092-2.01650.024234
16-0.033948-0.25630.39932
17-0.033929-0.25620.399376
180.0056960.0430.482924
19-0.049641-0.37480.354606
20-0.065248-0.49260.312091
21-0.002843-0.02150.491474
22-0.035715-0.26960.394204
230.0128850.09730.461422
24-0.102919-0.7770.22018
25-0.041635-0.31430.377206
26-0.113998-0.86070.196514
27-0.087513-0.66070.25573
28-0.007819-0.0590.476565
29-0.109957-0.83020.204958
30-0.0092-0.06950.472435
310.0726910.54880.292642
32-0.090571-0.68380.248436
330.075130.56720.286396
340.0940810.71030.240207
35-0.018784-0.14180.443864
360.0555620.41950.338219
37-0.09201-0.69470.245044
38-0.080372-0.60680.273197
390.0473330.35740.361073
40-0.011894-0.08980.46438
41-0.107564-0.81210.210059
42-0.073611-0.55570.290278
43-0.006926-0.05230.479242
440.0010630.0080.496813
45-0.029535-0.2230.412173
46-0.051802-0.39110.348591
470.0337010.25440.400036
48-0.097107-0.73310.233238

\begin{tabular}{lllllllll}
\hline
Partial Autocorrelation Function \tabularnewline
Time lag k & PACF(k) & T-STAT & P-value \tabularnewline
1 & -0.287273 & -2.1689 & 0.01714 \tabularnewline
2 & -0.439708 & -3.3197 & 0.000788 \tabularnewline
3 & -0.140531 & -1.061 & 0.146586 \tabularnewline
4 & -0.444158 & -3.3533 & 0.000712 \tabularnewline
5 & -0.163672 & -1.2357 & 0.11082 \tabularnewline
6 & -0.210041 & -1.5858 & 0.059162 \tabularnewline
7 & 0.156715 & 1.1832 & 0.120826 \tabularnewline
8 & 0.133967 & 1.0114 & 0.158043 \tabularnewline
9 & 0.413575 & 3.1224 & 0.001408 \tabularnewline
10 & -0.009764 & -0.0737 & 0.470748 \tabularnewline
11 & -0.354671 & -2.6777 & 0.004833 \tabularnewline
12 & 0.204628 & 1.5449 & 0.063951 \tabularnewline
13 & 0.06468 & 0.4883 & 0.313597 \tabularnewline
14 & 0.083619 & 0.6313 & 0.265181 \tabularnewline
15 & -0.267092 & -2.0165 & 0.024234 \tabularnewline
16 & -0.033948 & -0.2563 & 0.39932 \tabularnewline
17 & -0.033929 & -0.2562 & 0.399376 \tabularnewline
18 & 0.005696 & 0.043 & 0.482924 \tabularnewline
19 & -0.049641 & -0.3748 & 0.354606 \tabularnewline
20 & -0.065248 & -0.4926 & 0.312091 \tabularnewline
21 & -0.002843 & -0.0215 & 0.491474 \tabularnewline
22 & -0.035715 & -0.2696 & 0.394204 \tabularnewline
23 & 0.012885 & 0.0973 & 0.461422 \tabularnewline
24 & -0.102919 & -0.777 & 0.22018 \tabularnewline
25 & -0.041635 & -0.3143 & 0.377206 \tabularnewline
26 & -0.113998 & -0.8607 & 0.196514 \tabularnewline
27 & -0.087513 & -0.6607 & 0.25573 \tabularnewline
28 & -0.007819 & -0.059 & 0.476565 \tabularnewline
29 & -0.109957 & -0.8302 & 0.204958 \tabularnewline
30 & -0.0092 & -0.0695 & 0.472435 \tabularnewline
31 & 0.072691 & 0.5488 & 0.292642 \tabularnewline
32 & -0.090571 & -0.6838 & 0.248436 \tabularnewline
33 & 0.07513 & 0.5672 & 0.286396 \tabularnewline
34 & 0.094081 & 0.7103 & 0.240207 \tabularnewline
35 & -0.018784 & -0.1418 & 0.443864 \tabularnewline
36 & 0.055562 & 0.4195 & 0.338219 \tabularnewline
37 & -0.09201 & -0.6947 & 0.245044 \tabularnewline
38 & -0.080372 & -0.6068 & 0.273197 \tabularnewline
39 & 0.047333 & 0.3574 & 0.361073 \tabularnewline
40 & -0.011894 & -0.0898 & 0.46438 \tabularnewline
41 & -0.107564 & -0.8121 & 0.210059 \tabularnewline
42 & -0.073611 & -0.5557 & 0.290278 \tabularnewline
43 & -0.006926 & -0.0523 & 0.479242 \tabularnewline
44 & 0.001063 & 0.008 & 0.496813 \tabularnewline
45 & -0.029535 & -0.223 & 0.412173 \tabularnewline
46 & -0.051802 & -0.3911 & 0.348591 \tabularnewline
47 & 0.033701 & 0.2544 & 0.400036 \tabularnewline
48 & -0.097107 & -0.7331 & 0.233238 \tabularnewline
\hline
\end{tabular}
%Source: https://freestatistics.org/blog/index.php?pk=108722&T=2

[TABLE]
[ROW][C]Partial Autocorrelation Function[/C][/ROW]
[ROW][C]Time lag k[/C][C]PACF(k)[/C][C]T-STAT[/C][C]P-value[/C][/ROW]
[ROW][C]1[/C][C]-0.287273[/C][C]-2.1689[/C][C]0.01714[/C][/ROW]
[ROW][C]2[/C][C]-0.439708[/C][C]-3.3197[/C][C]0.000788[/C][/ROW]
[ROW][C]3[/C][C]-0.140531[/C][C]-1.061[/C][C]0.146586[/C][/ROW]
[ROW][C]4[/C][C]-0.444158[/C][C]-3.3533[/C][C]0.000712[/C][/ROW]
[ROW][C]5[/C][C]-0.163672[/C][C]-1.2357[/C][C]0.11082[/C][/ROW]
[ROW][C]6[/C][C]-0.210041[/C][C]-1.5858[/C][C]0.059162[/C][/ROW]
[ROW][C]7[/C][C]0.156715[/C][C]1.1832[/C][C]0.120826[/C][/ROW]
[ROW][C]8[/C][C]0.133967[/C][C]1.0114[/C][C]0.158043[/C][/ROW]
[ROW][C]9[/C][C]0.413575[/C][C]3.1224[/C][C]0.001408[/C][/ROW]
[ROW][C]10[/C][C]-0.009764[/C][C]-0.0737[/C][C]0.470748[/C][/ROW]
[ROW][C]11[/C][C]-0.354671[/C][C]-2.6777[/C][C]0.004833[/C][/ROW]
[ROW][C]12[/C][C]0.204628[/C][C]1.5449[/C][C]0.063951[/C][/ROW]
[ROW][C]13[/C][C]0.06468[/C][C]0.4883[/C][C]0.313597[/C][/ROW]
[ROW][C]14[/C][C]0.083619[/C][C]0.6313[/C][C]0.265181[/C][/ROW]
[ROW][C]15[/C][C]-0.267092[/C][C]-2.0165[/C][C]0.024234[/C][/ROW]
[ROW][C]16[/C][C]-0.033948[/C][C]-0.2563[/C][C]0.39932[/C][/ROW]
[ROW][C]17[/C][C]-0.033929[/C][C]-0.2562[/C][C]0.399376[/C][/ROW]
[ROW][C]18[/C][C]0.005696[/C][C]0.043[/C][C]0.482924[/C][/ROW]
[ROW][C]19[/C][C]-0.049641[/C][C]-0.3748[/C][C]0.354606[/C][/ROW]
[ROW][C]20[/C][C]-0.065248[/C][C]-0.4926[/C][C]0.312091[/C][/ROW]
[ROW][C]21[/C][C]-0.002843[/C][C]-0.0215[/C][C]0.491474[/C][/ROW]
[ROW][C]22[/C][C]-0.035715[/C][C]-0.2696[/C][C]0.394204[/C][/ROW]
[ROW][C]23[/C][C]0.012885[/C][C]0.0973[/C][C]0.461422[/C][/ROW]
[ROW][C]24[/C][C]-0.102919[/C][C]-0.777[/C][C]0.22018[/C][/ROW]
[ROW][C]25[/C][C]-0.041635[/C][C]-0.3143[/C][C]0.377206[/C][/ROW]
[ROW][C]26[/C][C]-0.113998[/C][C]-0.8607[/C][C]0.196514[/C][/ROW]
[ROW][C]27[/C][C]-0.087513[/C][C]-0.6607[/C][C]0.25573[/C][/ROW]
[ROW][C]28[/C][C]-0.007819[/C][C]-0.059[/C][C]0.476565[/C][/ROW]
[ROW][C]29[/C][C]-0.109957[/C][C]-0.8302[/C][C]0.204958[/C][/ROW]
[ROW][C]30[/C][C]-0.0092[/C][C]-0.0695[/C][C]0.472435[/C][/ROW]
[ROW][C]31[/C][C]0.072691[/C][C]0.5488[/C][C]0.292642[/C][/ROW]
[ROW][C]32[/C][C]-0.090571[/C][C]-0.6838[/C][C]0.248436[/C][/ROW]
[ROW][C]33[/C][C]0.07513[/C][C]0.5672[/C][C]0.286396[/C][/ROW]
[ROW][C]34[/C][C]0.094081[/C][C]0.7103[/C][C]0.240207[/C][/ROW]
[ROW][C]35[/C][C]-0.018784[/C][C]-0.1418[/C][C]0.443864[/C][/ROW]
[ROW][C]36[/C][C]0.055562[/C][C]0.4195[/C][C]0.338219[/C][/ROW]
[ROW][C]37[/C][C]-0.09201[/C][C]-0.6947[/C][C]0.245044[/C][/ROW]
[ROW][C]38[/C][C]-0.080372[/C][C]-0.6068[/C][C]0.273197[/C][/ROW]
[ROW][C]39[/C][C]0.047333[/C][C]0.3574[/C][C]0.361073[/C][/ROW]
[ROW][C]40[/C][C]-0.011894[/C][C]-0.0898[/C][C]0.46438[/C][/ROW]
[ROW][C]41[/C][C]-0.107564[/C][C]-0.8121[/C][C]0.210059[/C][/ROW]
[ROW][C]42[/C][C]-0.073611[/C][C]-0.5557[/C][C]0.290278[/C][/ROW]
[ROW][C]43[/C][C]-0.006926[/C][C]-0.0523[/C][C]0.479242[/C][/ROW]
[ROW][C]44[/C][C]0.001063[/C][C]0.008[/C][C]0.496813[/C][/ROW]
[ROW][C]45[/C][C]-0.029535[/C][C]-0.223[/C][C]0.412173[/C][/ROW]
[ROW][C]46[/C][C]-0.051802[/C][C]-0.3911[/C][C]0.348591[/C][/ROW]
[ROW][C]47[/C][C]0.033701[/C][C]0.2544[/C][C]0.400036[/C][/ROW]
[ROW][C]48[/C][C]-0.097107[/C][C]-0.7331[/C][C]0.233238[/C][/ROW]
[/TABLE]
Source: https://freestatistics.org/blog/index.php?pk=108722&T=2

Globally Unique Identifier (entire table): ba.freestatistics.org/blog/index.php?pk=108722&T=2

As an alternative you can also use a QR Code:  

The GUIDs for individual cells are displayed in the table below:

Partial Autocorrelation Function
Time lag kPACF(k)T-STATP-value
1-0.287273-2.16890.01714
2-0.439708-3.31970.000788
3-0.140531-1.0610.146586
4-0.444158-3.35330.000712
5-0.163672-1.23570.11082
6-0.210041-1.58580.059162
70.1567151.18320.120826
80.1339671.01140.158043
90.4135753.12240.001408
10-0.009764-0.07370.470748
11-0.354671-2.67770.004833
120.2046281.54490.063951
130.064680.48830.313597
140.0836190.63130.265181
15-0.267092-2.01650.024234
16-0.033948-0.25630.39932
17-0.033929-0.25620.399376
180.0056960.0430.482924
19-0.049641-0.37480.354606
20-0.065248-0.49260.312091
21-0.002843-0.02150.491474
22-0.035715-0.26960.394204
230.0128850.09730.461422
24-0.102919-0.7770.22018
25-0.041635-0.31430.377206
26-0.113998-0.86070.196514
27-0.087513-0.66070.25573
28-0.007819-0.0590.476565
29-0.109957-0.83020.204958
30-0.0092-0.06950.472435
310.0726910.54880.292642
32-0.090571-0.68380.248436
330.075130.56720.286396
340.0940810.71030.240207
35-0.018784-0.14180.443864
360.0555620.41950.338219
37-0.09201-0.69470.245044
38-0.080372-0.60680.273197
390.0473330.35740.361073
40-0.011894-0.08980.46438
41-0.107564-0.81210.210059
42-0.073611-0.55570.290278
43-0.006926-0.05230.479242
440.0010630.0080.496813
45-0.029535-0.2230.412173
46-0.051802-0.39110.348591
470.0337010.25440.400036
48-0.097107-0.73310.233238


Parameters (Session):
par1 = 48 ; par2 = 1 ; par3 = 0 ; par4 = 0 ; par5 = 12 ; par6 = White Noise ; par7 = 0.95 ;
Parameters (R input):
par1 = 48 ; par2 = 1 ; par3 = 1 ; par4 = 0 ; par5 = 12 ; par6 = White Noise ; par7 = 0.95 ;
R code (references can be found in the software module):
if (par1 == 'Default') {
par1 = 10*log10(length(x))
} else {
par1 <- as.numeric(par1)
}
par2 <- as.numeric(par2)
par3 <- as.numeric(par3)
par4 <- as.numeric(par4)
par5 <- as.numeric(par5)
if (par6 == 'White Noise') par6 <- 'white' else par6 <- 'ma'
par7 <- as.numeric(par7)
if (par2 == 0) {
x <- log(x)
} else {
x <- (x ^ par2 - 1) / par2
}
if (par3 > 0) x <- diff(x,lag=1,difference=par3)
if (par4 > 0) x <- diff(x,lag=par5,difference=par4)
bitmap(file='pic1.png')
racf <- acf(x, par1, main='Autocorrelation', xlab='time lag', ylab='ACF', ci.type=par6, ci=par7, sub=paste('(lambda=',par2,', d=',par3,', D=',par4,', CI=', par7, ', CI type=',par6,')',sep=''))
dev.off()
bitmap(file='pic2.png')
rpacf <- pacf(x,par1,main='Partial Autocorrelation',xlab='lags',ylab='PACF')
dev.off()
(myacf <- c(racf$acf))
(mypacf <- c(rpacf$acf))
lengthx <- length(x)
sqrtn <- sqrt(lengthx)
load(file='createtable')
a<-table.start()
a<-table.row.start(a)
a<-table.element(a,'Autocorrelation Function',4,TRUE)
a<-table.row.end(a)
a<-table.row.start(a)
a<-table.element(a,'Time lag k',header=TRUE)
a<-table.element(a,hyperlink('basics.htm','ACF(k)','click here for more information about the Autocorrelation Function'),header=TRUE)
a<-table.element(a,'T-STAT',header=TRUE)
a<-table.element(a,'P-value',header=TRUE)
a<-table.row.end(a)
for (i in 2:(par1+1)) {
a<-table.row.start(a)
a<-table.element(a,i-1,header=TRUE)
a<-table.element(a,round(myacf[i],6))
mytstat <- myacf[i]*sqrtn
a<-table.element(a,round(mytstat,4))
a<-table.element(a,round(1-pt(abs(mytstat),lengthx),6))
a<-table.row.end(a)
}
a<-table.end(a)
table.save(a,file='mytable.tab')
a<-table.start()
a<-table.row.start(a)
a<-table.element(a,'Partial Autocorrelation Function',4,TRUE)
a<-table.row.end(a)
a<-table.row.start(a)
a<-table.element(a,'Time lag k',header=TRUE)
a<-table.element(a,hyperlink('basics.htm','PACF(k)','click here for more information about the Partial Autocorrelation Function'),header=TRUE)
a<-table.element(a,'T-STAT',header=TRUE)
a<-table.element(a,'P-value',header=TRUE)
a<-table.row.end(a)
for (i in 1:par1) {
a<-table.row.start(a)
a<-table.element(a,i,header=TRUE)
a<-table.element(a,round(mypacf[i],6))
mytstat <- mypacf[i]*sqrtn
a<-table.element(a,round(mytstat,4))
a<-table.element(a,round(1-pt(abs(mytstat),lengthx),6))
a<-table.row.end(a)
}
a<-table.end(a)
table.save(a,file='mytable1.tab')