Free Statistics

of Irreproducible Research!

Author's title

Author*The author of this computation has been verified*
R Software Modulerwasp_autocorrelation.wasp
Title produced by software(Partial) Autocorrelation Function
Date of computationMon, 13 Dec 2010 09:19:49 +0000
Cite this page as followsStatistical Computations at FreeStatistics.org, Office for Research Development and Education, URL https://freestatistics.org/blog/index.php?v=date/2010/Dec/13/t1292231904ztks9401q4e3gg8.htm/, Retrieved Tue, 07 May 2024 03:59:46 +0000
Statistical Computations at FreeStatistics.org, Office for Research Development and Education, URL https://freestatistics.org/blog/index.php?pk=108720, Retrieved Tue, 07 May 2024 03:59:46 +0000
QR Codes:

Original text written by user:
IsPrivate?No (this computation is public)
User-defined keywords
Estimated Impact176
Family? (F = Feedback message, R = changed R code, M = changed R Module, P = changed Parameters, D = changed Data)
-     [(Partial) Autocorrelation Function] [] [2010-12-13 08:35:23] [21eff0c210342db4afbdafe426a7c254]
-   PD    [(Partial) Autocorrelation Function] [] [2010-12-13 09:19:49] [81d69fb83507cea26168920232cdff1b] [Current]
Feedback Forum

Post a new message
Dataseries X:
113
95,4
86,2
111,7
97,5
99,7
111,5
91,8
86,3
88,7
95,1
105,1
104,5
89,1
82,6
102,7
91,8
94,1
103,1
93,2
91
94,3
99,4
115,7
116,8
99,8
96
115,9
109,1
117,3
109,8
112,8
110,7
100
113,3
122,4
112,5
104,2
92,5
117,2
109,3
106,1
118,8
105,3
106
102
112,9
116,5
114,8
100,5
85,4
114,6
109,9
100,7
115,5
100,7
99
102,3


Summary of computational transaction
Raw Inputview raw input (R code)
Raw Outputview raw output of R engine
Computing time13 seconds
R Server'Gwilym Jenkins' @ 72.249.127.135

\begin{tabular}{lllllllll}
\hline
Summary of computational transaction \tabularnewline
Raw Input & view raw input (R code)  \tabularnewline
Raw Output & view raw output of R engine  \tabularnewline
Computing time & 13 seconds \tabularnewline
R Server & 'Gwilym Jenkins' @ 72.249.127.135 \tabularnewline
\hline
\end{tabular}
%Source: https://freestatistics.org/blog/index.php?pk=108720&T=0

[TABLE]
[ROW][C]Summary of computational transaction[/C][/ROW]
[ROW][C]Raw Input[/C][C]view raw input (R code) [/C][/ROW]
[ROW][C]Raw Output[/C][C]view raw output of R engine [/C][/ROW]
[ROW][C]Computing time[/C][C]13 seconds[/C][/ROW]
[ROW][C]R Server[/C][C]'Gwilym Jenkins' @ 72.249.127.135[/C][/ROW]
[/TABLE]
Source: https://freestatistics.org/blog/index.php?pk=108720&T=0

Globally Unique Identifier (entire table): ba.freestatistics.org/blog/index.php?pk=108720&T=0

As an alternative you can also use a QR Code:  

The GUIDs for individual cells are displayed in the table below:

Summary of computational transaction
Raw Inputview raw input (R code)
Raw Outputview raw output of R engine
Computing time13 seconds
R Server'Gwilym Jenkins' @ 72.249.127.135


Autocorrelation Function
Time lag kACF(k)T-STATP-value
10.3115482.37270.010498
20.041910.31920.375368
30.2248191.71220.046104
40.1591331.21190.115229
50.3794382.88970.002708
60.4095463.1190.001412
70.2949222.24610.014262
80.1248510.95080.172816
9-0.001647-0.01250.495016
10-0.086591-0.65950.256106
110.1026860.7820.218688
120.4720313.59490.000335
130.0335940.25580.399488
14-0.228572-1.74080.043515
15-0.134922-1.02750.154218
16-0.111397-0.84840.199859
170.0465380.35440.362155
180.019180.14610.442185
19-0.033869-0.25790.398684
20-0.143693-1.09430.139167
21-0.25876-1.97070.026771
22-0.263023-2.00310.024922
23-0.094248-0.71780.23789
240.132971.01270.157713
25-0.123203-0.93830.175995
26-0.325034-2.47540.008126
27-0.238877-1.81920.03702
28-0.139093-1.05930.146927
29-0.049458-0.37670.353899
30-0.053184-0.4050.34347
31-0.049964-0.38050.352475
32-0.185478-1.41260.081565
33-0.170198-1.29620.100022
34-0.153414-1.16840.12372
35-0.102391-0.77980.219344
360.1464911.11560.134589
37-0.063956-0.48710.314019
38-0.209496-1.59550.058021
39-0.055694-0.42420.336511
40-0.07096-0.54040.295491
41-0.002877-0.02190.491296
420.0591830.45070.326934
430.0040040.03050.487888
44-0.087582-0.6670.253707
45-0.039995-0.30460.380883
46-0.036288-0.27640.391627
47-0.032215-0.24530.403528
480.1287860.98080.165382

\begin{tabular}{lllllllll}
\hline
Autocorrelation Function \tabularnewline
Time lag k & ACF(k) & T-STAT & P-value \tabularnewline
1 & 0.311548 & 2.3727 & 0.010498 \tabularnewline
2 & 0.04191 & 0.3192 & 0.375368 \tabularnewline
3 & 0.224819 & 1.7122 & 0.046104 \tabularnewline
4 & 0.159133 & 1.2119 & 0.115229 \tabularnewline
5 & 0.379438 & 2.8897 & 0.002708 \tabularnewline
6 & 0.409546 & 3.119 & 0.001412 \tabularnewline
7 & 0.294922 & 2.2461 & 0.014262 \tabularnewline
8 & 0.124851 & 0.9508 & 0.172816 \tabularnewline
9 & -0.001647 & -0.0125 & 0.495016 \tabularnewline
10 & -0.086591 & -0.6595 & 0.256106 \tabularnewline
11 & 0.102686 & 0.782 & 0.218688 \tabularnewline
12 & 0.472031 & 3.5949 & 0.000335 \tabularnewline
13 & 0.033594 & 0.2558 & 0.399488 \tabularnewline
14 & -0.228572 & -1.7408 & 0.043515 \tabularnewline
15 & -0.134922 & -1.0275 & 0.154218 \tabularnewline
16 & -0.111397 & -0.8484 & 0.199859 \tabularnewline
17 & 0.046538 & 0.3544 & 0.362155 \tabularnewline
18 & 0.01918 & 0.1461 & 0.442185 \tabularnewline
19 & -0.033869 & -0.2579 & 0.398684 \tabularnewline
20 & -0.143693 & -1.0943 & 0.139167 \tabularnewline
21 & -0.25876 & -1.9707 & 0.026771 \tabularnewline
22 & -0.263023 & -2.0031 & 0.024922 \tabularnewline
23 & -0.094248 & -0.7178 & 0.23789 \tabularnewline
24 & 0.13297 & 1.0127 & 0.157713 \tabularnewline
25 & -0.123203 & -0.9383 & 0.175995 \tabularnewline
26 & -0.325034 & -2.4754 & 0.008126 \tabularnewline
27 & -0.238877 & -1.8192 & 0.03702 \tabularnewline
28 & -0.139093 & -1.0593 & 0.146927 \tabularnewline
29 & -0.049458 & -0.3767 & 0.353899 \tabularnewline
30 & -0.053184 & -0.405 & 0.34347 \tabularnewline
31 & -0.049964 & -0.3805 & 0.352475 \tabularnewline
32 & -0.185478 & -1.4126 & 0.081565 \tabularnewline
33 & -0.170198 & -1.2962 & 0.100022 \tabularnewline
34 & -0.153414 & -1.1684 & 0.12372 \tabularnewline
35 & -0.102391 & -0.7798 & 0.219344 \tabularnewline
36 & 0.146491 & 1.1156 & 0.134589 \tabularnewline
37 & -0.063956 & -0.4871 & 0.314019 \tabularnewline
38 & -0.209496 & -1.5955 & 0.058021 \tabularnewline
39 & -0.055694 & -0.4242 & 0.336511 \tabularnewline
40 & -0.07096 & -0.5404 & 0.295491 \tabularnewline
41 & -0.002877 & -0.0219 & 0.491296 \tabularnewline
42 & 0.059183 & 0.4507 & 0.326934 \tabularnewline
43 & 0.004004 & 0.0305 & 0.487888 \tabularnewline
44 & -0.087582 & -0.667 & 0.253707 \tabularnewline
45 & -0.039995 & -0.3046 & 0.380883 \tabularnewline
46 & -0.036288 & -0.2764 & 0.391627 \tabularnewline
47 & -0.032215 & -0.2453 & 0.403528 \tabularnewline
48 & 0.128786 & 0.9808 & 0.165382 \tabularnewline
\hline
\end{tabular}
%Source: https://freestatistics.org/blog/index.php?pk=108720&T=1

[TABLE]
[ROW][C]Autocorrelation Function[/C][/ROW]
[ROW][C]Time lag k[/C][C]ACF(k)[/C][C]T-STAT[/C][C]P-value[/C][/ROW]
[ROW][C]1[/C][C]0.311548[/C][C]2.3727[/C][C]0.010498[/C][/ROW]
[ROW][C]2[/C][C]0.04191[/C][C]0.3192[/C][C]0.375368[/C][/ROW]
[ROW][C]3[/C][C]0.224819[/C][C]1.7122[/C][C]0.046104[/C][/ROW]
[ROW][C]4[/C][C]0.159133[/C][C]1.2119[/C][C]0.115229[/C][/ROW]
[ROW][C]5[/C][C]0.379438[/C][C]2.8897[/C][C]0.002708[/C][/ROW]
[ROW][C]6[/C][C]0.409546[/C][C]3.119[/C][C]0.001412[/C][/ROW]
[ROW][C]7[/C][C]0.294922[/C][C]2.2461[/C][C]0.014262[/C][/ROW]
[ROW][C]8[/C][C]0.124851[/C][C]0.9508[/C][C]0.172816[/C][/ROW]
[ROW][C]9[/C][C]-0.001647[/C][C]-0.0125[/C][C]0.495016[/C][/ROW]
[ROW][C]10[/C][C]-0.086591[/C][C]-0.6595[/C][C]0.256106[/C][/ROW]
[ROW][C]11[/C][C]0.102686[/C][C]0.782[/C][C]0.218688[/C][/ROW]
[ROW][C]12[/C][C]0.472031[/C][C]3.5949[/C][C]0.000335[/C][/ROW]
[ROW][C]13[/C][C]0.033594[/C][C]0.2558[/C][C]0.399488[/C][/ROW]
[ROW][C]14[/C][C]-0.228572[/C][C]-1.7408[/C][C]0.043515[/C][/ROW]
[ROW][C]15[/C][C]-0.134922[/C][C]-1.0275[/C][C]0.154218[/C][/ROW]
[ROW][C]16[/C][C]-0.111397[/C][C]-0.8484[/C][C]0.199859[/C][/ROW]
[ROW][C]17[/C][C]0.046538[/C][C]0.3544[/C][C]0.362155[/C][/ROW]
[ROW][C]18[/C][C]0.01918[/C][C]0.1461[/C][C]0.442185[/C][/ROW]
[ROW][C]19[/C][C]-0.033869[/C][C]-0.2579[/C][C]0.398684[/C][/ROW]
[ROW][C]20[/C][C]-0.143693[/C][C]-1.0943[/C][C]0.139167[/C][/ROW]
[ROW][C]21[/C][C]-0.25876[/C][C]-1.9707[/C][C]0.026771[/C][/ROW]
[ROW][C]22[/C][C]-0.263023[/C][C]-2.0031[/C][C]0.024922[/C][/ROW]
[ROW][C]23[/C][C]-0.094248[/C][C]-0.7178[/C][C]0.23789[/C][/ROW]
[ROW][C]24[/C][C]0.13297[/C][C]1.0127[/C][C]0.157713[/C][/ROW]
[ROW][C]25[/C][C]-0.123203[/C][C]-0.9383[/C][C]0.175995[/C][/ROW]
[ROW][C]26[/C][C]-0.325034[/C][C]-2.4754[/C][C]0.008126[/C][/ROW]
[ROW][C]27[/C][C]-0.238877[/C][C]-1.8192[/C][C]0.03702[/C][/ROW]
[ROW][C]28[/C][C]-0.139093[/C][C]-1.0593[/C][C]0.146927[/C][/ROW]
[ROW][C]29[/C][C]-0.049458[/C][C]-0.3767[/C][C]0.353899[/C][/ROW]
[ROW][C]30[/C][C]-0.053184[/C][C]-0.405[/C][C]0.34347[/C][/ROW]
[ROW][C]31[/C][C]-0.049964[/C][C]-0.3805[/C][C]0.352475[/C][/ROW]
[ROW][C]32[/C][C]-0.185478[/C][C]-1.4126[/C][C]0.081565[/C][/ROW]
[ROW][C]33[/C][C]-0.170198[/C][C]-1.2962[/C][C]0.100022[/C][/ROW]
[ROW][C]34[/C][C]-0.153414[/C][C]-1.1684[/C][C]0.12372[/C][/ROW]
[ROW][C]35[/C][C]-0.102391[/C][C]-0.7798[/C][C]0.219344[/C][/ROW]
[ROW][C]36[/C][C]0.146491[/C][C]1.1156[/C][C]0.134589[/C][/ROW]
[ROW][C]37[/C][C]-0.063956[/C][C]-0.4871[/C][C]0.314019[/C][/ROW]
[ROW][C]38[/C][C]-0.209496[/C][C]-1.5955[/C][C]0.058021[/C][/ROW]
[ROW][C]39[/C][C]-0.055694[/C][C]-0.4242[/C][C]0.336511[/C][/ROW]
[ROW][C]40[/C][C]-0.07096[/C][C]-0.5404[/C][C]0.295491[/C][/ROW]
[ROW][C]41[/C][C]-0.002877[/C][C]-0.0219[/C][C]0.491296[/C][/ROW]
[ROW][C]42[/C][C]0.059183[/C][C]0.4507[/C][C]0.326934[/C][/ROW]
[ROW][C]43[/C][C]0.004004[/C][C]0.0305[/C][C]0.487888[/C][/ROW]
[ROW][C]44[/C][C]-0.087582[/C][C]-0.667[/C][C]0.253707[/C][/ROW]
[ROW][C]45[/C][C]-0.039995[/C][C]-0.3046[/C][C]0.380883[/C][/ROW]
[ROW][C]46[/C][C]-0.036288[/C][C]-0.2764[/C][C]0.391627[/C][/ROW]
[ROW][C]47[/C][C]-0.032215[/C][C]-0.2453[/C][C]0.403528[/C][/ROW]
[ROW][C]48[/C][C]0.128786[/C][C]0.9808[/C][C]0.165382[/C][/ROW]
[/TABLE]
Source: https://freestatistics.org/blog/index.php?pk=108720&T=1

Globally Unique Identifier (entire table): ba.freestatistics.org/blog/index.php?pk=108720&T=1

As an alternative you can also use a QR Code:  

The GUIDs for individual cells are displayed in the table below:

Autocorrelation Function
Time lag kACF(k)T-STATP-value
10.3115482.37270.010498
20.041910.31920.375368
30.2248191.71220.046104
40.1591331.21190.115229
50.3794382.88970.002708
60.4095463.1190.001412
70.2949222.24610.014262
80.1248510.95080.172816
9-0.001647-0.01250.495016
10-0.086591-0.65950.256106
110.1026860.7820.218688
120.4720313.59490.000335
130.0335940.25580.399488
14-0.228572-1.74080.043515
15-0.134922-1.02750.154218
16-0.111397-0.84840.199859
170.0465380.35440.362155
180.019180.14610.442185
19-0.033869-0.25790.398684
20-0.143693-1.09430.139167
21-0.25876-1.97070.026771
22-0.263023-2.00310.024922
23-0.094248-0.71780.23789
240.132971.01270.157713
25-0.123203-0.93830.175995
26-0.325034-2.47540.008126
27-0.238877-1.81920.03702
28-0.139093-1.05930.146927
29-0.049458-0.37670.353899
30-0.053184-0.4050.34347
31-0.049964-0.38050.352475
32-0.185478-1.41260.081565
33-0.170198-1.29620.100022
34-0.153414-1.16840.12372
35-0.102391-0.77980.219344
360.1464911.11560.134589
37-0.063956-0.48710.314019
38-0.209496-1.59550.058021
39-0.055694-0.42420.336511
40-0.07096-0.54040.295491
41-0.002877-0.02190.491296
420.0591830.45070.326934
430.0040040.03050.487888
44-0.087582-0.6670.253707
45-0.039995-0.30460.380883
46-0.036288-0.27640.391627
47-0.032215-0.24530.403528
480.1287860.98080.165382


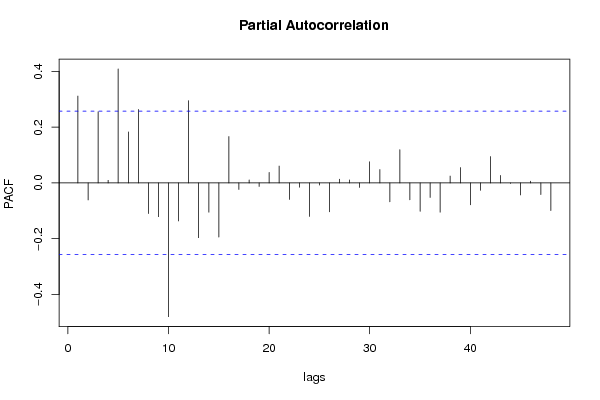
Partial Autocorrelation Function
Time lag kPACF(k)T-STATP-value
10.3115482.37270.010498
2-0.061081-0.46520.321774
30.2556711.94710.028183
40.0092180.07020.472138
50.408833.11360.001435
60.1828191.39230.084572
70.2636322.00780.024667
8-0.10971-0.83550.203425
9-0.120972-0.92130.180357
10-0.479683-3.65320.000279
11-0.136586-1.04020.151279
120.2949452.24620.014256
13-0.196605-1.49730.069869
14-0.104869-0.79870.213873
15-0.194308-1.47980.072168
160.1662221.26590.105304
17-0.023375-0.1780.429664
180.0106830.08140.467717
19-0.012731-0.0970.461548
200.0375860.28620.387854
210.0605150.46090.323309
22-0.059396-0.45230.326353
23-0.015369-0.1170.453613
24-0.120293-0.91610.181697
25-0.00759-0.05780.477051
26-0.103515-0.78830.216853
270.013210.10060.460105
280.0109090.08310.467037
29-0.016028-0.12210.451636
300.0756560.57620.283361
310.0477730.36380.358654
32-0.067814-0.51650.303751
330.1191420.90740.183986
34-0.060601-0.46150.323076
35-0.101768-0.7750.220732
36-0.052226-0.39770.34614
37-0.105087-0.80030.213396
380.0246640.18780.425832
390.0549550.41850.338554
40-0.078641-0.59890.275783
41-0.026416-0.20120.42063
420.094710.72130.236815
430.0268480.20450.419351
44-0.00199-0.01520.493981
45-0.043047-0.32780.372108
460.0064110.04880.480614
47-0.041914-0.31920.375357
48-0.099252-0.75590.22639

\begin{tabular}{lllllllll}
\hline
Partial Autocorrelation Function \tabularnewline
Time lag k & PACF(k) & T-STAT & P-value \tabularnewline
1 & 0.311548 & 2.3727 & 0.010498 \tabularnewline
2 & -0.061081 & -0.4652 & 0.321774 \tabularnewline
3 & 0.255671 & 1.9471 & 0.028183 \tabularnewline
4 & 0.009218 & 0.0702 & 0.472138 \tabularnewline
5 & 0.40883 & 3.1136 & 0.001435 \tabularnewline
6 & 0.182819 & 1.3923 & 0.084572 \tabularnewline
7 & 0.263632 & 2.0078 & 0.024667 \tabularnewline
8 & -0.10971 & -0.8355 & 0.203425 \tabularnewline
9 & -0.120972 & -0.9213 & 0.180357 \tabularnewline
10 & -0.479683 & -3.6532 & 0.000279 \tabularnewline
11 & -0.136586 & -1.0402 & 0.151279 \tabularnewline
12 & 0.294945 & 2.2462 & 0.014256 \tabularnewline
13 & -0.196605 & -1.4973 & 0.069869 \tabularnewline
14 & -0.104869 & -0.7987 & 0.213873 \tabularnewline
15 & -0.194308 & -1.4798 & 0.072168 \tabularnewline
16 & 0.166222 & 1.2659 & 0.105304 \tabularnewline
17 & -0.023375 & -0.178 & 0.429664 \tabularnewline
18 & 0.010683 & 0.0814 & 0.467717 \tabularnewline
19 & -0.012731 & -0.097 & 0.461548 \tabularnewline
20 & 0.037586 & 0.2862 & 0.387854 \tabularnewline
21 & 0.060515 & 0.4609 & 0.323309 \tabularnewline
22 & -0.059396 & -0.4523 & 0.326353 \tabularnewline
23 & -0.015369 & -0.117 & 0.453613 \tabularnewline
24 & -0.120293 & -0.9161 & 0.181697 \tabularnewline
25 & -0.00759 & -0.0578 & 0.477051 \tabularnewline
26 & -0.103515 & -0.7883 & 0.216853 \tabularnewline
27 & 0.01321 & 0.1006 & 0.460105 \tabularnewline
28 & 0.010909 & 0.0831 & 0.467037 \tabularnewline
29 & -0.016028 & -0.1221 & 0.451636 \tabularnewline
30 & 0.075656 & 0.5762 & 0.283361 \tabularnewline
31 & 0.047773 & 0.3638 & 0.358654 \tabularnewline
32 & -0.067814 & -0.5165 & 0.303751 \tabularnewline
33 & 0.119142 & 0.9074 & 0.183986 \tabularnewline
34 & -0.060601 & -0.4615 & 0.323076 \tabularnewline
35 & -0.101768 & -0.775 & 0.220732 \tabularnewline
36 & -0.052226 & -0.3977 & 0.34614 \tabularnewline
37 & -0.105087 & -0.8003 & 0.213396 \tabularnewline
38 & 0.024664 & 0.1878 & 0.425832 \tabularnewline
39 & 0.054955 & 0.4185 & 0.338554 \tabularnewline
40 & -0.078641 & -0.5989 & 0.275783 \tabularnewline
41 & -0.026416 & -0.2012 & 0.42063 \tabularnewline
42 & 0.09471 & 0.7213 & 0.236815 \tabularnewline
43 & 0.026848 & 0.2045 & 0.419351 \tabularnewline
44 & -0.00199 & -0.0152 & 0.493981 \tabularnewline
45 & -0.043047 & -0.3278 & 0.372108 \tabularnewline
46 & 0.006411 & 0.0488 & 0.480614 \tabularnewline
47 & -0.041914 & -0.3192 & 0.375357 \tabularnewline
48 & -0.099252 & -0.7559 & 0.22639 \tabularnewline
\hline
\end{tabular}
%Source: https://freestatistics.org/blog/index.php?pk=108720&T=2

[TABLE]
[ROW][C]Partial Autocorrelation Function[/C][/ROW]
[ROW][C]Time lag k[/C][C]PACF(k)[/C][C]T-STAT[/C][C]P-value[/C][/ROW]
[ROW][C]1[/C][C]0.311548[/C][C]2.3727[/C][C]0.010498[/C][/ROW]
[ROW][C]2[/C][C]-0.061081[/C][C]-0.4652[/C][C]0.321774[/C][/ROW]
[ROW][C]3[/C][C]0.255671[/C][C]1.9471[/C][C]0.028183[/C][/ROW]
[ROW][C]4[/C][C]0.009218[/C][C]0.0702[/C][C]0.472138[/C][/ROW]
[ROW][C]5[/C][C]0.40883[/C][C]3.1136[/C][C]0.001435[/C][/ROW]
[ROW][C]6[/C][C]0.182819[/C][C]1.3923[/C][C]0.084572[/C][/ROW]
[ROW][C]7[/C][C]0.263632[/C][C]2.0078[/C][C]0.024667[/C][/ROW]
[ROW][C]8[/C][C]-0.10971[/C][C]-0.8355[/C][C]0.203425[/C][/ROW]
[ROW][C]9[/C][C]-0.120972[/C][C]-0.9213[/C][C]0.180357[/C][/ROW]
[ROW][C]10[/C][C]-0.479683[/C][C]-3.6532[/C][C]0.000279[/C][/ROW]
[ROW][C]11[/C][C]-0.136586[/C][C]-1.0402[/C][C]0.151279[/C][/ROW]
[ROW][C]12[/C][C]0.294945[/C][C]2.2462[/C][C]0.014256[/C][/ROW]
[ROW][C]13[/C][C]-0.196605[/C][C]-1.4973[/C][C]0.069869[/C][/ROW]
[ROW][C]14[/C][C]-0.104869[/C][C]-0.7987[/C][C]0.213873[/C][/ROW]
[ROW][C]15[/C][C]-0.194308[/C][C]-1.4798[/C][C]0.072168[/C][/ROW]
[ROW][C]16[/C][C]0.166222[/C][C]1.2659[/C][C]0.105304[/C][/ROW]
[ROW][C]17[/C][C]-0.023375[/C][C]-0.178[/C][C]0.429664[/C][/ROW]
[ROW][C]18[/C][C]0.010683[/C][C]0.0814[/C][C]0.467717[/C][/ROW]
[ROW][C]19[/C][C]-0.012731[/C][C]-0.097[/C][C]0.461548[/C][/ROW]
[ROW][C]20[/C][C]0.037586[/C][C]0.2862[/C][C]0.387854[/C][/ROW]
[ROW][C]21[/C][C]0.060515[/C][C]0.4609[/C][C]0.323309[/C][/ROW]
[ROW][C]22[/C][C]-0.059396[/C][C]-0.4523[/C][C]0.326353[/C][/ROW]
[ROW][C]23[/C][C]-0.015369[/C][C]-0.117[/C][C]0.453613[/C][/ROW]
[ROW][C]24[/C][C]-0.120293[/C][C]-0.9161[/C][C]0.181697[/C][/ROW]
[ROW][C]25[/C][C]-0.00759[/C][C]-0.0578[/C][C]0.477051[/C][/ROW]
[ROW][C]26[/C][C]-0.103515[/C][C]-0.7883[/C][C]0.216853[/C][/ROW]
[ROW][C]27[/C][C]0.01321[/C][C]0.1006[/C][C]0.460105[/C][/ROW]
[ROW][C]28[/C][C]0.010909[/C][C]0.0831[/C][C]0.467037[/C][/ROW]
[ROW][C]29[/C][C]-0.016028[/C][C]-0.1221[/C][C]0.451636[/C][/ROW]
[ROW][C]30[/C][C]0.075656[/C][C]0.5762[/C][C]0.283361[/C][/ROW]
[ROW][C]31[/C][C]0.047773[/C][C]0.3638[/C][C]0.358654[/C][/ROW]
[ROW][C]32[/C][C]-0.067814[/C][C]-0.5165[/C][C]0.303751[/C][/ROW]
[ROW][C]33[/C][C]0.119142[/C][C]0.9074[/C][C]0.183986[/C][/ROW]
[ROW][C]34[/C][C]-0.060601[/C][C]-0.4615[/C][C]0.323076[/C][/ROW]
[ROW][C]35[/C][C]-0.101768[/C][C]-0.775[/C][C]0.220732[/C][/ROW]
[ROW][C]36[/C][C]-0.052226[/C][C]-0.3977[/C][C]0.34614[/C][/ROW]
[ROW][C]37[/C][C]-0.105087[/C][C]-0.8003[/C][C]0.213396[/C][/ROW]
[ROW][C]38[/C][C]0.024664[/C][C]0.1878[/C][C]0.425832[/C][/ROW]
[ROW][C]39[/C][C]0.054955[/C][C]0.4185[/C][C]0.338554[/C][/ROW]
[ROW][C]40[/C][C]-0.078641[/C][C]-0.5989[/C][C]0.275783[/C][/ROW]
[ROW][C]41[/C][C]-0.026416[/C][C]-0.2012[/C][C]0.42063[/C][/ROW]
[ROW][C]42[/C][C]0.09471[/C][C]0.7213[/C][C]0.236815[/C][/ROW]
[ROW][C]43[/C][C]0.026848[/C][C]0.2045[/C][C]0.419351[/C][/ROW]
[ROW][C]44[/C][C]-0.00199[/C][C]-0.0152[/C][C]0.493981[/C][/ROW]
[ROW][C]45[/C][C]-0.043047[/C][C]-0.3278[/C][C]0.372108[/C][/ROW]
[ROW][C]46[/C][C]0.006411[/C][C]0.0488[/C][C]0.480614[/C][/ROW]
[ROW][C]47[/C][C]-0.041914[/C][C]-0.3192[/C][C]0.375357[/C][/ROW]
[ROW][C]48[/C][C]-0.099252[/C][C]-0.7559[/C][C]0.22639[/C][/ROW]
[/TABLE]
Source: https://freestatistics.org/blog/index.php?pk=108720&T=2

Globally Unique Identifier (entire table): ba.freestatistics.org/blog/index.php?pk=108720&T=2

As an alternative you can also use a QR Code:  

The GUIDs for individual cells are displayed in the table below:

Partial Autocorrelation Function
Time lag kPACF(k)T-STATP-value
10.3115482.37270.010498
2-0.061081-0.46520.321774
30.2556711.94710.028183
40.0092180.07020.472138
50.408833.11360.001435
60.1828191.39230.084572
70.2636322.00780.024667
8-0.10971-0.83550.203425
9-0.120972-0.92130.180357
10-0.479683-3.65320.000279
11-0.136586-1.04020.151279
120.2949452.24620.014256
13-0.196605-1.49730.069869
14-0.104869-0.79870.213873
15-0.194308-1.47980.072168
160.1662221.26590.105304
17-0.023375-0.1780.429664
180.0106830.08140.467717
19-0.012731-0.0970.461548
200.0375860.28620.387854
210.0605150.46090.323309
22-0.059396-0.45230.326353
23-0.015369-0.1170.453613
24-0.120293-0.91610.181697
25-0.00759-0.05780.477051
26-0.103515-0.78830.216853
270.013210.10060.460105
280.0109090.08310.467037
29-0.016028-0.12210.451636
300.0756560.57620.283361
310.0477730.36380.358654
32-0.067814-0.51650.303751
330.1191420.90740.183986
34-0.060601-0.46150.323076
35-0.101768-0.7750.220732
36-0.052226-0.39770.34614
37-0.105087-0.80030.213396
380.0246640.18780.425832
390.0549550.41850.338554
40-0.078641-0.59890.275783
41-0.026416-0.20120.42063
420.094710.72130.236815
430.0268480.20450.419351
44-0.00199-0.01520.493981
45-0.043047-0.32780.372108
460.0064110.04880.480614
47-0.041914-0.31920.375357
48-0.099252-0.75590.22639


Parameters (Session):
par1 = 48 ; par2 = 1 ; par3 = 0 ; par4 = 0 ; par5 = 12 ; par6 = White Noise ; par7 = 0.95 ;
Parameters (R input):
par1 = 48 ; par2 = 1 ; par3 = 0 ; par4 = 0 ; par5 = 12 ; par6 = White Noise ; par7 = 0.95 ;
R code (references can be found in the software module):
if (par1 == 'Default') {
par1 = 10*log10(length(x))
} else {
par1 <- as.numeric(par1)
}
par2 <- as.numeric(par2)
par3 <- as.numeric(par3)
par4 <- as.numeric(par4)
par5 <- as.numeric(par5)
if (par6 == 'White Noise') par6 <- 'white' else par6 <- 'ma'
par7 <- as.numeric(par7)
if (par2 == 0) {
x <- log(x)
} else {
x <- (x ^ par2 - 1) / par2
}
if (par3 > 0) x <- diff(x,lag=1,difference=par3)
if (par4 > 0) x <- diff(x,lag=par5,difference=par4)
bitmap(file='pic1.png')
racf <- acf(x, par1, main='Autocorrelation', xlab='time lag', ylab='ACF', ci.type=par6, ci=par7, sub=paste('(lambda=',par2,', d=',par3,', D=',par4,', CI=', par7, ', CI type=',par6,')',sep=''))
dev.off()
bitmap(file='pic2.png')
rpacf <- pacf(x,par1,main='Partial Autocorrelation',xlab='lags',ylab='PACF')
dev.off()
(myacf <- c(racf$acf))
(mypacf <- c(rpacf$acf))
lengthx <- length(x)
sqrtn <- sqrt(lengthx)
load(file='createtable')
a<-table.start()
a<-table.row.start(a)
a<-table.element(a,'Autocorrelation Function',4,TRUE)
a<-table.row.end(a)
a<-table.row.start(a)
a<-table.element(a,'Time lag k',header=TRUE)
a<-table.element(a,hyperlink('basics.htm','ACF(k)','click here for more information about the Autocorrelation Function'),header=TRUE)
a<-table.element(a,'T-STAT',header=TRUE)
a<-table.element(a,'P-value',header=TRUE)
a<-table.row.end(a)
for (i in 2:(par1+1)) {
a<-table.row.start(a)
a<-table.element(a,i-1,header=TRUE)
a<-table.element(a,round(myacf[i],6))
mytstat <- myacf[i]*sqrtn
a<-table.element(a,round(mytstat,4))
a<-table.element(a,round(1-pt(abs(mytstat),lengthx),6))
a<-table.row.end(a)
}
a<-table.end(a)
table.save(a,file='mytable.tab')
a<-table.start()
a<-table.row.start(a)
a<-table.element(a,'Partial Autocorrelation Function',4,TRUE)
a<-table.row.end(a)
a<-table.row.start(a)
a<-table.element(a,'Time lag k',header=TRUE)
a<-table.element(a,hyperlink('basics.htm','PACF(k)','click here for more information about the Partial Autocorrelation Function'),header=TRUE)
a<-table.element(a,'T-STAT',header=TRUE)
a<-table.element(a,'P-value',header=TRUE)
a<-table.row.end(a)
for (i in 1:par1) {
a<-table.row.start(a)
a<-table.element(a,i,header=TRUE)
a<-table.element(a,round(mypacf[i],6))
mytstat <- mypacf[i]*sqrtn
a<-table.element(a,round(mytstat,4))
a<-table.element(a,round(1-pt(abs(mytstat),lengthx),6))
a<-table.row.end(a)
}
a<-table.end(a)
table.save(a,file='mytable1.tab')