Free Statistics

of Irreproducible Research!

Author's title

Author*The author of this computation has been verified*
R Software Modulerwasp_exponentialsmoothing.wasp
Title produced by softwareExponential Smoothing
Date of computationSun, 12 Dec 2010 19:21:34 +0000
Cite this page as followsStatistical Computations at FreeStatistics.org, Office for Research Development and Education, URL https://freestatistics.org/blog/index.php?v=date/2010/Dec/12/t1292181576dllkoxmp7m39hu3.htm/, Retrieved Tue, 07 May 2024 12:32:53 +0000
Statistical Computations at FreeStatistics.org, Office for Research Development and Education, URL https://freestatistics.org/blog/index.php?pk=108628, Retrieved Tue, 07 May 2024 12:32:53 +0000
QR Codes:

Original text written by user:
IsPrivate?No (this computation is public)
User-defined keywords
Estimated Impact175
Family? (F = Feedback message, R = changed R code, M = changed R Module, P = changed Parameters, D = changed Data)
-     [Univariate Data Series] [data set] [2008-12-01 19:54:57] [b98453cac15ba1066b407e146608df68]
- RMP   [Exponential Smoothing] [Unemployment] [2010-11-30 13:37:23] [b98453cac15ba1066b407e146608df68]
-   PD      [Exponential Smoothing] [ws8] [2010-12-12 19:21:34] [c1f1b5e209adb4577289f490325e36f2] [Current]
Feedback Forum

Post a new message
Dataseries X:
 1.3031
 1.3241
 1.2961
 1.2865
 1.2305
 1.2101
 1.2125
 1.2350
 1.2014
 1.1992
 1.1791
 1.1832
 1.2159
 1.1922
 1.2114
 1.2614
 1.2812
 1.2786
 1.2772
 1.2815
 1.2679
 1.2765
 1.3247
 1.3191
 1.3029
 1.3234
 1.3354
 1.3651
 1.3453
 1.3534
 1.3706
 1.3638
 1.4268
 1.4485
 1.4635
 1.4587
 1.4876
 1.5189
 1.5783
 1.5633
 1.5554
 1.5757
 1.5593
 1.4660
 1.4065
 1.2759
 1.2705
 1.3954
 1.2793
 1.2694
 1.3282
 1.3230
 1.4135
 1.4042
 1.4253
 1.4322
 1.4632
 1.4713
 1.5016
 1.4318


Summary of computational transaction
Raw Inputview raw input (R code)
Raw Outputview raw output of R engine
Computing time2 seconds
R Server'Gwilym Jenkins' @ 72.249.127.135

\begin{tabular}{lllllllll}
\hline
Summary of computational transaction \tabularnewline
Raw Input & view raw input (R code)  \tabularnewline
Raw Output & view raw output of R engine  \tabularnewline
Computing time & 2 seconds \tabularnewline
R Server & 'Gwilym Jenkins' @ 72.249.127.135 \tabularnewline
\hline
\end{tabular}
%Source: https://freestatistics.org/blog/index.php?pk=108628&T=0

[TABLE]
[ROW][C]Summary of computational transaction[/C][/ROW]
[ROW][C]Raw Input[/C][C]view raw input (R code) [/C][/ROW]
[ROW][C]Raw Output[/C][C]view raw output of R engine [/C][/ROW]
[ROW][C]Computing time[/C][C]2 seconds[/C][/ROW]
[ROW][C]R Server[/C][C]'Gwilym Jenkins' @ 72.249.127.135[/C][/ROW]
[/TABLE]
Source: https://freestatistics.org/blog/index.php?pk=108628&T=0

Globally Unique Identifier (entire table): ba.freestatistics.org/blog/index.php?pk=108628&T=0

As an alternative you can also use a QR Code:  

The GUIDs for individual cells are displayed in the table below:

Summary of computational transaction
Raw Inputview raw input (R code)
Raw Outputview raw output of R engine
Computing time2 seconds
R Server'Gwilym Jenkins' @ 72.249.127.135


Estimated Parameters of Exponential Smoothing
ParameterValue
alpha0.824124154937339
beta0
gamma1

\begin{tabular}{lllllllll}
\hline
Estimated Parameters of Exponential Smoothing \tabularnewline
Parameter & Value \tabularnewline
alpha & 0.824124154937339 \tabularnewline
beta & 0 \tabularnewline
gamma & 1 \tabularnewline
\hline
\end{tabular}
%Source: https://freestatistics.org/blog/index.php?pk=108628&T=1

[TABLE]
[ROW][C]Estimated Parameters of Exponential Smoothing[/C][/ROW]
[ROW][C]Parameter[/C][C]Value[/C][/ROW]
[ROW][C]alpha[/C][C]0.824124154937339[/C][/ROW]
[ROW][C]beta[/C][C]0[/C][/ROW]
[ROW][C]gamma[/C][C]1[/C][/ROW]
[/TABLE]
Source: https://freestatistics.org/blog/index.php?pk=108628&T=1

Globally Unique Identifier (entire table): ba.freestatistics.org/blog/index.php?pk=108628&T=1

As an alternative you can also use a QR Code:  

The GUIDs for individual cells are displayed in the table below:

Estimated Parameters of Exponential Smoothing
ParameterValue
alpha0.824124154937339
beta0
gamma1


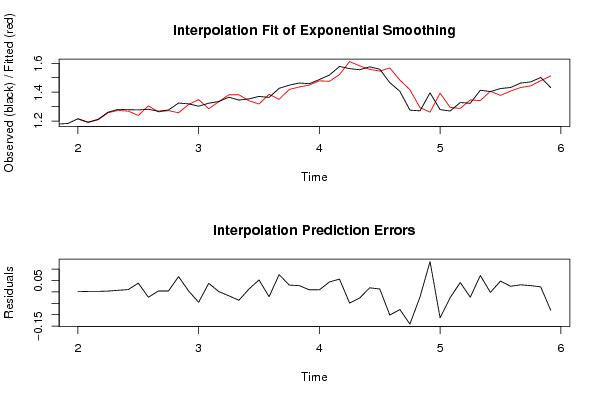
Interpolation Forecasts of Exponential Smoothing
tObservedFittedResiduals
131.21591.214815491452990.00108450854700815
141.19221.190147606131160.00205239386883771
151.21141.209102378482260.0022976215177386
161.26141.257775915528950.00362408447105467
171.28121.274046789402750.00715321059724694
181.27861.268384434696310.0102155653036904
191.27721.238679173807770.0385208261922347
201.28151.30482596212927-0.0233259621292741
211.26791.263799151623060.00410084837693625
221.27651.272325438147910.0041745618520892
231.32471.257370807061510.0673291929384907
241.31911.314763432949570.00433656705043250
251.30291.34844971978419-0.045549719784195
261.32341.285519668096660.0378803319033416
271.33541.334044239223570.00135576077642630
281.36511.38217485887561-0.0170748588756138
291.34531.38200792159553-0.0367079215955290
301.35341.340737142608000.0126628573920033
311.37061.318026965922110.0525730340778903
321.36381.38487716203193-0.0210771620319317
331.42681.350527355480720.0762726445192803
341.44851.418545126931420.029954873068579
351.46351.435944047152270.0275559528477276
361.45871.449479703850630.0092202961493677
371.48761.478416996947780.00918300305221598
381.51891.475266835059390.0436331649406088
391.57831.522108665039140.0561913349608576
401.56331.6121891051201-0.0488891051200999
411.55541.58235029754178-0.0269502975417761
421.57571.557804139707570.0178958602924271
431.55931.546425843166010.0128741568339867
441.4661.56760594513540-0.101605945135396
451.40651.48401190275479-0.0775119027547904
461.27591.41714593694552-0.141245936945515
471.27051.29303222216783-0.0225322221678332
481.39541.262064204842540.133335795157462
491.27931.39328151971938-0.113981519719385
501.26941.29468745091825-0.0252874509182524
511.32821.286938815360310.0412611846396893
521.3231.34623384672595-0.0232338467259532
531.41351.341396663613910.0721033363860906
541.40421.40637035404089-0.00217035404088617
551.42531.377571809229690.0477281907703144
561.43221.407341677786280.0248583222137231
571.46321.43220745292920.0309925470708017
581.47131.443553348016830.0277466519831659
591.50161.479589382687730.0220106173122729
601.43181.51274361457281-0.0809436145728115

\begin{tabular}{lllllllll}
\hline
Interpolation Forecasts of Exponential Smoothing \tabularnewline
t & Observed & Fitted & Residuals \tabularnewline
13 & 1.2159 & 1.21481549145299 & 0.00108450854700815 \tabularnewline
14 & 1.1922 & 1.19014760613116 & 0.00205239386883771 \tabularnewline
15 & 1.2114 & 1.20910237848226 & 0.0022976215177386 \tabularnewline
16 & 1.2614 & 1.25777591552895 & 0.00362408447105467 \tabularnewline
17 & 1.2812 & 1.27404678940275 & 0.00715321059724694 \tabularnewline
18 & 1.2786 & 1.26838443469631 & 0.0102155653036904 \tabularnewline
19 & 1.2772 & 1.23867917380777 & 0.0385208261922347 \tabularnewline
20 & 1.2815 & 1.30482596212927 & -0.0233259621292741 \tabularnewline
21 & 1.2679 & 1.26379915162306 & 0.00410084837693625 \tabularnewline
22 & 1.2765 & 1.27232543814791 & 0.0041745618520892 \tabularnewline
23 & 1.3247 & 1.25737080706151 & 0.0673291929384907 \tabularnewline
24 & 1.3191 & 1.31476343294957 & 0.00433656705043250 \tabularnewline
25 & 1.3029 & 1.34844971978419 & -0.045549719784195 \tabularnewline
26 & 1.3234 & 1.28551966809666 & 0.0378803319033416 \tabularnewline
27 & 1.3354 & 1.33404423922357 & 0.00135576077642630 \tabularnewline
28 & 1.3651 & 1.38217485887561 & -0.0170748588756138 \tabularnewline
29 & 1.3453 & 1.38200792159553 & -0.0367079215955290 \tabularnewline
30 & 1.3534 & 1.34073714260800 & 0.0126628573920033 \tabularnewline
31 & 1.3706 & 1.31802696592211 & 0.0525730340778903 \tabularnewline
32 & 1.3638 & 1.38487716203193 & -0.0210771620319317 \tabularnewline
33 & 1.4268 & 1.35052735548072 & 0.0762726445192803 \tabularnewline
34 & 1.4485 & 1.41854512693142 & 0.029954873068579 \tabularnewline
35 & 1.4635 & 1.43594404715227 & 0.0275559528477276 \tabularnewline
36 & 1.4587 & 1.44947970385063 & 0.0092202961493677 \tabularnewline
37 & 1.4876 & 1.47841699694778 & 0.00918300305221598 \tabularnewline
38 & 1.5189 & 1.47526683505939 & 0.0436331649406088 \tabularnewline
39 & 1.5783 & 1.52210866503914 & 0.0561913349608576 \tabularnewline
40 & 1.5633 & 1.6121891051201 & -0.0488891051200999 \tabularnewline
41 & 1.5554 & 1.58235029754178 & -0.0269502975417761 \tabularnewline
42 & 1.5757 & 1.55780413970757 & 0.0178958602924271 \tabularnewline
43 & 1.5593 & 1.54642584316601 & 0.0128741568339867 \tabularnewline
44 & 1.466 & 1.56760594513540 & -0.101605945135396 \tabularnewline
45 & 1.4065 & 1.48401190275479 & -0.0775119027547904 \tabularnewline
46 & 1.2759 & 1.41714593694552 & -0.141245936945515 \tabularnewline
47 & 1.2705 & 1.29303222216783 & -0.0225322221678332 \tabularnewline
48 & 1.3954 & 1.26206420484254 & 0.133335795157462 \tabularnewline
49 & 1.2793 & 1.39328151971938 & -0.113981519719385 \tabularnewline
50 & 1.2694 & 1.29468745091825 & -0.0252874509182524 \tabularnewline
51 & 1.3282 & 1.28693881536031 & 0.0412611846396893 \tabularnewline
52 & 1.323 & 1.34623384672595 & -0.0232338467259532 \tabularnewline
53 & 1.4135 & 1.34139666361391 & 0.0721033363860906 \tabularnewline
54 & 1.4042 & 1.40637035404089 & -0.00217035404088617 \tabularnewline
55 & 1.4253 & 1.37757180922969 & 0.0477281907703144 \tabularnewline
56 & 1.4322 & 1.40734167778628 & 0.0248583222137231 \tabularnewline
57 & 1.4632 & 1.4322074529292 & 0.0309925470708017 \tabularnewline
58 & 1.4713 & 1.44355334801683 & 0.0277466519831659 \tabularnewline
59 & 1.5016 & 1.47958938268773 & 0.0220106173122729 \tabularnewline
60 & 1.4318 & 1.51274361457281 & -0.0809436145728115 \tabularnewline
\hline
\end{tabular}
%Source: https://freestatistics.org/blog/index.php?pk=108628&T=2

[TABLE]
[ROW][C]Interpolation Forecasts of Exponential Smoothing[/C][/ROW]
[ROW][C]t[/C][C]Observed[/C][C]Fitted[/C][C]Residuals[/C][/ROW]
[ROW][C]13[/C][C]1.2159[/C][C]1.21481549145299[/C][C]0.00108450854700815[/C][/ROW]
[ROW][C]14[/C][C]1.1922[/C][C]1.19014760613116[/C][C]0.00205239386883771[/C][/ROW]
[ROW][C]15[/C][C]1.2114[/C][C]1.20910237848226[/C][C]0.0022976215177386[/C][/ROW]
[ROW][C]16[/C][C]1.2614[/C][C]1.25777591552895[/C][C]0.00362408447105467[/C][/ROW]
[ROW][C]17[/C][C]1.2812[/C][C]1.27404678940275[/C][C]0.00715321059724694[/C][/ROW]
[ROW][C]18[/C][C]1.2786[/C][C]1.26838443469631[/C][C]0.0102155653036904[/C][/ROW]
[ROW][C]19[/C][C]1.2772[/C][C]1.23867917380777[/C][C]0.0385208261922347[/C][/ROW]
[ROW][C]20[/C][C]1.2815[/C][C]1.30482596212927[/C][C]-0.0233259621292741[/C][/ROW]
[ROW][C]21[/C][C]1.2679[/C][C]1.26379915162306[/C][C]0.00410084837693625[/C][/ROW]
[ROW][C]22[/C][C]1.2765[/C][C]1.27232543814791[/C][C]0.0041745618520892[/C][/ROW]
[ROW][C]23[/C][C]1.3247[/C][C]1.25737080706151[/C][C]0.0673291929384907[/C][/ROW]
[ROW][C]24[/C][C]1.3191[/C][C]1.31476343294957[/C][C]0.00433656705043250[/C][/ROW]
[ROW][C]25[/C][C]1.3029[/C][C]1.34844971978419[/C][C]-0.045549719784195[/C][/ROW]
[ROW][C]26[/C][C]1.3234[/C][C]1.28551966809666[/C][C]0.0378803319033416[/C][/ROW]
[ROW][C]27[/C][C]1.3354[/C][C]1.33404423922357[/C][C]0.00135576077642630[/C][/ROW]
[ROW][C]28[/C][C]1.3651[/C][C]1.38217485887561[/C][C]-0.0170748588756138[/C][/ROW]
[ROW][C]29[/C][C]1.3453[/C][C]1.38200792159553[/C][C]-0.0367079215955290[/C][/ROW]
[ROW][C]30[/C][C]1.3534[/C][C]1.34073714260800[/C][C]0.0126628573920033[/C][/ROW]
[ROW][C]31[/C][C]1.3706[/C][C]1.31802696592211[/C][C]0.0525730340778903[/C][/ROW]
[ROW][C]32[/C][C]1.3638[/C][C]1.38487716203193[/C][C]-0.0210771620319317[/C][/ROW]
[ROW][C]33[/C][C]1.4268[/C][C]1.35052735548072[/C][C]0.0762726445192803[/C][/ROW]
[ROW][C]34[/C][C]1.4485[/C][C]1.41854512693142[/C][C]0.029954873068579[/C][/ROW]
[ROW][C]35[/C][C]1.4635[/C][C]1.43594404715227[/C][C]0.0275559528477276[/C][/ROW]
[ROW][C]36[/C][C]1.4587[/C][C]1.44947970385063[/C][C]0.0092202961493677[/C][/ROW]
[ROW][C]37[/C][C]1.4876[/C][C]1.47841699694778[/C][C]0.00918300305221598[/C][/ROW]
[ROW][C]38[/C][C]1.5189[/C][C]1.47526683505939[/C][C]0.0436331649406088[/C][/ROW]
[ROW][C]39[/C][C]1.5783[/C][C]1.52210866503914[/C][C]0.0561913349608576[/C][/ROW]
[ROW][C]40[/C][C]1.5633[/C][C]1.6121891051201[/C][C]-0.0488891051200999[/C][/ROW]
[ROW][C]41[/C][C]1.5554[/C][C]1.58235029754178[/C][C]-0.0269502975417761[/C][/ROW]
[ROW][C]42[/C][C]1.5757[/C][C]1.55780413970757[/C][C]0.0178958602924271[/C][/ROW]
[ROW][C]43[/C][C]1.5593[/C][C]1.54642584316601[/C][C]0.0128741568339867[/C][/ROW]
[ROW][C]44[/C][C]1.466[/C][C]1.56760594513540[/C][C]-0.101605945135396[/C][/ROW]
[ROW][C]45[/C][C]1.4065[/C][C]1.48401190275479[/C][C]-0.0775119027547904[/C][/ROW]
[ROW][C]46[/C][C]1.2759[/C][C]1.41714593694552[/C][C]-0.141245936945515[/C][/ROW]
[ROW][C]47[/C][C]1.2705[/C][C]1.29303222216783[/C][C]-0.0225322221678332[/C][/ROW]
[ROW][C]48[/C][C]1.3954[/C][C]1.26206420484254[/C][C]0.133335795157462[/C][/ROW]
[ROW][C]49[/C][C]1.2793[/C][C]1.39328151971938[/C][C]-0.113981519719385[/C][/ROW]
[ROW][C]50[/C][C]1.2694[/C][C]1.29468745091825[/C][C]-0.0252874509182524[/C][/ROW]
[ROW][C]51[/C][C]1.3282[/C][C]1.28693881536031[/C][C]0.0412611846396893[/C][/ROW]
[ROW][C]52[/C][C]1.323[/C][C]1.34623384672595[/C][C]-0.0232338467259532[/C][/ROW]
[ROW][C]53[/C][C]1.4135[/C][C]1.34139666361391[/C][C]0.0721033363860906[/C][/ROW]
[ROW][C]54[/C][C]1.4042[/C][C]1.40637035404089[/C][C]-0.00217035404088617[/C][/ROW]
[ROW][C]55[/C][C]1.4253[/C][C]1.37757180922969[/C][C]0.0477281907703144[/C][/ROW]
[ROW][C]56[/C][C]1.4322[/C][C]1.40734167778628[/C][C]0.0248583222137231[/C][/ROW]
[ROW][C]57[/C][C]1.4632[/C][C]1.4322074529292[/C][C]0.0309925470708017[/C][/ROW]
[ROW][C]58[/C][C]1.4713[/C][C]1.44355334801683[/C][C]0.0277466519831659[/C][/ROW]
[ROW][C]59[/C][C]1.5016[/C][C]1.47958938268773[/C][C]0.0220106173122729[/C][/ROW]
[ROW][C]60[/C][C]1.4318[/C][C]1.51274361457281[/C][C]-0.0809436145728115[/C][/ROW]
[/TABLE]
Source: https://freestatistics.org/blog/index.php?pk=108628&T=2

Globally Unique Identifier (entire table): ba.freestatistics.org/blog/index.php?pk=108628&T=2

As an alternative you can also use a QR Code:  

The GUIDs for individual cells are displayed in the table below:

Interpolation Forecasts of Exponential Smoothing
tObservedFittedResiduals
131.21591.214815491452990.00108450854700815
141.19221.190147606131160.00205239386883771
151.21141.209102378482260.0022976215177386
161.26141.257775915528950.00362408447105467
171.28121.274046789402750.00715321059724694
181.27861.268384434696310.0102155653036904
191.27721.238679173807770.0385208261922347
201.28151.30482596212927-0.0233259621292741
211.26791.263799151623060.00410084837693625
221.27651.272325438147910.0041745618520892
231.32471.257370807061510.0673291929384907
241.31911.314763432949570.00433656705043250
251.30291.34844971978419-0.045549719784195
261.32341.285519668096660.0378803319033416
271.33541.334044239223570.00135576077642630
281.36511.38217485887561-0.0170748588756138
291.34531.38200792159553-0.0367079215955290
301.35341.340737142608000.0126628573920033
311.37061.318026965922110.0525730340778903
321.36381.38487716203193-0.0210771620319317
331.42681.350527355480720.0762726445192803
341.44851.418545126931420.029954873068579
351.46351.435944047152270.0275559528477276
361.45871.449479703850630.0092202961493677
371.48761.478416996947780.00918300305221598
381.51891.475266835059390.0436331649406088
391.57831.522108665039140.0561913349608576
401.56331.6121891051201-0.0488891051200999
411.55541.58235029754178-0.0269502975417761
421.57571.557804139707570.0178958602924271
431.55931.546425843166010.0128741568339867
441.4661.56760594513540-0.101605945135396
451.40651.48401190275479-0.0775119027547904
461.27591.41714593694552-0.141245936945515
471.27051.29303222216783-0.0225322221678332
481.39541.262064204842540.133335795157462
491.27931.39328151971938-0.113981519719385
501.26941.29468745091825-0.0252874509182524
511.32821.286938815360310.0412611846396893
521.3231.34623384672595-0.0232338467259532
531.41351.341396663613910.0721033363860906
541.40421.40637035404089-0.00217035404088617
551.42531.377571809229690.0477281907703144
561.43221.407341677786280.0248583222137231
571.46321.43220745292920.0309925470708017
581.47131.443553348016830.0277466519831659
591.50161.479589382687730.0220106173122729
601.43181.51274361457281-0.0809436145728115


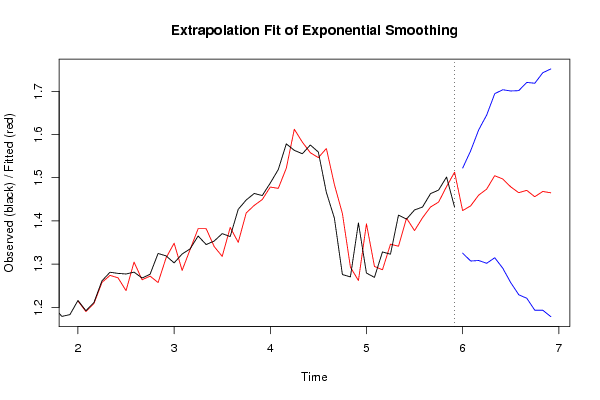
Extrapolation Forecasts of Exponential Smoothing
tForecast95% Lower Bound95% Upper Bound
611.423870950232631.325412069148851.52232983131641
621.434810949351161.307224778639041.56239712006327
631.459606610428261.308403731323101.61080948953342
641.473554184727231.301954679068261.64515369038619
651.504632083559881.314815145340151.69444902177960
661.497120724749741.290687806522481.70355364297700
671.478886769864461.257079129282511.70069441044642
681.465300426076921.229116791772501.70148406038134
691.470758719412841.22102528391421.72049215491148
701.455992033294871.193407059431811.71857700715793
711.468152551902751.193316331234191.74298877257130
721.465060139860141.178495962259231.75162431746105

\begin{tabular}{lllllllll}
\hline
Extrapolation Forecasts of Exponential Smoothing \tabularnewline
t & Forecast & 95% Lower Bound & 95% Upper Bound \tabularnewline
61 & 1.42387095023263 & 1.32541206914885 & 1.52232983131641 \tabularnewline
62 & 1.43481094935116 & 1.30722477863904 & 1.56239712006327 \tabularnewline
63 & 1.45960661042826 & 1.30840373132310 & 1.61080948953342 \tabularnewline
64 & 1.47355418472723 & 1.30195467906826 & 1.64515369038619 \tabularnewline
65 & 1.50463208355988 & 1.31481514534015 & 1.69444902177960 \tabularnewline
66 & 1.49712072474974 & 1.29068780652248 & 1.70355364297700 \tabularnewline
67 & 1.47888676986446 & 1.25707912928251 & 1.70069441044642 \tabularnewline
68 & 1.46530042607692 & 1.22911679177250 & 1.70148406038134 \tabularnewline
69 & 1.47075871941284 & 1.2210252839142 & 1.72049215491148 \tabularnewline
70 & 1.45599203329487 & 1.19340705943181 & 1.71857700715793 \tabularnewline
71 & 1.46815255190275 & 1.19331633123419 & 1.74298877257130 \tabularnewline
72 & 1.46506013986014 & 1.17849596225923 & 1.75162431746105 \tabularnewline
\hline
\end{tabular}
%Source: https://freestatistics.org/blog/index.php?pk=108628&T=3

[TABLE]
[ROW][C]Extrapolation Forecasts of Exponential Smoothing[/C][/ROW]
[ROW][C]t[/C][C]Forecast[/C][C]95% Lower Bound[/C][C]95% Upper Bound[/C][/ROW]
[ROW][C]61[/C][C]1.42387095023263[/C][C]1.32541206914885[/C][C]1.52232983131641[/C][/ROW]
[ROW][C]62[/C][C]1.43481094935116[/C][C]1.30722477863904[/C][C]1.56239712006327[/C][/ROW]
[ROW][C]63[/C][C]1.45960661042826[/C][C]1.30840373132310[/C][C]1.61080948953342[/C][/ROW]
[ROW][C]64[/C][C]1.47355418472723[/C][C]1.30195467906826[/C][C]1.64515369038619[/C][/ROW]
[ROW][C]65[/C][C]1.50463208355988[/C][C]1.31481514534015[/C][C]1.69444902177960[/C][/ROW]
[ROW][C]66[/C][C]1.49712072474974[/C][C]1.29068780652248[/C][C]1.70355364297700[/C][/ROW]
[ROW][C]67[/C][C]1.47888676986446[/C][C]1.25707912928251[/C][C]1.70069441044642[/C][/ROW]
[ROW][C]68[/C][C]1.46530042607692[/C][C]1.22911679177250[/C][C]1.70148406038134[/C][/ROW]
[ROW][C]69[/C][C]1.47075871941284[/C][C]1.2210252839142[/C][C]1.72049215491148[/C][/ROW]
[ROW][C]70[/C][C]1.45599203329487[/C][C]1.19340705943181[/C][C]1.71857700715793[/C][/ROW]
[ROW][C]71[/C][C]1.46815255190275[/C][C]1.19331633123419[/C][C]1.74298877257130[/C][/ROW]
[ROW][C]72[/C][C]1.46506013986014[/C][C]1.17849596225923[/C][C]1.75162431746105[/C][/ROW]
[/TABLE]
Source: https://freestatistics.org/blog/index.php?pk=108628&T=3

Globally Unique Identifier (entire table): ba.freestatistics.org/blog/index.php?pk=108628&T=3

As an alternative you can also use a QR Code:  

The GUIDs for individual cells are displayed in the table below:

Extrapolation Forecasts of Exponential Smoothing
tForecast95% Lower Bound95% Upper Bound
611.423870950232631.325412069148851.52232983131641
621.434810949351161.307224778639041.56239712006327
631.459606610428261.308403731323101.61080948953342
641.473554184727231.301954679068261.64515369038619
651.504632083559881.314815145340151.69444902177960
661.497120724749741.290687806522481.70355364297700
671.478886769864461.257079129282511.70069441044642
681.465300426076921.229116791772501.70148406038134
691.470758719412841.22102528391421.72049215491148
701.455992033294871.193407059431811.71857700715793
711.468152551902751.193316331234191.74298877257130
721.465060139860141.178495962259231.75162431746105


Parameters (Session):
par1 = 1 ; par2 = 0 ; par3 = 0 ; par4 = 1 ; par5 = 1 ; par6 = 0 ; par7 = 0 ; par8 = 1 ;
Parameters (R input):
par1 = 12 ; par2 = Triple ; par3 = additive ;
R code (references can be found in the software module):
par1 <- as.numeric(par1)
if (par2 == 'Single') K <- 1
if (par2 == 'Double') K <- 2
if (par2 == 'Triple') K <- par1
nx <- length(x)
nxmK <- nx - K
x <- ts(x, frequency = par1)
if (par2 == 'Single') fit <- HoltWinters(x, gamma=F, beta=F)
if (par2 == 'Double') fit <- HoltWinters(x, gamma=F)
if (par2 == 'Triple') fit <- HoltWinters(x, seasonal=par3)
fit
myresid <- x - fit$fitted[,'xhat']
bitmap(file='test1.png')
op <- par(mfrow=c(2,1))
plot(fit,ylab='Observed (black) / Fitted (red)',main='Interpolation Fit of Exponential Smoothing')
plot(myresid,ylab='Residuals',main='Interpolation Prediction Errors')
par(op)
dev.off()
bitmap(file='test2.png')
p <- predict(fit, par1, prediction.interval=TRUE)
np <- length(p[,1])
plot(fit,p,ylab='Observed (black) / Fitted (red)',main='Extrapolation Fit of Exponential Smoothing')
dev.off()
bitmap(file='test3.png')
op <- par(mfrow = c(2,2))
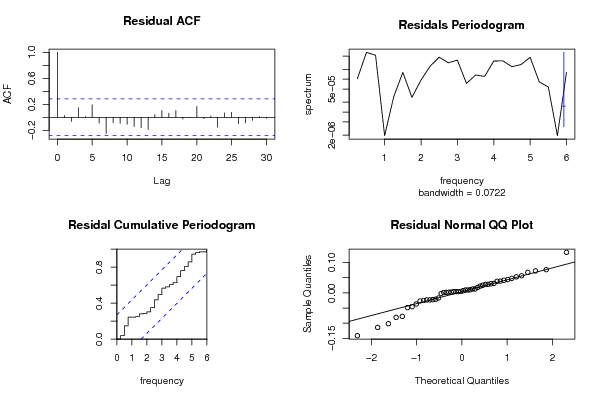
acf(as.numeric(myresid),lag.max = nx/2,main='Residual ACF')
spectrum(myresid,main='Residals Periodogram')
cpgram(myresid,main='Residal Cumulative Periodogram')
qqnorm(myresid,main='Residual Normal QQ Plot')
qqline(myresid)
par(op)
dev.off()
load(file='createtable')
a<-table.start()
a<-table.row.start(a)
a<-table.element(a,'Estimated Parameters of Exponential Smoothing',2,TRUE)
a<-table.row.end(a)
a<-table.row.start(a)
a<-table.element(a,'Parameter',header=TRUE)
a<-table.element(a,'Value',header=TRUE)
a<-table.row.end(a)
a<-table.row.start(a)
a<-table.element(a,'alpha',header=TRUE)
a<-table.element(a,fit$alpha)
a<-table.row.end(a)
a<-table.row.start(a)
a<-table.element(a,'beta',header=TRUE)
a<-table.element(a,fit$beta)
a<-table.row.end(a)
a<-table.row.start(a)
a<-table.element(a,'gamma',header=TRUE)
a<-table.element(a,fit$gamma)
a<-table.row.end(a)
a<-table.end(a)
table.save(a,file='mytable.tab')
a<-table.start()
a<-table.row.start(a)
a<-table.element(a,'Interpolation Forecasts of Exponential Smoothing',4,TRUE)
a<-table.row.end(a)
a<-table.row.start(a)
a<-table.element(a,'t',header=TRUE)
a<-table.element(a,'Observed',header=TRUE)
a<-table.element(a,'Fitted',header=TRUE)
a<-table.element(a,'Residuals',header=TRUE)
a<-table.row.end(a)
for (i in 1:nxmK) {
a<-table.row.start(a)
a<-table.element(a,i+K,header=TRUE)
a<-table.element(a,x[i+K])
a<-table.element(a,fit$fitted[i,'xhat'])
a<-table.element(a,myresid[i])
a<-table.row.end(a)
}
a<-table.end(a)
table.save(a,file='mytable1.tab')
a<-table.start()
a<-table.row.start(a)
a<-table.element(a,'Extrapolation Forecasts of Exponential Smoothing',4,TRUE)
a<-table.row.end(a)
a<-table.row.start(a)
a<-table.element(a,'t',header=TRUE)
a<-table.element(a,'Forecast',header=TRUE)
a<-table.element(a,'95% Lower Bound',header=TRUE)
a<-table.element(a,'95% Upper Bound',header=TRUE)
a<-table.row.end(a)
for (i in 1:np) {
a<-table.row.start(a)
a<-table.element(a,nx+i,header=TRUE)
a<-table.element(a,p[i,'fit'])
a<-table.element(a,p[i,'lwr'])
a<-table.element(a,p[i,'upr'])
a<-table.row.end(a)
}
a<-table.end(a)
table.save(a,file='mytable2.tab')