| Multiple Linear Regression - Estimated Regression Equation |
| SWS[t] = + 12.4551571575038 -2.60907293057974e-06Wb[t] -1.28212910743101D[t] + e[t] |
| Multiple Linear Regression - Ordinary Least Squares | |||||
| Variable | Parameter | S.D. | T-STAT H0: parameter = 0 | 2-tail p-value | 1-tail p-value |
| (Intercept) | 12.4551571575038 | 1.081025 | 11.5216 | 0 | 0 |
| Wb | -2.60907293057974e-06 | 1e-06 | -2.054 | 0.046724 | 0.023362 |
| D | -1.28212910743101 | 0.368024 | -3.4838 | 0.001236 | 0.000618 |
| Multiple Linear Regression - Regression Statistics | |
| Multiple R | 0.596270761662356 |
| R-squared | 0.355538821213406 |
| Adjusted R-squared | 0.322489529993581 |
| F-TEST (value) | 10.7578349819535 |
| F-TEST (DF numerator) | 2 |
| F-TEST (DF denominator) | 39 |
| p-value | 0.000190255336011802 |
| Multiple Linear Regression - Residual Statistics | |
| Residual Standard Deviation | 3.15863376267557 |
| Sum Squared Residuals | 389.101722621848 |
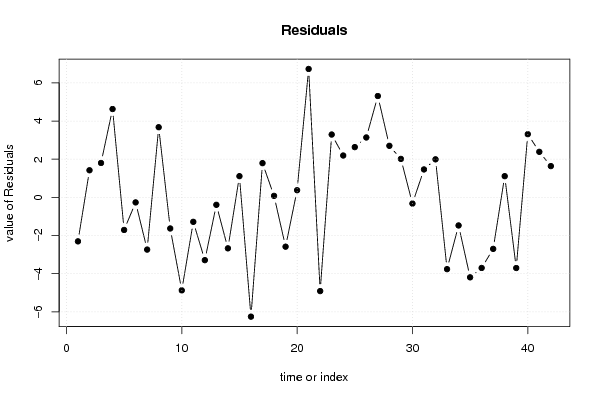
| Multiple Linear Regression - Actuals, Interpolation, and Residuals | |||
| Time or Index | Actuals | Interpolation Forecast | Residuals Prediction Error |
| 1 | 6.3 | 8.60616076228015 | -2.30616076228015 |
| 2 | 2.1 | 0.681331973593129 | 1.41866802640687 |
| 3 | 9.1 | 7.29911500836211 | 1.80088499163789 |
| 4 | 15.8 | 11.1730279900641 | 4.62697200993592 |
| 5 | 5.2 | 6.90918905888697 | -1.70918905888697 |
| 6 | 10.9 | 11.1644181094018 | -0.264418109401844 |
| 7 | 8.3 | 11.0369388060137 | -2.73693880601372 |
| 8 | 11 | 7.32663961892373 | 3.67336038107627 |
| 9 | 3.2 | 4.83129270762914 | -1.63129270762914 |
| 10 | 6.3 | 11.1730278543923 | -4.87302785439229 |
| 11 | 8.6 | 9.88307172385 | -1.28307172385001 |
| 12 | 6.6 | 9.8908968945195 | -3.2908968945195 |
| 13 | 9.5 | 9.89089842082716 | -0.390898420827161 |
| 14 | 3.3 | 5.97234466308888 | -2.67234466308888 |
| 15 | 11 | 9.890898629553 | 1.109101370447 |
| 16 | 4.7 | 10.9512568509735 | -6.25125685097348 |
| 17 | 10.4 | 8.60876957169437 | 1.79123042830563 |
| 18 | 7.4 | 7.32392729193193 | 0.0760727080680756 |
| 19 | 2.1 | 4.68518462351667 | -2.58518462351667 |
| 20 | 7.7 | 7.32664071473436 | 0.373359285265637 |
| 21 | 17.9 | 11.173028023982 | 6.72697197601797 |
| 22 | 6.1 | 11.0112655283768 | -4.91126552837681 |
| 23 | 11.9 | 8.60876977520206 | 3.29123022479794 |
| 24 | 10.8 | 8.60876970997524 | 2.19123029002476 |
| 25 | 13.8 | 11.1685926260908 | 2.63140737390923 |
| 26 | 14.3 | 11.1638962948157 | 3.13610370518427 |
| 27 | 15.2 | 9.89089769028674 | 5.30910230971326 |
| 28 | 10 | 7.30054999847393 | 2.69945000152607 |
| 29 | 11.9 | 9.8866722444942 | 2.01332775550579 |
| 30 | 6.5 | 6.82569872510842 | -0.325698725108417 |
| 31 | 7.5 | 6.03798893802227 | 1.46201106197773 |
| 32 | 10.6 | 8.60876910467032 | 1.99123089532968 |
| 33 | 7.4 | 11.1619786262118 | -3.76197862621175 |
| 34 | 8.4 | 9.8731572467138 | -1.4731572467138 |
| 35 | 5.7 | 9.89089698583705 | -4.19089698583705 |
| 36 | 4.9 | 8.59937717266065 | -3.69937717266065 |
| 37 | 3.2 | 5.89970807270154 | -2.69970807270154 |
| 38 | 11 | 9.8908965944761 | 1.10910340552389 |
| 39 | 4.9 | 8.60355168934958 | -3.70355168934958 |
| 40 | 13.2 | 9.89089867129816 | 3.30910132870184 |
| 41 | 9.7 | 7.3157087122006 | 2.3842912877994 |
| 42 | 12.8 | 11.1638962948157 | 1.63610370518427 |
| Goldfeld-Quandt test for Heteroskedasticity | |||
| p-values | Alternative Hypothesis | ||
| breakpoint index | greater | 2-sided | less |
| 6 | 0.535710244258234 | 0.928579511483533 | 0.464289755741766 |
| 7 | 0.57586107156556 | 0.848277856868879 | 0.42413892843444 |
| 8 | 0.593979741678422 | 0.812040516643155 | 0.406020258321578 |
| 9 | 0.509224955504818 | 0.981550088990363 | 0.490775044495182 |
| 10 | 0.63668181832318 | 0.72663636335364 | 0.36331818167682 |
| 11 | 0.529881121108955 | 0.94023775778209 | 0.470118878891045 |
| 12 | 0.504489925776917 | 0.991020148446166 | 0.495510074223083 |
| 13 | 0.398638535710841 | 0.797277071421681 | 0.60136146428916 |
| 14 | 0.370805079321416 | 0.741610158642832 | 0.629194920678584 |
| 15 | 0.303208658835065 | 0.606417317670131 | 0.696791341164935 |
| 16 | 0.50365443221671 | 0.99269113556658 | 0.49634556778329 |
| 17 | 0.451521023687843 | 0.903042047375686 | 0.548478976312157 |
| 18 | 0.358075502289102 | 0.716151004578204 | 0.641924497710898 |
| 19 | 0.326175648841212 | 0.652351297682424 | 0.673824351158788 |
| 20 | 0.248992732467619 | 0.497985464935239 | 0.75100726753238 |
| 21 | 0.582048978214444 | 0.835902043571112 | 0.417951021785556 |
| 22 | 0.665023413895252 | 0.669953172209497 | 0.334976586104748 |
| 23 | 0.66017847947044 | 0.67964304105912 | 0.33982152052956 |
| 24 | 0.604168157623736 | 0.791663684752528 | 0.395831842376264 |
| 25 | 0.5616967856264 | 0.8766064287472 | 0.4383032143736 |
| 26 | 0.546592701596597 | 0.906814596806806 | 0.453407298403403 |
| 27 | 0.70789923368139 | 0.584201532637219 | 0.29210076631861 |
| 28 | 0.67751062581455 | 0.644978748370899 | 0.322489374185449 |
| 29 | 0.633787106782382 | 0.732425786435237 | 0.366212893217618 |
| 30 | 0.610338472631632 | 0.779323054736736 | 0.389661527368368 |
| 31 | 0.501738110729299 | 0.996523778541403 | 0.498261889270701 |
| 32 | 0.436109955952149 | 0.872219911904297 | 0.563890044047851 |
| 33 | 0.428384860463626 | 0.856769720927253 | 0.571615139536374 |
| 34 | 0.315136300543802 | 0.630272601087603 | 0.684863699456198 |
| 35 | 0.397794753204577 | 0.795589506409154 | 0.602205246795423 |
| 36 | 0.445701044819113 | 0.891402089638227 | 0.554298955180887 |
| Meta Analysis of Goldfeld-Quandt test for Heteroskedasticity | |||
| Description | # significant tests | % significant tests | OK/NOK |
| 1% type I error level | 0 | 0 | OK |
| 5% type I error level | 0 | 0 | OK |
| 10% type I error level | 0 | 0 | OK |