| Multiple Linear Regression - Estimated Regression Equation |
| paradoxical[t] = + 0.0103628511468773 + 3.85439210376215e-08body[t] -2.50098441001066e-08brain[t] -1.00261472952337slowwave[t] + 1.00167966608105total_sleep[t] + 0.000330522132720004lifespan[t] -8.48554963988697e-06gestation[t] -0.00925530811622734predation[t] -0.00583287894048159sleepexp.[t] + 0.0109670647062305danger[t] + e[t] |
| Multiple Linear Regression - Ordinary Least Squares | |||||
| Variable | Parameter | S.D. | T-STAT H0: parameter = 0 | 2-tail p-value | 1-tail p-value |
| (Intercept) | 0.0103628511468773 | 0.020374 | 0.5086 | 0.614864 | 0.307432 |
| body | 3.85439210376215e-08 | 0 | 1.0237 | 0.314459 | 0.157229 |
| brain | -2.50098441001066e-08 | 0 | -1.1623 | 0.254576 | 0.127288 |
| slowwave | -1.00261472952337 | 0.003509 | -285.7359 | 0 | 0 |
| total_sleep | 1.00167966608105 | 0.003411 | 293.6964 | 0 | 0 |
| lifespan | 0.000330522132720004 | 0.000302 | 1.0933 | 0.283262 | 0.141631 |
| gestation | -8.48554963988697e-06 | 5e-05 | -0.168 | 0.867711 | 0.433856 |
| predation | -0.00925530811622734 | 0.006937 | -1.3342 | 0.192525 | 0.096262 |
| sleepexp. | -0.00583287894048159 | 0.003931 | -1.484 | 0.148597 | 0.074299 |
| danger | 0.0109670647062305 | 0.009771 | 1.1224 | 0.27091 | 0.135455 |
| Multiple Linear Regression - Regression Statistics | |
| Multiple R | 0.999948080361548 |
| R-squared | 0.999896163418744 |
| Adjusted R-squared | 0.999863938272837 |
| F-TEST (value) | 31028.4448767099 |
| F-TEST (DF numerator) | 9 |
| F-TEST (DF denominator) | 29 |
| p-value | 0 |
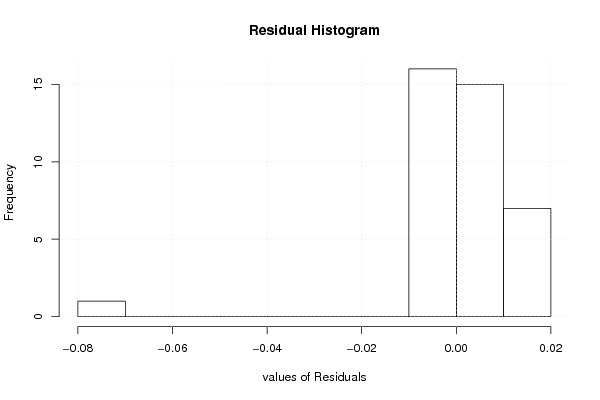
| Multiple Linear Regression - Residual Statistics | |
| Residual Standard Deviation | 0.0164064833511368 |
| Sum Squared Residuals | 0.00780600818258273 |
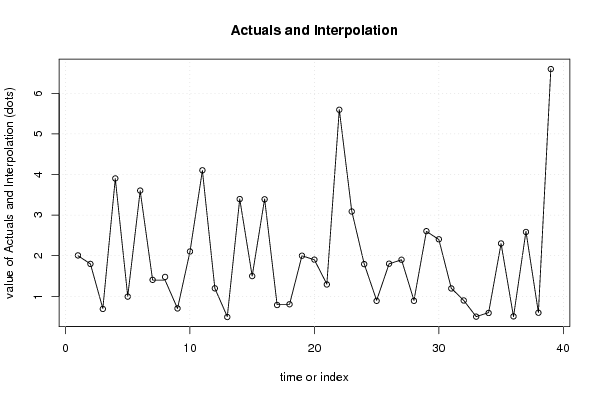
| Multiple Linear Regression - Actuals, Interpolation, and Residuals | |||
| Time or Index | Actuals | Interpolation Forecast | Residuals Prediction Error |
| 1 | 2 | 2.00813810991424 | -0.00813810991423942 |
| 2 | 1.8 | 1.79892265531016 | 0.00107734468984229 |
| 3 | 0.7 | 0.689859120675839 | 0.0101408793241612 |
| 4 | 3.9 | 3.90400134367608 | -0.00400134367608236 |
| 5 | 1 | 0.993524720074432 | 0.00647527992556754 |
| 6 | 3.6 | 3.60447042924575 | -0.00447042924574755 |
| 7 | 1.4 | 1.40641278447473 | -0.00641278447472853 |
| 8 | 1.4 | 1.47806008182583 | -0.078060081825828 |
| 9 | 0.7 | 0.702815786396743 | -0.00281578639674306 |
| 10 | 2.1 | 2.10464857935467 | -0.00464857935467079 |
| 11 | 4.1 | 4.10437505436573 | -0.00437505436573254 |
| 12 | 1.2 | 1.19754722575294 | 0.00245277424705923 |
| 13 | 0.5 | 0.491055937167445 | 0.00894406283255459 |
| 14 | 3.4 | 3.39525160638479 | 0.00474839361520612 |
| 15 | 1.5 | 1.49876959286694 | 0.00123040713306228 |
| 16 | 3.4 | 3.38977789890198 | 0.0102221010980242 |
| 17 | 0.8 | 0.786717678329388 | 0.0132823216706118 |
| 18 | 0.8 | 0.805190147431608 | -0.00519014743160751 |
| 19 | 2 | 2.00037167664621 | -0.000371676646214936 |
| 20 | 1.9 | 1.9038925077626 | -0.00389250776259970 |
| 21 | 1.3 | 1.29236268904466 | 0.00763731095533718 |
| 22 | 5.6 | 5.59494742194593 | 0.00505257805407105 |
| 23 | 3.1 | 3.08981690361952 | 0.0101830963804768 |
| 24 | 1.8 | 1.79332169562916 | 0.00667830437084161 |
| 25 | 0.9 | 0.88878273757575 | 0.0112172624242495 |
| 26 | 1.8 | 1.80377949167953 | -0.00377949167952611 |
| 27 | 1.9 | 1.90183873519995 | -0.00183873519995174 |
| 28 | 0.9 | 0.889736050089149 | 0.0102639499108511 |
| 29 | 2.6 | 2.60544845086842 | -0.00544845086842071 |
| 30 | 2.4 | 2.4050540636001 | -0.00505406360010157 |
| 31 | 1.2 | 1.1944276421643 | 0.00557235783569996 |
| 32 | 0.9 | 0.898399258383226 | 0.00160074161677424 |
| 33 | 0.5 | 0.499777820726067 | 0.00022217927393291 |
| 34 | 0.6 | 0.590864425586544 | 0.00913557441345591 |
| 35 | 2.3 | 2.30244424522104 | -0.00244424522103632 |
| 36 | 0.5 | 0.506474536976637 | -0.00647453697663672 |
| 37 | 2.6 | 2.58519693756779 | 0.0148030624322094 |
| 38 | 0.6 | 0.596510418775831 | 0.00348958122416917 |
| 39 | 6.6 | 6.59701353878829 | 0.00298646121170936 |
| Goldfeld-Quandt test for Heteroskedasticity | |||
| p-values | Alternative Hypothesis | ||
| breakpoint index | greater | 2-sided | less |
| 13 | 1 | 1.33823399697445e-188 | 6.69116998487225e-189 |
| 14 | 1 | 1.49178728325363e-195 | 7.45893641626815e-196 |
| 15 | 1 | 1.73212178198017e-182 | 8.66060890990086e-183 |
| 16 | 1 | 1.49221949467581e-170 | 7.46109747337905e-171 |
| 17 | 1 | 4.90040980982609e-158 | 2.45020490491305e-158 |
| 18 | 1 | 6.40657856975624e-145 | 3.20328928487812e-145 |
| 19 | 1 | 1.28207222514613e-131 | 6.41036112573065e-132 |
| 20 | 1 | 7.13482345630461e-118 | 3.56741172815231e-118 |
| 21 | 1 | 3.46682432340043e-104 | 1.73341216170022e-104 |
| 22 | 1 | 1.53132999949218e-91 | 7.65664999746092e-92 |
| 23 | 1 | 9.62301778837544e-79 | 4.81150889418772e-79 |
| 24 | 1 | 6.53081454031816e-66 | 3.26540727015908e-66 |
| 25 | 1 | 3.36146313227097e-52 | 1.68073156613548e-52 |
| 26 | 1 | 4.6541564608213e-40 | 2.32707823041065e-40 |
| Meta Analysis of Goldfeld-Quandt test for Heteroskedasticity | |||
| Description | # significant tests | % significant tests | OK/NOK |
| 1% type I error level | 14 | 1 | NOK |
| 5% type I error level | 14 | 1 | NOK |
| 10% type I error level | 14 | 1 | NOK |