Free Statistics

of Irreproducible Research!

Author's title

Author*The author of this computation has been verified*
R Software Modulerwasp_multipleregression.wasp
Title produced by softwareMultiple Regression
Date of computationSun, 12 Dec 2010 17:20:00 +0000
Cite this page as followsStatistical Computations at FreeStatistics.org, Office for Research Development and Education, URL https://freestatistics.org/blog/index.php?v=date/2010/Dec/12/t1292174325ispsdqleet1fddi.htm/, Retrieved Tue, 07 May 2024 05:49:07 +0000
Statistical Computations at FreeStatistics.org, Office for Research Development and Education, URL https://freestatistics.org/blog/index.php?pk=108568, Retrieved Tue, 07 May 2024 05:49:07 +0000
QR Codes:

Original text written by user:
IsPrivate?No (this computation is public)
User-defined keywords
Estimated Impact87
Family? (F = Feedback message, R = changed R code, M = changed R Module, P = changed Parameters, D = changed Data)
-       [Multiple Regression] [onderzoek link 2] [2010-12-12 17:20:00] [b881b0959d750616b68c30017e4e0761] [Current]
Feedback Forum

Post a new message
Dataseries X:
1000.00	6600.00	6.3	2.00	8.30	4.50	42.00	3.00	1.00	3.00
2547000.00	4603000.00	2.1	1.80	3.90	69.00	624.00	3.00	5.00	4.00
10550.00	179500.00	9.1	0.70	9.80	27.00	180.00	4.00	4.00	4.00
0.02	.300	15.8	3.90	19.70	19.00	35.00	1.00	1.00	1.00
160000.00	169000.00	5.2	1.00	6.20	30.40	392.00	4.00	5.00	4.00
3300.00	25600.00	10.9	3.60	14.50	28.00	63.00	1.00	2.00	1.00
52160.00	440000.00	8.3	1.40	9.70	50.00	230.00	1.00	1.00	1.00
0.43	6400.00	11.0	1.40	12.50	7.00	112.00	5.00	4.00	4.00
465000.00	423000.00	3.2	0.70	3.90	30.00	281.00	5.00	5.00	5.00
0.75	1200.00	6.3	2.10	8.40	3.50	42.00	1.00	1.00	1.00
0.79	3500.00	6.6	4.10	10.70	6.00	42.00	2.00	2.00	2.00
0.20	5000.00	9.5	1.20	10.70	10.40	120.00	2.00	2.00	2.00
27660.00	115000.00	3.3	0.50	3.80	20.00	148.00	5.00	5.00	5.00
0.12	1000.00	11.0	3.40	14.40	3.90	16.00	3.00	1.00	2.00
85000.00	325000.00	4.7	1.50	6.20	41.00	310.00	1.00	3.00	1.00
0.10	4000.00	10.4	3.40	13.80	9.00	28.00	5.00	1.00	3.00
1040.00	5500.00	7.4	0.80	8.20	7.60	68.00	5.00	3.00	4.00
521000.00	655000.00	2.1	0.80	2.90	46.00	336.00	5.00	5.00	5.00
0.10	0.25	17.9	2.00	19.90	24.00	50.00	1.00	1.00	1.00
62000.00	1320000.00	6.1	1.90	8.00	100.00	267.00	1.00	1.00	1.00
0.23	0.40	11.9	1.30	13.20	3.20	19.00	4.00	1.00	3.00
1700.00	6300.00	13.8	5.60	19.40	5.00	12.00	2.00	1.00	1.00
3500.00	10800.00	14.3	3.10	17.40	6.50	120.00	2.00	1.00	1.00
0.48	15500.00	15.2	1.80	17.00	12.00	140.00	2.00	2.00	2.00
10000.00	115000.00	10.0	0.90	10.90	20.20	170.00	4.00	4.00	4.00
1620.00	11400.00	11.9	1.80	13.70	13.00	17.00	2.00	1.00	2.00
192000.00	180000.00	6.5	1.90	8.40	27.00	115.00	4.00	4.00	4.00
2500.00	12100.00	7.5	0.90	8.40	18.00	31.00	5.00	5.00	5.00
0.28	1900.00	10.6	2.60	13.20	4.70	21.00	3.00	1.00	3.00
4235.00	50400.00	7.4	2.40	9.80	9.80	52.00	1.00	1.00	1.00
6800.00	179000.00	8.4	1.20	9.60	29.00	164.00	2.00	3.00	2.00
0.75	12300.00	5.7	0.90	6.60	7.00	225.00	2.00	2.00	2.00
3600.00	21000.00	4.9	0.50	5.40	6.00	225.00	3.00	2.00	3.00
55500.00	175000.00	3.2	0.60	3.80	20.00	151.00	5.00	5.00	5.00
0.90	2600.00	11.0	2.30	13.30	4.50	60.00	2.00	1.00	2.00
2000.00	12300.00	4.9	0.50	5.40	7.50	200.00	3.00	1.00	3.00
0.10	2500.00	13.2	2.60	15.80	2.30	46.00	3.00	2.00	2.00
4190.00	58000.00	9.7	0.60	10.30	24.00	210.00	4.00	3.00	4.00
3500.00	3900.00	12.8	6.60	19.40	3.00	14.00	2.00	1.00	1.00


Summary of computational transaction
Raw Inputview raw input (R code)
Raw Outputview raw output of R engine
Computing time5 seconds
R Server'Sir Ronald Aylmer Fisher' @ 193.190.124.24

\begin{tabular}{lllllllll}
\hline
Summary of computational transaction \tabularnewline
Raw Input & view raw input (R code)  \tabularnewline
Raw Output & view raw output of R engine  \tabularnewline
Computing time & 5 seconds \tabularnewline
R Server & 'Sir Ronald Aylmer Fisher' @ 193.190.124.24 \tabularnewline
\hline
\end{tabular}
%Source: https://freestatistics.org/blog/index.php?pk=108568&T=0

[TABLE]
[ROW][C]Summary of computational transaction[/C][/ROW]
[ROW][C]Raw Input[/C][C]view raw input (R code) [/C][/ROW]
[ROW][C]Raw Output[/C][C]view raw output of R engine [/C][/ROW]
[ROW][C]Computing time[/C][C]5 seconds[/C][/ROW]
[ROW][C]R Server[/C][C]'Sir Ronald Aylmer Fisher' @ 193.190.124.24[/C][/ROW]
[/TABLE]
Source: https://freestatistics.org/blog/index.php?pk=108568&T=0

Globally Unique Identifier (entire table): ba.freestatistics.org/blog/index.php?pk=108568&T=0

As an alternative you can also use a QR Code:  

The GUIDs for individual cells are displayed in the table below:

Summary of computational transaction
Raw Inputview raw input (R code)
Raw Outputview raw output of R engine
Computing time5 seconds
R Server'Sir Ronald Aylmer Fisher' @ 193.190.124.24


Multiple Linear Regression - Estimated Regression Equation
paradoxical[t] = + 0.0103628511468773 + 3.85439210376215e-08body[t] -2.50098441001066e-08brain[t] -1.00261472952337slowwave[t] + 1.00167966608105total_sleep[t] + 0.000330522132720004lifespan[t] -8.48554963988697e-06gestation[t] -0.00925530811622734predation[t] -0.00583287894048159sleepexp.[t] + 0.0109670647062305danger[t] + e[t]

\begin{tabular}{lllllllll}
\hline
Multiple Linear Regression - Estimated Regression Equation \tabularnewline
paradoxical[t] =  +  0.0103628511468773 +  3.85439210376215e-08body[t] -2.50098441001066e-08brain[t] -1.00261472952337slowwave[t] +  1.00167966608105total_sleep[t] +  0.000330522132720004lifespan[t] -8.48554963988697e-06gestation[t] -0.00925530811622734predation[t] -0.00583287894048159sleepexp.[t] +  0.0109670647062305danger[t]  + e[t] \tabularnewline
\hline
\end{tabular}
%Source: https://freestatistics.org/blog/index.php?pk=108568&T=1

[TABLE]
[ROW][C]Multiple Linear Regression - Estimated Regression Equation[/C][/ROW]
[ROW][C]paradoxical[t] =  +  0.0103628511468773 +  3.85439210376215e-08body[t] -2.50098441001066e-08brain[t] -1.00261472952337slowwave[t] +  1.00167966608105total_sleep[t] +  0.000330522132720004lifespan[t] -8.48554963988697e-06gestation[t] -0.00925530811622734predation[t] -0.00583287894048159sleepexp.[t] +  0.0109670647062305danger[t]  + e[t][/C][/ROW]
[/TABLE]
Source: https://freestatistics.org/blog/index.php?pk=108568&T=1

Globally Unique Identifier (entire table): ba.freestatistics.org/blog/index.php?pk=108568&T=1

As an alternative you can also use a QR Code:  

The GUIDs for individual cells are displayed in the table below:

Multiple Linear Regression - Estimated Regression Equation
paradoxical[t] = + 0.0103628511468773 + 3.85439210376215e-08body[t] -2.50098441001066e-08brain[t] -1.00261472952337slowwave[t] + 1.00167966608105total_sleep[t] + 0.000330522132720004lifespan[t] -8.48554963988697e-06gestation[t] -0.00925530811622734predation[t] -0.00583287894048159sleepexp.[t] + 0.0109670647062305danger[t] + e[t]


Multiple Linear Regression - Ordinary Least Squares
VariableParameterS.D.T-STATH0: parameter = 02-tail p-value1-tail p-value
(Intercept)0.01036285114687730.0203740.50860.6148640.307432
body3.85439210376215e-0801.02370.3144590.157229
brain-2.50098441001066e-080-1.16230.2545760.127288
slowwave-1.002614729523370.003509-285.735900
total_sleep1.001679666081050.003411293.696400
lifespan0.0003305221327200040.0003021.09330.2832620.141631
gestation-8.48554963988697e-065e-05-0.1680.8677110.433856
predation-0.009255308116227340.006937-1.33420.1925250.096262
sleepexp.-0.005832878940481590.003931-1.4840.1485970.074299
danger0.01096706470623050.0097711.12240.270910.135455

\begin{tabular}{lllllllll}
\hline
Multiple Linear Regression - Ordinary Least Squares \tabularnewline
Variable & Parameter & S.D. & T-STATH0: parameter = 0 & 2-tail p-value & 1-tail p-value \tabularnewline
(Intercept) & 0.0103628511468773 & 0.020374 & 0.5086 & 0.614864 & 0.307432 \tabularnewline
body & 3.85439210376215e-08 & 0 & 1.0237 & 0.314459 & 0.157229 \tabularnewline
brain & -2.50098441001066e-08 & 0 & -1.1623 & 0.254576 & 0.127288 \tabularnewline
slowwave & -1.00261472952337 & 0.003509 & -285.7359 & 0 & 0 \tabularnewline
total_sleep & 1.00167966608105 & 0.003411 & 293.6964 & 0 & 0 \tabularnewline
lifespan & 0.000330522132720004 & 0.000302 & 1.0933 & 0.283262 & 0.141631 \tabularnewline
gestation & -8.48554963988697e-06 & 5e-05 & -0.168 & 0.867711 & 0.433856 \tabularnewline
predation & -0.00925530811622734 & 0.006937 & -1.3342 & 0.192525 & 0.096262 \tabularnewline
sleepexp. & -0.00583287894048159 & 0.003931 & -1.484 & 0.148597 & 0.074299 \tabularnewline
danger & 0.0109670647062305 & 0.009771 & 1.1224 & 0.27091 & 0.135455 \tabularnewline
\hline
\end{tabular}
%Source: https://freestatistics.org/blog/index.php?pk=108568&T=2

[TABLE]
[ROW][C]Multiple Linear Regression - Ordinary Least Squares[/C][/ROW]
[ROW][C]Variable[/C][C]Parameter[/C][C]S.D.[/C][C]T-STATH0: parameter = 0[/C][C]2-tail p-value[/C][C]1-tail p-value[/C][/ROW]
[ROW][C](Intercept)[/C][C]0.0103628511468773[/C][C]0.020374[/C][C]0.5086[/C][C]0.614864[/C][C]0.307432[/C][/ROW]
[ROW][C]body[/C][C]3.85439210376215e-08[/C][C]0[/C][C]1.0237[/C][C]0.314459[/C][C]0.157229[/C][/ROW]
[ROW][C]brain[/C][C]-2.50098441001066e-08[/C][C]0[/C][C]-1.1623[/C][C]0.254576[/C][C]0.127288[/C][/ROW]
[ROW][C]slowwave[/C][C]-1.00261472952337[/C][C]0.003509[/C][C]-285.7359[/C][C]0[/C][C]0[/C][/ROW]
[ROW][C]total_sleep[/C][C]1.00167966608105[/C][C]0.003411[/C][C]293.6964[/C][C]0[/C][C]0[/C][/ROW]
[ROW][C]lifespan[/C][C]0.000330522132720004[/C][C]0.000302[/C][C]1.0933[/C][C]0.283262[/C][C]0.141631[/C][/ROW]
[ROW][C]gestation[/C][C]-8.48554963988697e-06[/C][C]5e-05[/C][C]-0.168[/C][C]0.867711[/C][C]0.433856[/C][/ROW]
[ROW][C]predation[/C][C]-0.00925530811622734[/C][C]0.006937[/C][C]-1.3342[/C][C]0.192525[/C][C]0.096262[/C][/ROW]
[ROW][C]sleepexp.[/C][C]-0.00583287894048159[/C][C]0.003931[/C][C]-1.484[/C][C]0.148597[/C][C]0.074299[/C][/ROW]
[ROW][C]danger[/C][C]0.0109670647062305[/C][C]0.009771[/C][C]1.1224[/C][C]0.27091[/C][C]0.135455[/C][/ROW]
[/TABLE]
Source: https://freestatistics.org/blog/index.php?pk=108568&T=2

Globally Unique Identifier (entire table): ba.freestatistics.org/blog/index.php?pk=108568&T=2

As an alternative you can also use a QR Code:  

The GUIDs for individual cells are displayed in the table below:

Multiple Linear Regression - Ordinary Least Squares
VariableParameterS.D.T-STATH0: parameter = 02-tail p-value1-tail p-value
(Intercept)0.01036285114687730.0203740.50860.6148640.307432
body3.85439210376215e-0801.02370.3144590.157229
brain-2.50098441001066e-080-1.16230.2545760.127288
slowwave-1.002614729523370.003509-285.735900
total_sleep1.001679666081050.003411293.696400
lifespan0.0003305221327200040.0003021.09330.2832620.141631
gestation-8.48554963988697e-065e-05-0.1680.8677110.433856
predation-0.009255308116227340.006937-1.33420.1925250.096262
sleepexp.-0.005832878940481590.003931-1.4840.1485970.074299
danger0.01096706470623050.0097711.12240.270910.135455


Multiple Linear Regression - Regression Statistics
Multiple R0.999948080361548
R-squared0.999896163418744
Adjusted R-squared0.999863938272837
F-TEST (value)31028.4448767099
F-TEST (DF numerator)9
F-TEST (DF denominator)29
p-value0
Multiple Linear Regression - Residual Statistics
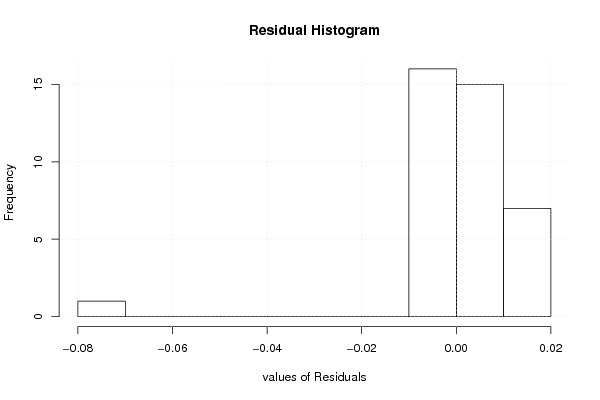
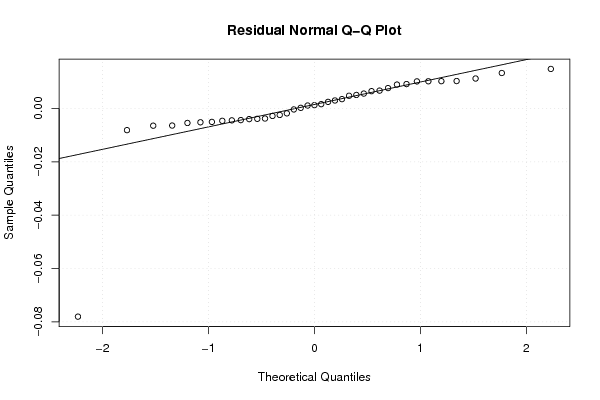
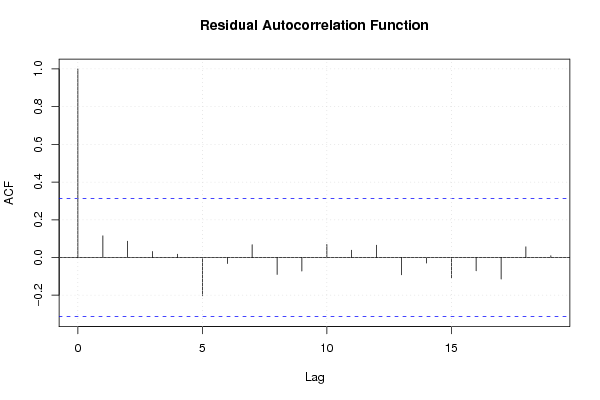
Residual Standard Deviation0.0164064833511368
Sum Squared Residuals0.00780600818258273

\begin{tabular}{lllllllll}
\hline
Multiple Linear Regression - Regression Statistics \tabularnewline
Multiple R & 0.999948080361548 \tabularnewline
R-squared & 0.999896163418744 \tabularnewline
Adjusted R-squared & 0.999863938272837 \tabularnewline
F-TEST (value) & 31028.4448767099 \tabularnewline
F-TEST (DF numerator) & 9 \tabularnewline
F-TEST (DF denominator) & 29 \tabularnewline
p-value & 0 \tabularnewline
Multiple Linear Regression - Residual Statistics \tabularnewline
Residual Standard Deviation & 0.0164064833511368 \tabularnewline
Sum Squared Residuals & 0.00780600818258273 \tabularnewline
\hline
\end{tabular}
%Source: https://freestatistics.org/blog/index.php?pk=108568&T=3

[TABLE]
[ROW][C]Multiple Linear Regression - Regression Statistics[/C][/ROW]
[ROW][C]Multiple R[/C][C]0.999948080361548[/C][/ROW]
[ROW][C]R-squared[/C][C]0.999896163418744[/C][/ROW]
[ROW][C]Adjusted R-squared[/C][C]0.999863938272837[/C][/ROW]
[ROW][C]F-TEST (value)[/C][C]31028.4448767099[/C][/ROW]
[ROW][C]F-TEST (DF numerator)[/C][C]9[/C][/ROW]
[ROW][C]F-TEST (DF denominator)[/C][C]29[/C][/ROW]
[ROW][C]p-value[/C][C]0[/C][/ROW]
[ROW][C]Multiple Linear Regression - Residual Statistics[/C][/ROW]
[ROW][C]Residual Standard Deviation[/C][C]0.0164064833511368[/C][/ROW]
[ROW][C]Sum Squared Residuals[/C][C]0.00780600818258273[/C][/ROW]
[/TABLE]
Source: https://freestatistics.org/blog/index.php?pk=108568&T=3

Globally Unique Identifier (entire table): ba.freestatistics.org/blog/index.php?pk=108568&T=3

As an alternative you can also use a QR Code:  

The GUIDs for individual cells are displayed in the table below:

Multiple Linear Regression - Regression Statistics
Multiple R0.999948080361548
R-squared0.999896163418744
Adjusted R-squared0.999863938272837
F-TEST (value)31028.4448767099
F-TEST (DF numerator)9
F-TEST (DF denominator)29
p-value0
Multiple Linear Regression - Residual Statistics
Residual Standard Deviation0.0164064833511368
Sum Squared Residuals0.00780600818258273


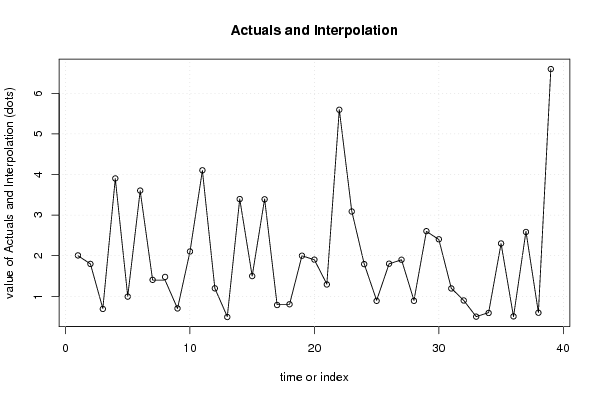
Multiple Linear Regression - Actuals, Interpolation, and Residuals
Time or IndexActualsInterpolationForecastResidualsPrediction Error
122.00813810991424-0.00813810991423942
21.81.798922655310160.00107734468984229
30.70.6898591206758390.0101408793241612
43.93.90400134367608-0.00400134367608236
510.9935247200744320.00647527992556754
63.63.60447042924575-0.00447042924574755
71.41.40641278447473-0.00641278447472853
81.41.47806008182583-0.078060081825828
90.70.702815786396743-0.00281578639674306
102.12.10464857935467-0.00464857935467079
114.14.10437505436573-0.00437505436573254
121.21.197547225752940.00245277424705923
130.50.4910559371674450.00894406283255459
143.43.395251606384790.00474839361520612
151.51.498769592866940.00123040713306228
163.43.389777898901980.0102221010980242
170.80.7867176783293880.0132823216706118
180.80.805190147431608-0.00519014743160751
1922.00037167664621-0.000371676646214936
201.91.9038925077626-0.00389250776259970
211.31.292362689044660.00763731095533718
225.65.594947421945930.00505257805407105
233.13.089816903619520.0101830963804768
241.81.793321695629160.00667830437084161
250.90.888782737575750.0112172624242495
261.81.80377949167953-0.00377949167952611
271.91.90183873519995-0.00183873519995174
280.90.8897360500891490.0102639499108511
292.62.60544845086842-0.00544845086842071
302.42.4050540636001-0.00505406360010157
311.21.19442764216430.00557235783569996
320.90.8983992583832260.00160074161677424
330.50.4997778207260670.00022217927393291
340.60.5908644255865440.00913557441345591
352.32.30244424522104-0.00244424522103632
360.50.506474536976637-0.00647453697663672
372.62.585196937567790.0148030624322094
380.60.5965104187758310.00348958122416917
396.66.597013538788290.00298646121170936

\begin{tabular}{lllllllll}
\hline
Multiple Linear Regression - Actuals, Interpolation, and Residuals \tabularnewline
Time or Index & Actuals & InterpolationForecast & ResidualsPrediction Error \tabularnewline
1 & 2 & 2.00813810991424 & -0.00813810991423942 \tabularnewline
2 & 1.8 & 1.79892265531016 & 0.00107734468984229 \tabularnewline
3 & 0.7 & 0.689859120675839 & 0.0101408793241612 \tabularnewline
4 & 3.9 & 3.90400134367608 & -0.00400134367608236 \tabularnewline
5 & 1 & 0.993524720074432 & 0.00647527992556754 \tabularnewline
6 & 3.6 & 3.60447042924575 & -0.00447042924574755 \tabularnewline
7 & 1.4 & 1.40641278447473 & -0.00641278447472853 \tabularnewline
8 & 1.4 & 1.47806008182583 & -0.078060081825828 \tabularnewline
9 & 0.7 & 0.702815786396743 & -0.00281578639674306 \tabularnewline
10 & 2.1 & 2.10464857935467 & -0.00464857935467079 \tabularnewline
11 & 4.1 & 4.10437505436573 & -0.00437505436573254 \tabularnewline
12 & 1.2 & 1.19754722575294 & 0.00245277424705923 \tabularnewline
13 & 0.5 & 0.491055937167445 & 0.00894406283255459 \tabularnewline
14 & 3.4 & 3.39525160638479 & 0.00474839361520612 \tabularnewline
15 & 1.5 & 1.49876959286694 & 0.00123040713306228 \tabularnewline
16 & 3.4 & 3.38977789890198 & 0.0102221010980242 \tabularnewline
17 & 0.8 & 0.786717678329388 & 0.0132823216706118 \tabularnewline
18 & 0.8 & 0.805190147431608 & -0.00519014743160751 \tabularnewline
19 & 2 & 2.00037167664621 & -0.000371676646214936 \tabularnewline
20 & 1.9 & 1.9038925077626 & -0.00389250776259970 \tabularnewline
21 & 1.3 & 1.29236268904466 & 0.00763731095533718 \tabularnewline
22 & 5.6 & 5.59494742194593 & 0.00505257805407105 \tabularnewline
23 & 3.1 & 3.08981690361952 & 0.0101830963804768 \tabularnewline
24 & 1.8 & 1.79332169562916 & 0.00667830437084161 \tabularnewline
25 & 0.9 & 0.88878273757575 & 0.0112172624242495 \tabularnewline
26 & 1.8 & 1.80377949167953 & -0.00377949167952611 \tabularnewline
27 & 1.9 & 1.90183873519995 & -0.00183873519995174 \tabularnewline
28 & 0.9 & 0.889736050089149 & 0.0102639499108511 \tabularnewline
29 & 2.6 & 2.60544845086842 & -0.00544845086842071 \tabularnewline
30 & 2.4 & 2.4050540636001 & -0.00505406360010157 \tabularnewline
31 & 1.2 & 1.1944276421643 & 0.00557235783569996 \tabularnewline
32 & 0.9 & 0.898399258383226 & 0.00160074161677424 \tabularnewline
33 & 0.5 & 0.499777820726067 & 0.00022217927393291 \tabularnewline
34 & 0.6 & 0.590864425586544 & 0.00913557441345591 \tabularnewline
35 & 2.3 & 2.30244424522104 & -0.00244424522103632 \tabularnewline
36 & 0.5 & 0.506474536976637 & -0.00647453697663672 \tabularnewline
37 & 2.6 & 2.58519693756779 & 0.0148030624322094 \tabularnewline
38 & 0.6 & 0.596510418775831 & 0.00348958122416917 \tabularnewline
39 & 6.6 & 6.59701353878829 & 0.00298646121170936 \tabularnewline
\hline
\end{tabular}
%Source: https://freestatistics.org/blog/index.php?pk=108568&T=4

[TABLE]
[ROW][C]Multiple Linear Regression - Actuals, Interpolation, and Residuals[/C][/ROW]
[ROW][C]Time or Index[/C][C]Actuals[/C][C]InterpolationForecast[/C][C]ResidualsPrediction Error[/C][/ROW]
[ROW][C]1[/C][C]2[/C][C]2.00813810991424[/C][C]-0.00813810991423942[/C][/ROW]
[ROW][C]2[/C][C]1.8[/C][C]1.79892265531016[/C][C]0.00107734468984229[/C][/ROW]
[ROW][C]3[/C][C]0.7[/C][C]0.689859120675839[/C][C]0.0101408793241612[/C][/ROW]
[ROW][C]4[/C][C]3.9[/C][C]3.90400134367608[/C][C]-0.00400134367608236[/C][/ROW]
[ROW][C]5[/C][C]1[/C][C]0.993524720074432[/C][C]0.00647527992556754[/C][/ROW]
[ROW][C]6[/C][C]3.6[/C][C]3.60447042924575[/C][C]-0.00447042924574755[/C][/ROW]
[ROW][C]7[/C][C]1.4[/C][C]1.40641278447473[/C][C]-0.00641278447472853[/C][/ROW]
[ROW][C]8[/C][C]1.4[/C][C]1.47806008182583[/C][C]-0.078060081825828[/C][/ROW]
[ROW][C]9[/C][C]0.7[/C][C]0.702815786396743[/C][C]-0.00281578639674306[/C][/ROW]
[ROW][C]10[/C][C]2.1[/C][C]2.10464857935467[/C][C]-0.00464857935467079[/C][/ROW]
[ROW][C]11[/C][C]4.1[/C][C]4.10437505436573[/C][C]-0.00437505436573254[/C][/ROW]
[ROW][C]12[/C][C]1.2[/C][C]1.19754722575294[/C][C]0.00245277424705923[/C][/ROW]
[ROW][C]13[/C][C]0.5[/C][C]0.491055937167445[/C][C]0.00894406283255459[/C][/ROW]
[ROW][C]14[/C][C]3.4[/C][C]3.39525160638479[/C][C]0.00474839361520612[/C][/ROW]
[ROW][C]15[/C][C]1.5[/C][C]1.49876959286694[/C][C]0.00123040713306228[/C][/ROW]
[ROW][C]16[/C][C]3.4[/C][C]3.38977789890198[/C][C]0.0102221010980242[/C][/ROW]
[ROW][C]17[/C][C]0.8[/C][C]0.786717678329388[/C][C]0.0132823216706118[/C][/ROW]
[ROW][C]18[/C][C]0.8[/C][C]0.805190147431608[/C][C]-0.00519014743160751[/C][/ROW]
[ROW][C]19[/C][C]2[/C][C]2.00037167664621[/C][C]-0.000371676646214936[/C][/ROW]
[ROW][C]20[/C][C]1.9[/C][C]1.9038925077626[/C][C]-0.00389250776259970[/C][/ROW]
[ROW][C]21[/C][C]1.3[/C][C]1.29236268904466[/C][C]0.00763731095533718[/C][/ROW]
[ROW][C]22[/C][C]5.6[/C][C]5.59494742194593[/C][C]0.00505257805407105[/C][/ROW]
[ROW][C]23[/C][C]3.1[/C][C]3.08981690361952[/C][C]0.0101830963804768[/C][/ROW]
[ROW][C]24[/C][C]1.8[/C][C]1.79332169562916[/C][C]0.00667830437084161[/C][/ROW]
[ROW][C]25[/C][C]0.9[/C][C]0.88878273757575[/C][C]0.0112172624242495[/C][/ROW]
[ROW][C]26[/C][C]1.8[/C][C]1.80377949167953[/C][C]-0.00377949167952611[/C][/ROW]
[ROW][C]27[/C][C]1.9[/C][C]1.90183873519995[/C][C]-0.00183873519995174[/C][/ROW]
[ROW][C]28[/C][C]0.9[/C][C]0.889736050089149[/C][C]0.0102639499108511[/C][/ROW]
[ROW][C]29[/C][C]2.6[/C][C]2.60544845086842[/C][C]-0.00544845086842071[/C][/ROW]
[ROW][C]30[/C][C]2.4[/C][C]2.4050540636001[/C][C]-0.00505406360010157[/C][/ROW]
[ROW][C]31[/C][C]1.2[/C][C]1.1944276421643[/C][C]0.00557235783569996[/C][/ROW]
[ROW][C]32[/C][C]0.9[/C][C]0.898399258383226[/C][C]0.00160074161677424[/C][/ROW]
[ROW][C]33[/C][C]0.5[/C][C]0.499777820726067[/C][C]0.00022217927393291[/C][/ROW]
[ROW][C]34[/C][C]0.6[/C][C]0.590864425586544[/C][C]0.00913557441345591[/C][/ROW]
[ROW][C]35[/C][C]2.3[/C][C]2.30244424522104[/C][C]-0.00244424522103632[/C][/ROW]
[ROW][C]36[/C][C]0.5[/C][C]0.506474536976637[/C][C]-0.00647453697663672[/C][/ROW]
[ROW][C]37[/C][C]2.6[/C][C]2.58519693756779[/C][C]0.0148030624322094[/C][/ROW]
[ROW][C]38[/C][C]0.6[/C][C]0.596510418775831[/C][C]0.00348958122416917[/C][/ROW]
[ROW][C]39[/C][C]6.6[/C][C]6.59701353878829[/C][C]0.00298646121170936[/C][/ROW]
[/TABLE]
Source: https://freestatistics.org/blog/index.php?pk=108568&T=4

Globally Unique Identifier (entire table): ba.freestatistics.org/blog/index.php?pk=108568&T=4

As an alternative you can also use a QR Code:  

The GUIDs for individual cells are displayed in the table below:

Multiple Linear Regression - Actuals, Interpolation, and Residuals
Time or IndexActualsInterpolationForecastResidualsPrediction Error
122.00813810991424-0.00813810991423942
21.81.798922655310160.00107734468984229
30.70.6898591206758390.0101408793241612
43.93.90400134367608-0.00400134367608236
510.9935247200744320.00647527992556754
63.63.60447042924575-0.00447042924574755
71.41.40641278447473-0.00641278447472853
81.41.47806008182583-0.078060081825828
90.70.702815786396743-0.00281578639674306
102.12.10464857935467-0.00464857935467079
114.14.10437505436573-0.00437505436573254
121.21.197547225752940.00245277424705923
130.50.4910559371674450.00894406283255459
143.43.395251606384790.00474839361520612
151.51.498769592866940.00123040713306228
163.43.389777898901980.0102221010980242
170.80.7867176783293880.0132823216706118
180.80.805190147431608-0.00519014743160751
1922.00037167664621-0.000371676646214936
201.91.9038925077626-0.00389250776259970
211.31.292362689044660.00763731095533718
225.65.594947421945930.00505257805407105
233.13.089816903619520.0101830963804768
241.81.793321695629160.00667830437084161
250.90.888782737575750.0112172624242495
261.81.80377949167953-0.00377949167952611
271.91.90183873519995-0.00183873519995174
280.90.8897360500891490.0102639499108511
292.62.60544845086842-0.00544845086842071
302.42.4050540636001-0.00505406360010157
311.21.19442764216430.00557235783569996
320.90.8983992583832260.00160074161677424
330.50.4997778207260670.00022217927393291
340.60.5908644255865440.00913557441345591
352.32.30244424522104-0.00244424522103632
360.50.506474536976637-0.00647453697663672
372.62.585196937567790.0148030624322094
380.60.5965104187758310.00348958122416917
396.66.597013538788290.00298646121170936


Goldfeld-Quandt test for Heteroskedasticity
p-valuesAlternative Hypothesis
breakpoint indexgreater2-sidedless
1311.33823399697445e-1886.69116998487225e-189
1411.49178728325363e-1957.45893641626815e-196
1511.73212178198017e-1828.66060890990086e-183
1611.49221949467581e-1707.46109747337905e-171
1714.90040980982609e-1582.45020490491305e-158
1816.40657856975624e-1453.20328928487812e-145
1911.28207222514613e-1316.41036112573065e-132
2017.13482345630461e-1183.56741172815231e-118
2113.46682432340043e-1041.73341216170022e-104
2211.53132999949218e-917.65664999746092e-92
2319.62301778837544e-794.81150889418772e-79
2416.53081454031816e-663.26540727015908e-66
2513.36146313227097e-521.68073156613548e-52
2614.6541564608213e-402.32707823041065e-40

\begin{tabular}{lllllllll}
\hline
Goldfeld-Quandt test for Heteroskedasticity \tabularnewline
p-values & Alternative Hypothesis \tabularnewline
breakpoint index & greater & 2-sided & less \tabularnewline
13 & 1 & 1.33823399697445e-188 & 6.69116998487225e-189 \tabularnewline
14 & 1 & 1.49178728325363e-195 & 7.45893641626815e-196 \tabularnewline
15 & 1 & 1.73212178198017e-182 & 8.66060890990086e-183 \tabularnewline
16 & 1 & 1.49221949467581e-170 & 7.46109747337905e-171 \tabularnewline
17 & 1 & 4.90040980982609e-158 & 2.45020490491305e-158 \tabularnewline
18 & 1 & 6.40657856975624e-145 & 3.20328928487812e-145 \tabularnewline
19 & 1 & 1.28207222514613e-131 & 6.41036112573065e-132 \tabularnewline
20 & 1 & 7.13482345630461e-118 & 3.56741172815231e-118 \tabularnewline
21 & 1 & 3.46682432340043e-104 & 1.73341216170022e-104 \tabularnewline
22 & 1 & 1.53132999949218e-91 & 7.65664999746092e-92 \tabularnewline
23 & 1 & 9.62301778837544e-79 & 4.81150889418772e-79 \tabularnewline
24 & 1 & 6.53081454031816e-66 & 3.26540727015908e-66 \tabularnewline
25 & 1 & 3.36146313227097e-52 & 1.68073156613548e-52 \tabularnewline
26 & 1 & 4.6541564608213e-40 & 2.32707823041065e-40 \tabularnewline
\hline
\end{tabular}
%Source: https://freestatistics.org/blog/index.php?pk=108568&T=5

[TABLE]
[ROW][C]Goldfeld-Quandt test for Heteroskedasticity[/C][/ROW]
[ROW][C]p-values[/C][C]Alternative Hypothesis[/C][/ROW]
[ROW][C]breakpoint index[/C][C]greater[/C][C]2-sided[/C][C]less[/C][/ROW]
[ROW][C]13[/C][C]1[/C][C]1.33823399697445e-188[/C][C]6.69116998487225e-189[/C][/ROW]
[ROW][C]14[/C][C]1[/C][C]1.49178728325363e-195[/C][C]7.45893641626815e-196[/C][/ROW]
[ROW][C]15[/C][C]1[/C][C]1.73212178198017e-182[/C][C]8.66060890990086e-183[/C][/ROW]
[ROW][C]16[/C][C]1[/C][C]1.49221949467581e-170[/C][C]7.46109747337905e-171[/C][/ROW]
[ROW][C]17[/C][C]1[/C][C]4.90040980982609e-158[/C][C]2.45020490491305e-158[/C][/ROW]
[ROW][C]18[/C][C]1[/C][C]6.40657856975624e-145[/C][C]3.20328928487812e-145[/C][/ROW]
[ROW][C]19[/C][C]1[/C][C]1.28207222514613e-131[/C][C]6.41036112573065e-132[/C][/ROW]
[ROW][C]20[/C][C]1[/C][C]7.13482345630461e-118[/C][C]3.56741172815231e-118[/C][/ROW]
[ROW][C]21[/C][C]1[/C][C]3.46682432340043e-104[/C][C]1.73341216170022e-104[/C][/ROW]
[ROW][C]22[/C][C]1[/C][C]1.53132999949218e-91[/C][C]7.65664999746092e-92[/C][/ROW]
[ROW][C]23[/C][C]1[/C][C]9.62301778837544e-79[/C][C]4.81150889418772e-79[/C][/ROW]
[ROW][C]24[/C][C]1[/C][C]6.53081454031816e-66[/C][C]3.26540727015908e-66[/C][/ROW]
[ROW][C]25[/C][C]1[/C][C]3.36146313227097e-52[/C][C]1.68073156613548e-52[/C][/ROW]
[ROW][C]26[/C][C]1[/C][C]4.6541564608213e-40[/C][C]2.32707823041065e-40[/C][/ROW]
[/TABLE]
Source: https://freestatistics.org/blog/index.php?pk=108568&T=5

Globally Unique Identifier (entire table): ba.freestatistics.org/blog/index.php?pk=108568&T=5

As an alternative you can also use a QR Code:  

The GUIDs for individual cells are displayed in the table below:

Goldfeld-Quandt test for Heteroskedasticity
p-valuesAlternative Hypothesis
breakpoint indexgreater2-sidedless
1311.33823399697445e-1886.69116998487225e-189
1411.49178728325363e-1957.45893641626815e-196
1511.73212178198017e-1828.66060890990086e-183
1611.49221949467581e-1707.46109747337905e-171
1714.90040980982609e-1582.45020490491305e-158
1816.40657856975624e-1453.20328928487812e-145
1911.28207222514613e-1316.41036112573065e-132
2017.13482345630461e-1183.56741172815231e-118
2113.46682432340043e-1041.73341216170022e-104
2211.53132999949218e-917.65664999746092e-92
2319.62301778837544e-794.81150889418772e-79
2416.53081454031816e-663.26540727015908e-66
2513.36146313227097e-521.68073156613548e-52
2614.6541564608213e-402.32707823041065e-40


Meta Analysis of Goldfeld-Quandt test for Heteroskedasticity
Description# significant tests% significant testsOK/NOK
1% type I error level141NOK
5% type I error level141NOK
10% type I error level141NOK

\begin{tabular}{lllllllll}
\hline
Meta Analysis of Goldfeld-Quandt test for Heteroskedasticity \tabularnewline
Description & # significant tests & % significant tests & OK/NOK \tabularnewline
1% type I error level & 14 & 1 & NOK \tabularnewline
5% type I error level & 14 & 1 & NOK \tabularnewline
10% type I error level & 14 & 1 & NOK \tabularnewline
\hline
\end{tabular}
%Source: https://freestatistics.org/blog/index.php?pk=108568&T=6

[TABLE]
[ROW][C]Meta Analysis of Goldfeld-Quandt test for Heteroskedasticity[/C][/ROW]
[ROW][C]Description[/C][C]# significant tests[/C][C]% significant tests[/C][C]OK/NOK[/C][/ROW]
[ROW][C]1% type I error level[/C][C]14[/C][C]1[/C][C]NOK[/C][/ROW]
[ROW][C]5% type I error level[/C][C]14[/C][C]1[/C][C]NOK[/C][/ROW]
[ROW][C]10% type I error level[/C][C]14[/C][C]1[/C][C]NOK[/C][/ROW]
[/TABLE]
Source: https://freestatistics.org/blog/index.php?pk=108568&T=6

Globally Unique Identifier (entire table): ba.freestatistics.org/blog/index.php?pk=108568&T=6

As an alternative you can also use a QR Code:  

The GUIDs for individual cells are displayed in the table below:

Meta Analysis of Goldfeld-Quandt test for Heteroskedasticity
Description# significant tests% significant testsOK/NOK
1% type I error level141NOK
5% type I error level141NOK
10% type I error level141NOK


Parameters (Session):
par1 = 4 ; par2 = Do not include Seasonal Dummies ; par3 = No Linear Trend ;
Parameters (R input):
par1 = 4 ; par2 = Do not include Seasonal Dummies ; par3 = No Linear Trend ;
R code (references can be found in the software module):
library(lattice)
library(lmtest)
n25 <- 25 #minimum number of obs. for Goldfeld-Quandt test
par1 <- as.numeric(par1)
x <- t(y)
k <- length(x[1,])
n <- length(x[,1])
x1 <- cbind(x[,par1], x[,1:k!=par1])
mycolnames <- c(colnames(x)[par1], colnames(x)[1:k!=par1])
colnames(x1) <- mycolnames #colnames(x)[par1]
x <- x1
if (par3 == 'First Differences'){
x2 <- array(0, dim=c(n-1,k), dimnames=list(1:(n-1), paste('(1-B)',colnames(x),sep='')))
for (i in 1:n-1) {
for (j in 1:k) {
x2[i,j] <- x[i+1,j] - x[i,j]
}
}
x <- x2
}
if (par2 == 'Include Monthly Dummies'){
x2 <- array(0, dim=c(n,11), dimnames=list(1:n, paste('M', seq(1:11), sep ='')))
for (i in 1:11){
x2[seq(i,n,12),i] <- 1
}
x <- cbind(x, x2)
}
if (par2 == 'Include Quarterly Dummies'){
x2 <- array(0, dim=c(n,3), dimnames=list(1:n, paste('Q', seq(1:3), sep ='')))
for (i in 1:3){
x2[seq(i,n,4),i] <- 1
}
x <- cbind(x, x2)
}
k <- length(x[1,])
if (par3 == 'Linear Trend'){
x <- cbind(x, c(1:n))
colnames(x)[k+1] <- 't'
}
x
k <- length(x[1,])
df <- as.data.frame(x)
(mylm <- lm(df))
(mysum <- summary(mylm))
if (n > n25) {
kp3 <- k + 3
nmkm3 <- n - k - 3
gqarr <- array(NA, dim=c(nmkm3-kp3+1,3))
numgqtests <- 0
numsignificant1 <- 0
numsignificant5 <- 0
numsignificant10 <- 0
for (mypoint in kp3:nmkm3) {
j <- 0
numgqtests <- numgqtests + 1
for (myalt in c('greater', 'two.sided', 'less')) {
j <- j + 1
gqarr[mypoint-kp3+1,j] <- gqtest(mylm, point=mypoint, alternative=myalt)$p.value
}
if (gqarr[mypoint-kp3+1,2] < 0.01) numsignificant1 <- numsignificant1 + 1
if (gqarr[mypoint-kp3+1,2] < 0.05) numsignificant5 <- numsignificant5 + 1
if (gqarr[mypoint-kp3+1,2] < 0.10) numsignificant10 <- numsignificant10 + 1
}
gqarr
}
bitmap(file='test0.png')
plot(x[,1], type='l', main='Actuals and Interpolation', ylab='value of Actuals and Interpolation (dots)', xlab='time or index')
points(x[,1]-mysum$resid)
grid()
dev.off()
bitmap(file='test1.png')
plot(mysum$resid, type='b', pch=19, main='Residuals', ylab='value of Residuals', xlab='time or index')
grid()
dev.off()
bitmap(file='test2.png')
hist(mysum$resid, main='Residual Histogram', xlab='values of Residuals')
grid()
dev.off()
bitmap(file='test3.png')
densityplot(~mysum$resid,col='black',main='Residual Density Plot', xlab='values of Residuals')
dev.off()
bitmap(file='test4.png')
qqnorm(mysum$resid, main='Residual Normal Q-Q Plot')
qqline(mysum$resid)
grid()
dev.off()
(myerror <- as.ts(mysum$resid))
bitmap(file='test5.png')
dum <- cbind(lag(myerror,k=1),myerror)
dum
dum1 <- dum[2:length(myerror),]
dum1
z <- as.data.frame(dum1)
z
plot(z,main=paste('Residual Lag plot, lowess, and regression line'), ylab='values of Residuals', xlab='lagged values of Residuals')
lines(lowess(z))
abline(lm(z))
grid()
dev.off()
bitmap(file='test6.png')
acf(mysum$resid, lag.max=length(mysum$resid)/2, main='Residual Autocorrelation Function')
grid()
dev.off()
bitmap(file='test7.png')
pacf(mysum$resid, lag.max=length(mysum$resid)/2, main='Residual Partial Autocorrelation Function')
grid()
dev.off()
bitmap(file='test8.png')
opar <- par(mfrow = c(2,2), oma = c(0, 0, 1.1, 0))
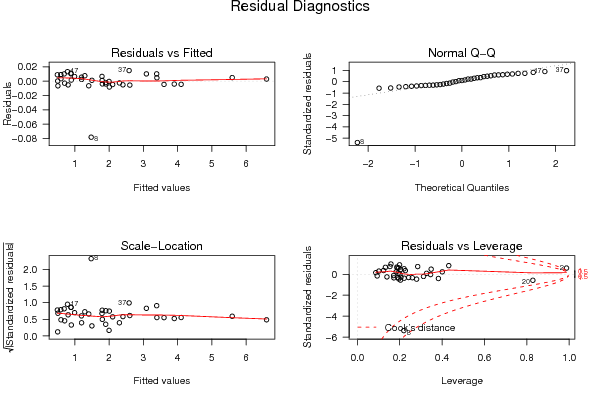
plot(mylm, las = 1, sub='Residual Diagnostics')
par(opar)
dev.off()
if (n > n25) {
bitmap(file='test9.png')
plot(kp3:nmkm3,gqarr[,2], main='Goldfeld-Quandt test',ylab='2-sided p-value',xlab='breakpoint')
grid()
dev.off()
}
load(file='createtable')
a<-table.start()
a<-table.row.start(a)
a<-table.element(a, 'Multiple Linear Regression - Estimated Regression Equation', 1, TRUE)
a<-table.row.end(a)
myeq <- colnames(x)[1]
myeq <- paste(myeq, '[t] = ', sep='')
for (i in 1:k){
if (mysum$coefficients[i,1] > 0) myeq <- paste(myeq, '+', '')
myeq <- paste(myeq, mysum$coefficients[i,1], sep=' ')
if (rownames(mysum$coefficients)[i] != '(Intercept)') {
myeq <- paste(myeq, rownames(mysum$coefficients)[i], sep='')
if (rownames(mysum$coefficients)[i] != 't') myeq <- paste(myeq, '[t]', sep='')
}
}
myeq <- paste(myeq, ' + e[t]')
a<-table.row.start(a)
a<-table.element(a, myeq)
a<-table.row.end(a)
a<-table.end(a)
table.save(a,file='mytable1.tab')
a<-table.start()
a<-table.row.start(a)
a<-table.element(a,hyperlink('ols1.htm','Multiple Linear Regression - Ordinary Least Squares',''), 6, TRUE)
a<-table.row.end(a)
a<-table.row.start(a)
a<-table.element(a,'Variable',header=TRUE)
a<-table.element(a,'Parameter',header=TRUE)
a<-table.element(a,'S.D.',header=TRUE)
a<-table.element(a,'T-STAT
H0: parameter = 0',header=TRUE)
a<-table.element(a,'2-tail p-value',header=TRUE)
a<-table.element(a,'1-tail p-value',header=TRUE)
a<-table.row.end(a)
for (i in 1:k){
a<-table.row.start(a)
a<-table.element(a,rownames(mysum$coefficients)[i],header=TRUE)
a<-table.element(a,mysum$coefficients[i,1])
a<-table.element(a, round(mysum$coefficients[i,2],6))
a<-table.element(a, round(mysum$coefficients[i,3],4))
a<-table.element(a, round(mysum$coefficients[i,4],6))
a<-table.element(a, round(mysum$coefficients[i,4]/2,6))
a<-table.row.end(a)
}
a<-table.end(a)
table.save(a,file='mytable2.tab')
a<-table.start()
a<-table.row.start(a)
a<-table.element(a, 'Multiple Linear Regression - Regression Statistics', 2, TRUE)
a<-table.row.end(a)
a<-table.row.start(a)
a<-table.element(a, 'Multiple R',1,TRUE)
a<-table.element(a, sqrt(mysum$r.squared))
a<-table.row.end(a)
a<-table.row.start(a)
a<-table.element(a, 'R-squared',1,TRUE)
a<-table.element(a, mysum$r.squared)
a<-table.row.end(a)
a<-table.row.start(a)
a<-table.element(a, 'Adjusted R-squared',1,TRUE)
a<-table.element(a, mysum$adj.r.squared)
a<-table.row.end(a)
a<-table.row.start(a)
a<-table.element(a, 'F-TEST (value)',1,TRUE)
a<-table.element(a, mysum$fstatistic[1])
a<-table.row.end(a)
a<-table.row.start(a)
a<-table.element(a, 'F-TEST (DF numerator)',1,TRUE)
a<-table.element(a, mysum$fstatistic[2])
a<-table.row.end(a)
a<-table.row.start(a)
a<-table.element(a, 'F-TEST (DF denominator)',1,TRUE)
a<-table.element(a, mysum$fstatistic[3])
a<-table.row.end(a)
a<-table.row.start(a)
a<-table.element(a, 'p-value',1,TRUE)
a<-table.element(a, 1-pf(mysum$fstatistic[1],mysum$fstatistic[2],mysum$fstatistic[3]))
a<-table.row.end(a)
a<-table.row.start(a)
a<-table.element(a, 'Multiple Linear Regression - Residual Statistics', 2, TRUE)
a<-table.row.end(a)
a<-table.row.start(a)
a<-table.element(a, 'Residual Standard Deviation',1,TRUE)
a<-table.element(a, mysum$sigma)
a<-table.row.end(a)
a<-table.row.start(a)
a<-table.element(a, 'Sum Squared Residuals',1,TRUE)
a<-table.element(a, sum(myerror*myerror))
a<-table.row.end(a)
a<-table.end(a)
table.save(a,file='mytable3.tab')
a<-table.start()
a<-table.row.start(a)
a<-table.element(a, 'Multiple Linear Regression - Actuals, Interpolation, and Residuals', 4, TRUE)
a<-table.row.end(a)
a<-table.row.start(a)
a<-table.element(a, 'Time or Index', 1, TRUE)
a<-table.element(a, 'Actuals', 1, TRUE)
a<-table.element(a, 'Interpolation
Forecast', 1, TRUE)
a<-table.element(a, 'Residuals
Prediction Error', 1, TRUE)
a<-table.row.end(a)
for (i in 1:n) {
a<-table.row.start(a)
a<-table.element(a,i, 1, TRUE)
a<-table.element(a,x[i])
a<-table.element(a,x[i]-mysum$resid[i])
a<-table.element(a,mysum$resid[i])
a<-table.row.end(a)
}
a<-table.end(a)
table.save(a,file='mytable4.tab')
if (n > n25) {
a<-table.start()
a<-table.row.start(a)
a<-table.element(a,'Goldfeld-Quandt test for Heteroskedasticity',4,TRUE)
a<-table.row.end(a)
a<-table.row.start(a)
a<-table.element(a,'p-values',header=TRUE)
a<-table.element(a,'Alternative Hypothesis',3,header=TRUE)
a<-table.row.end(a)
a<-table.row.start(a)
a<-table.element(a,'breakpoint index',header=TRUE)
a<-table.element(a,'greater',header=TRUE)
a<-table.element(a,'2-sided',header=TRUE)
a<-table.element(a,'less',header=TRUE)
a<-table.row.end(a)
for (mypoint in kp3:nmkm3) {
a<-table.row.start(a)
a<-table.element(a,mypoint,header=TRUE)
a<-table.element(a,gqarr[mypoint-kp3+1,1])
a<-table.element(a,gqarr[mypoint-kp3+1,2])
a<-table.element(a,gqarr[mypoint-kp3+1,3])
a<-table.row.end(a)
}
a<-table.end(a)
table.save(a,file='mytable5.tab')
a<-table.start()
a<-table.row.start(a)
a<-table.element(a,'Meta Analysis of Goldfeld-Quandt test for Heteroskedasticity',4,TRUE)
a<-table.row.end(a)
a<-table.row.start(a)
a<-table.element(a,'Description',header=TRUE)
a<-table.element(a,'# significant tests',header=TRUE)
a<-table.element(a,'% significant tests',header=TRUE)
a<-table.element(a,'OK/NOK',header=TRUE)
a<-table.row.end(a)
a<-table.row.start(a)
a<-table.element(a,'1% type I error level',header=TRUE)
a<-table.element(a,numsignificant1)
a<-table.element(a,numsignificant1/numgqtests)
if (numsignificant1/numgqtests < 0.01) dum <- 'OK' else dum <- 'NOK'
a<-table.element(a,dum)
a<-table.row.end(a)
a<-table.row.start(a)
a<-table.element(a,'5% type I error level',header=TRUE)
a<-table.element(a,numsignificant5)
a<-table.element(a,numsignificant5/numgqtests)
if (numsignificant5/numgqtests < 0.05) dum <- 'OK' else dum <- 'NOK'
a<-table.element(a,dum)
a<-table.row.end(a)
a<-table.row.start(a)
a<-table.element(a,'10% type I error level',header=TRUE)
a<-table.element(a,numsignificant10)
a<-table.element(a,numsignificant10/numgqtests)
if (numsignificant10/numgqtests < 0.1) dum <- 'OK' else dum <- 'NOK'
a<-table.element(a,dum)
a<-table.row.end(a)
a<-table.end(a)
table.save(a,file='mytable6.tab')
}