| Multiple Linear Regression - Estimated Regression Equation |
| SWS[t] = + 13.6190137439715 -0.0151815119416232tg[t] -1.05187850762346`D `[t] + e[t] |
| Multiple Linear Regression - Ordinary Least Squares | |||||
| Variable | Parameter | S.D. | T-STAT H0: parameter = 0 | 2-tail p-value | 1-tail p-value |
| (Intercept) | 13.6190137439715 | 1.003953 | 13.5654 | 0 | 0 |
| tg | -0.0151815119416232 | 0.003795 | -4.0008 | 0.000301 | 0.00015 |
| `D ` | -1.05187850762346 | 0.34547 | -3.0448 | 0.004336 | 0.002168 |
| Multiple Linear Regression - Regression Statistics | |
| Multiple R | 0.715033253662538 |
| R-squared | 0.511272553843236 |
| Adjusted R-squared | 0.484121029056749 |
| F-TEST (value) | 18.8303440732615 |
| F-TEST (DF numerator) | 2 |
| F-TEST (DF denominator) | 36 |
| p-value | 2.530469586981e-06 |
| Multiple Linear Regression - Residual Statistics | |
| Residual Standard Deviation | 2.85022542084357 |
| Sum Squared Residuals | 292.456258186425 |
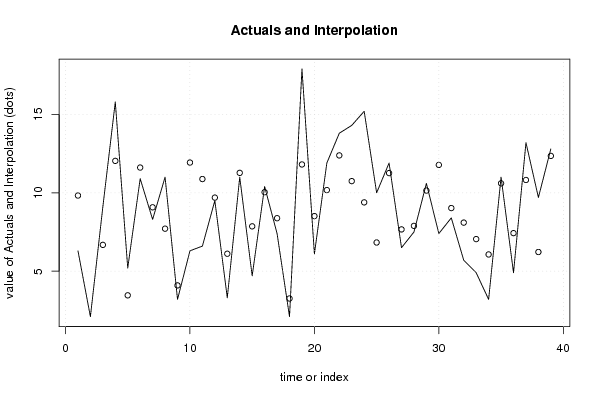
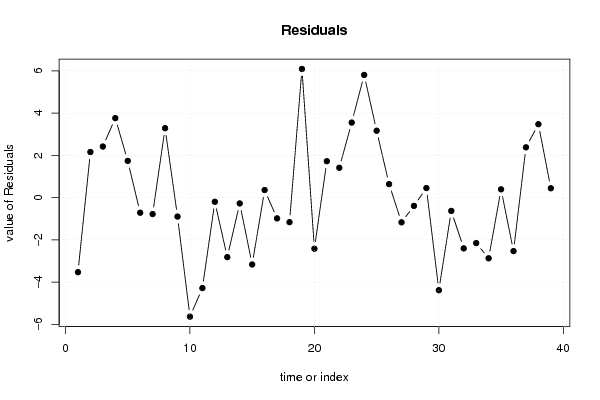
| Multiple Linear Regression - Actuals, Interpolation, and Residuals | |||
| Time or Index | Actuals | Interpolation Forecast | Residuals Prediction Error |
| 1 | 6.3 | 9.82575471955296 | -3.52575471955296 |
| 2 | 2.1 | -0.0617637380951814 | 2.16176373809518 |
| 3 | 9.1 | 6.6788275639855 | 2.42117243601450 |
| 4 | 15.8 | 12.0357823183913 | 3.76421768160875 |
| 5 | 5.2 | 3.46034703236139 | 1.73965296763861 |
| 6 | 10.9 | 11.6106999840258 | -0.710699984025806 |
| 7 | 8.3 | 9.07538748977474 | -0.775387489774737 |
| 8 | 11 | 7.71117037601588 | 3.28882962398412 |
| 9 | 3.2 | 4.0936163502581 | -0.8936163502581 |
| 10 | 6.3 | 11.9295117347999 | -5.62951173479989 |
| 11 | 6.6 | 10.8776332271764 | -4.27763322717643 |
| 12 | 9.5 | 9.69347529572982 | -0.193475295729822 |
| 13 | 3.3 | 6.11275743849398 | -2.81275743849398 |
| 14 | 11 | 11.2723525376586 | -0.272352537658630 |
| 15 | 4.7 | 7.86086653444489 | -3.16086653444489 |
| 16 | 10.4 | 10.0382958867357 | 0.361704113264312 |
| 17 | 7.4 | 8.3791569014473 | -0.979156901447297 |
| 18 | 2.1 | 3.25863319346883 | -1.15863319346883 |
| 19 | 17.9 | 11.8080596392669 | 6.09194036073309 |
| 20 | 6.1 | 8.51367154793468 | -2.41367154793468 |
| 21 | 11.9 | 10.1749294942103 | 1.72507050578970 |
| 22 | 13.8 | 12.3849570930486 | 1.41504290695141 |
| 23 | 14.3 | 10.7453538033533 | 3.55464619664671 |
| 24 | 15.2 | 9.38984505689736 | 5.81015494310264 |
| 25 | 10 | 6.83064268340174 | 3.16935731659826 |
| 26 | 11.9 | 11.257171025717 | 0.642828974282993 |
| 27 | 6.5 | 7.66562584019101 | -1.16562584019101 |
| 28 | 7.5 | 7.88899433566389 | -0.38899433566389 |
| 29 | 10.6 | 10.1445664703271 | 0.455433529672949 |
| 30 | 7.4 | 11.7776966153837 | -4.37769661538366 |
| 31 | 8.4 | 9.0254887702984 | -0.625488770298402 |
| 32 | 5.7 | 8.09941654185939 | -2.39941654185939 |
| 33 | 4.9 | 7.04753803423593 | -2.14753803423593 |
| 34 | 3.2 | 6.06721290266911 | -2.86721290266911 |
| 35 | 11 | 10.6043660122272 | 0.395633987772789 |
| 36 | 4.9 | 7.4270758327765 | -2.52707583277650 |
| 37 | 13.2 | 10.8169071794099 | 2.38309282059006 |
| 38 | 9.7 | 6.22338220573681 | 3.47661779426319 |
| 39 | 12.8 | 12.3545940691653 | 0.44540593083466 |
| Goldfeld-Quandt test for Heteroskedasticity | |||
| p-values | Alternative Hypothesis | ||
| breakpoint index | greater | 2-sided | less |
| 6 | 0.666188370268304 | 0.667623259463391 | 0.333811629731696 |
| 7 | 0.578065476985546 | 0.843869046028907 | 0.421934523014454 |
| 8 | 0.544175652394894 | 0.911648695210211 | 0.455824347605106 |
| 9 | 0.479376343210169 | 0.958752686420339 | 0.520623656789831 |
| 10 | 0.752206607826331 | 0.495586784347338 | 0.247793392173669 |
| 11 | 0.812605638812776 | 0.374788722374449 | 0.187394361187224 |
| 12 | 0.730502053218088 | 0.538995893563823 | 0.269497946781912 |
| 13 | 0.71439949522259 | 0.57120100955482 | 0.28560050477741 |
| 14 | 0.637363223588319 | 0.725273552823363 | 0.362636776411681 |
| 15 | 0.629828212009943 | 0.740343575980114 | 0.370171787990057 |
| 16 | 0.542986083893007 | 0.914027832213986 | 0.457013916106993 |
| 17 | 0.4532914433173 | 0.9065828866346 | 0.5467085566827 |
| 18 | 0.379146768225224 | 0.758293536450448 | 0.620853231774776 |
| 19 | 0.716235668510565 | 0.56752866297887 | 0.283764331489435 |
| 20 | 0.674222966750972 | 0.651554066498055 | 0.325777033249028 |
| 21 | 0.609872734562714 | 0.780254530874573 | 0.390127265437286 |
| 22 | 0.529357356080156 | 0.941285287839687 | 0.470642643919844 |
| 23 | 0.563985013793122 | 0.872029972413756 | 0.436014986206878 |
| 24 | 0.851798114116521 | 0.296403771766957 | 0.148201885883479 |
| 25 | 0.891049543906936 | 0.217900912186127 | 0.108950456093064 |
| 26 | 0.83346300411373 | 0.333073991772541 | 0.166536995886271 |
| 27 | 0.760306350650952 | 0.479387298698095 | 0.239693649349048 |
| 28 | 0.673849478094931 | 0.652301043810137 | 0.326150521905069 |
| 29 | 0.554968382502564 | 0.890063234994872 | 0.445031617497436 |
| 30 | 0.709834020685013 | 0.580331958629975 | 0.290165979314987 |
| 31 | 0.5766533218953 | 0.8466933562094 | 0.4233466781047 |
| 32 | 0.458770906747234 | 0.917541813494469 | 0.541229093252766 |
| 33 | 0.352521059206817 | 0.705042118413634 | 0.647478940793183 |
| Meta Analysis of Goldfeld-Quandt test for Heteroskedasticity | |||
| Description | # significant tests | % significant tests | OK/NOK |
| 1% type I error level | 0 | 0 | OK |
| 5% type I error level | 0 | 0 | OK |
| 10% type I error level | 0 | 0 | OK |