| Multiple Linear Regression - Estimated Regression Equation |
| SWS[t] = + 13.9512502074560 -2.11014599789446Wbr[t] -0.932319529047832D[t] + e[t] |
| Multiple Linear Regression - Ordinary Least Squares | |||||
| Variable | Parameter | S.D. | T-STAT H0: parameter = 0 | 2-tail p-value | 1-tail p-value |
| (Intercept) | 13.9512502074560 | 0.969066 | 14.3966 | 0 | 0 |
| Wbr | -2.11014599789446 | 0.456929 | -4.6181 | 4.8e-05 | 2.4e-05 |
| D | -0.932319529047832 | 0.334717 | -2.7854 | 0.008473 | 0.004237 |
| Multiple Linear Regression - Regression Statistics | |
| Multiple R | 0.746078597438942 |
| R-squared | 0.556633273556459 |
| Adjusted R-squared | 0.532001788754040 |
| F-TEST (value) | 22.5984457705853 |
| F-TEST (DF numerator) | 2 |
| F-TEST (DF denominator) | 36 |
| p-value | 4.38263952684537e-07 |
| Multiple Linear Regression - Residual Statistics | |
| Residual Standard Deviation | 2.71473469481662 |
| Sum Squared Residuals | 265.312240676679 |
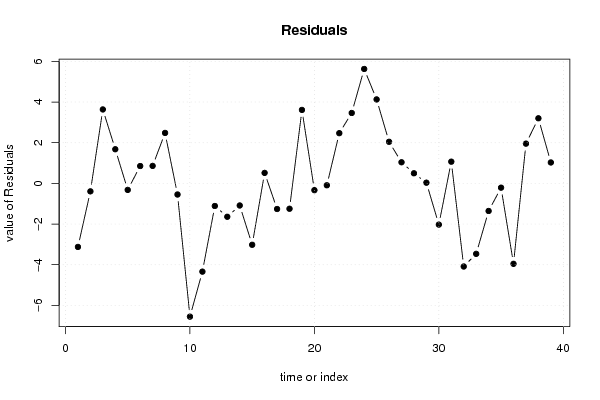
| Multiple Linear Regression - Actuals, Interpolation, and Residuals | |||
| Time or Index | Actuals | Interpolation Forecast | Residuals Prediction Error |
| 1 | 6.3 | 9.42493426366342 | -3.12493426366342 |
| 2 | 2.1 | 2.49242083774495 | -0.392420837744949 |
| 3 | 9.1 | 5.46556700677052 | 3.63443299322948 |
| 4 | 15.8 | 14.1222811695540 | 1.67771883044604 |
| 5 | 5.2 | 5.52080587694661 | -0.320805876946606 |
| 6 | 10.9 | 10.0473387521883 | 0.852661247811655 |
| 7 | 8.3 | 7.44085959352332 | 0.859140406476678 |
| 8 | 11 | 8.52081464554588 | 2.47918535445412 |
| 9 | 3.2 | 3.74769094768308 | -0.54769094768308 |
| 10 | 6.3 | 12.8518466890529 | -6.55184668905294 |
| 11 | 6.6 | 10.9385481437314 | -4.33854814373143 |
| 12 | 9.5 | 10.6116823927714 | -1.11168239277143 |
| 13 | 3.3 | 4.94127926227104 | -1.64127926227104 |
| 14 | 11 | 12.0866111493603 | -1.08661114936030 |
| 15 | 4.7 | 7.71849005701629 | -3.01849005701629 |
| 16 | 10.4 | 9.88385713981144 | 0.516142860188555 |
| 17 | 7.4 | 8.6596987260809 | -1.25969872608091 |
| 18 | 2.1 | 3.34697225391671 | -1.24697225391671 |
| 19 | 17.9 | 14.2893651589092 | 3.61063484109084 |
| 20 | 6.1 | 6.43406408677469 | -0.33406408677469 |
| 21 | 11.9 | 11.9940031377059 | -0.0940031377059086 |
| 22 | 13.8 | 11.3322054179810 | 2.46779458201898 |
| 23 | 14.3 | 10.8382556776658 | 3.46174432233418 |
| 24 | 15.2 | 9.57483748065868 | 5.62516251934132 |
| 25 | 10 | 5.87359879131887 | 4.12640120868113 |
| 26 | 11.9 | 9.8563876078674 | 2.04361239213259 |
| 27 | 6.5 | 5.46301784067747 | 1.03698215932253 |
| 28 | 7.5 | 7.00481734713263 | 0.495182652867368 |
| 29 | 10.6 | 10.5660808247637 | 0.0339191752363480 |
| 30 | 7.4 | 9.4265536961744 | -2.02655369617441 |
| 31 | 8.4 | 7.33276234215124 | 1.06723765784876 |
| 32 | 5.7 | 9.78675224129893 | -4.08675224129893 |
| 33 | 4.9 | 8.36421586662938 | -3.46421586662938 |
| 34 | 3.2 | 4.55651479999445 | -1.35651479999445 |
| 35 | 11 | 11.2109567998452 | -0.210956799845237 |
| 36 | 4.9 | 8.8544327122511 | -3.9544327122511 |
| 37 | 13.2 | 11.2468996319669 | 1.95310036803313 |
| 38 | 9.7 | 6.50088156715048 | 3.19911843284952 |
| 39 | 12.8 | 11.7716980634500 | 1.02830193654998 |
| Goldfeld-Quandt test for Heteroskedasticity | |||
| p-values | Alternative Hypothesis | ||
| breakpoint index | greater | 2-sided | less |
| 6 | 0.61836933151373 | 0.76326133697254 | 0.38163066848627 |
| 7 | 0.449033136853706 | 0.898066273707411 | 0.550966863146294 |
| 8 | 0.383010472087742 | 0.766020944175483 | 0.616989527912258 |
| 9 | 0.269011802427911 | 0.538023604855822 | 0.730988197572089 |
| 10 | 0.760453547427165 | 0.479092905145671 | 0.239546452572835 |
| 11 | 0.81721351817017 | 0.365572963659659 | 0.182786481829829 |
| 12 | 0.743266954500377 | 0.513466090999246 | 0.256733045499623 |
| 13 | 0.6810077471054 | 0.6379845057892 | 0.3189922528946 |
| 14 | 0.602083853196816 | 0.795832293606369 | 0.397916146803184 |
| 15 | 0.601043671063541 | 0.797912657872918 | 0.398956328936459 |
| 16 | 0.514867519431744 | 0.970264961136512 | 0.485132480568256 |
| 17 | 0.431760367136252 | 0.863520734272503 | 0.568239632863748 |
| 18 | 0.355884726034114 | 0.711769452068229 | 0.644115273965886 |
| 19 | 0.463646491112822 | 0.927292982225645 | 0.536353508887178 |
| 20 | 0.382511502305463 | 0.765023004610927 | 0.617488497694537 |
| 21 | 0.291192756925649 | 0.582385513851298 | 0.708807243074351 |
| 22 | 0.272744186744543 | 0.545488373489087 | 0.727255813255457 |
| 23 | 0.306546094401556 | 0.613092188803112 | 0.693453905598444 |
| 24 | 0.593826579260509 | 0.812346841478983 | 0.406173420739491 |
| 25 | 0.698801681937009 | 0.602396636125983 | 0.301198318062991 |
| 26 | 0.673574985436124 | 0.652850029127751 | 0.326425014563876 |
| 27 | 0.59377446358378 | 0.81245107283244 | 0.40622553641622 |
| 28 | 0.484281074695856 | 0.968562149391712 | 0.515718925304144 |
| 29 | 0.369053830303162 | 0.738107660606324 | 0.630946169696838 |
| 30 | 0.294743877227464 | 0.589487754454927 | 0.705256122772536 |
| 31 | 0.244038451017406 | 0.488076902034811 | 0.755961548982594 |
| 32 | 0.261687834996549 | 0.523375669993098 | 0.738312165003451 |
| 33 | 0.282002219776533 | 0.564004439553065 | 0.717997780223467 |
| Meta Analysis of Goldfeld-Quandt test for Heteroskedasticity | |||
| Description | # significant tests | % significant tests | OK/NOK |
| 1% type I error level | 0 | 0 | OK |
| 5% type I error level | 0 | 0 | OK |
| 10% type I error level | 0 | 0 | OK |