Free Statistics

of Irreproducible Research!

Author's title

Author*The author of this computation has been verified*
R Software Modulerwasp_autocorrelation.wasp
Title produced by software(Partial) Autocorrelation Function
Date of computationSat, 11 Dec 2010 23:31:44 +0000
Cite this page as followsStatistical Computations at FreeStatistics.org, Office for Research Development and Education, URL https://freestatistics.org/blog/index.php?v=date/2010/Dec/12/t1292110184xl54unnw1c0opv0.htm/, Retrieved Tue, 07 May 2024 15:57:57 +0000
Statistical Computations at FreeStatistics.org, Office for Research Development and Education, URL https://freestatistics.org/blog/index.php?pk=108319, Retrieved Tue, 07 May 2024 15:57:57 +0000
QR Codes:

Original text written by user:
IsPrivate?No (this computation is public)
User-defined keywords
Estimated Impact162
Family? (F = Feedback message, R = changed R code, M = changed R Module, P = changed Parameters, D = changed Data)
-     [Univariate Explorative Data Analysis] [paper] [2007-12-11 21:01:08] [b3bb3ec527e23fa7d74d4348b38c8499]
- RMPD  [Univariate Explorative Data Analysis] [PAPER] [2009-12-30 15:50:30] [23722951c28e05bb35cc9a97084fe0d9]
-    D    [Univariate Explorative Data Analysis] [] [2010-12-11 20:13:12] [afdb2fc47981b6a655b732edc8065db9]
- RMPD        [(Partial) Autocorrelation Function] [] [2010-12-11 23:31:44] [297722d8c88c4886be8e106c47d8f3cc] [Current]
Feedback Forum

Post a new message
Dataseries X:
100918
105017
108666
116083
117359
102191
102617
106640
108783
112534
113149
117125
107597
108745
111311
115669
114585
101628
97493
99180
100247
97657
95378
89406
82880
82662
83469
86371
86822
73899
71415
76335
76844
78192
80651
81485
78872
81632
84822
92175
92844
77443
77550
80367
83117
86622
90999
90276
91982
96279
106810
109483
110159
98305
99450
101536
99925
102850
101993
108928
107605


Summary of computational transaction
Raw Inputview raw input (R code)
Raw Outputview raw output of R engine
Computing time1 seconds
R Server'Gwilym Jenkins' @ 72.249.127.135

\begin{tabular}{lllllllll}
\hline
Summary of computational transaction \tabularnewline
Raw Input & view raw input (R code)  \tabularnewline
Raw Output & view raw output of R engine  \tabularnewline
Computing time & 1 seconds \tabularnewline
R Server & 'Gwilym Jenkins' @ 72.249.127.135 \tabularnewline
\hline
\end{tabular}
%Source: https://freestatistics.org/blog/index.php?pk=108319&T=0

[TABLE]
[ROW][C]Summary of computational transaction[/C][/ROW]
[ROW][C]Raw Input[/C][C]view raw input (R code) [/C][/ROW]
[ROW][C]Raw Output[/C][C]view raw output of R engine [/C][/ROW]
[ROW][C]Computing time[/C][C]1 seconds[/C][/ROW]
[ROW][C]R Server[/C][C]'Gwilym Jenkins' @ 72.249.127.135[/C][/ROW]
[/TABLE]
Source: https://freestatistics.org/blog/index.php?pk=108319&T=0

Globally Unique Identifier (entire table): ba.freestatistics.org/blog/index.php?pk=108319&T=0

As an alternative you can also use a QR Code:  

The GUIDs for individual cells are displayed in the table below:

Summary of computational transaction
Raw Inputview raw input (R code)
Raw Outputview raw output of R engine
Computing time1 seconds
R Server'Gwilym Jenkins' @ 72.249.127.135


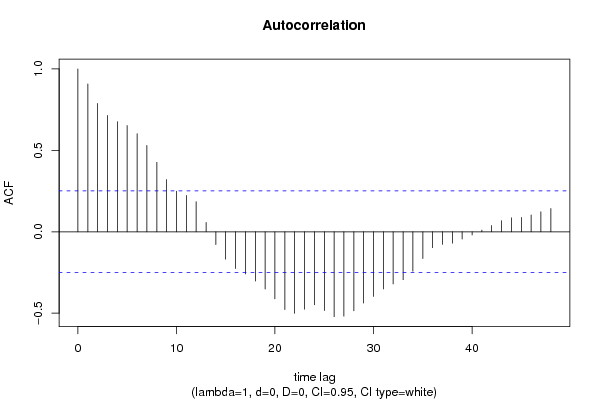
Autocorrelation Function
Time lag kACF(k)T-STATP-value
10.9077457.08970
20.788336.15710
30.7147725.58250
40.6760775.28031e-06
50.6524545.09582e-06
60.6021824.70328e-06
70.530394.14255.4e-05
80.4268623.33390.00073
90.3209412.50660.007435
100.2496861.95010.027881
110.2234391.74510.043
120.1846061.44180.077234
130.0577660.45120.326734
14-0.078275-0.61130.27162
15-0.168315-1.31460.096786
16-0.22553-1.76140.041587
17-0.258535-2.01920.023932
18-0.302557-2.3630.010665
19-0.351555-2.74570.003961
20-0.411775-3.21610.00104
21-0.477623-3.73040.000211
22-0.500667-3.91030.000117
23-0.475228-3.71160.000224
24-0.448397-3.50210.000435
25-0.483642-3.77740.000181
26-0.521075-4.06976.9e-05
27-0.518535-4.04997.4e-05
28-0.485399-3.79110.000173
29-0.437828-3.41950.000562
30-0.39668-3.09820.001471
31-0.35085-2.74020.004021
32-0.320247-2.50120.007539
33-0.294305-2.29860.012484
34-0.241844-1.88890.031834
35-0.164112-1.28180.10239
36-0.097532-0.76180.224572
37-0.077974-0.6090.272393
38-0.070339-0.54940.29238
39-0.044738-0.34940.363991
40-0.019632-0.15330.439321
410.0107680.08410.466626
420.0379550.29640.38395
430.0685580.53550.297142
440.0859660.67140.252246
450.0880550.68770.247113
460.1037420.81030.210472
470.1229010.95990.17045
480.1430821.11750.13408

\begin{tabular}{lllllllll}
\hline
Autocorrelation Function \tabularnewline
Time lag k & ACF(k) & T-STAT & P-value \tabularnewline
1 & 0.907745 & 7.0897 & 0 \tabularnewline
2 & 0.78833 & 6.1571 & 0 \tabularnewline
3 & 0.714772 & 5.5825 & 0 \tabularnewline
4 & 0.676077 & 5.2803 & 1e-06 \tabularnewline
5 & 0.652454 & 5.0958 & 2e-06 \tabularnewline
6 & 0.602182 & 4.7032 & 8e-06 \tabularnewline
7 & 0.53039 & 4.1425 & 5.4e-05 \tabularnewline
8 & 0.426862 & 3.3339 & 0.00073 \tabularnewline
9 & 0.320941 & 2.5066 & 0.007435 \tabularnewline
10 & 0.249686 & 1.9501 & 0.027881 \tabularnewline
11 & 0.223439 & 1.7451 & 0.043 \tabularnewline
12 & 0.184606 & 1.4418 & 0.077234 \tabularnewline
13 & 0.057766 & 0.4512 & 0.326734 \tabularnewline
14 & -0.078275 & -0.6113 & 0.27162 \tabularnewline
15 & -0.168315 & -1.3146 & 0.096786 \tabularnewline
16 & -0.22553 & -1.7614 & 0.041587 \tabularnewline
17 & -0.258535 & -2.0192 & 0.023932 \tabularnewline
18 & -0.302557 & -2.363 & 0.010665 \tabularnewline
19 & -0.351555 & -2.7457 & 0.003961 \tabularnewline
20 & -0.411775 & -3.2161 & 0.00104 \tabularnewline
21 & -0.477623 & -3.7304 & 0.000211 \tabularnewline
22 & -0.500667 & -3.9103 & 0.000117 \tabularnewline
23 & -0.475228 & -3.7116 & 0.000224 \tabularnewline
24 & -0.448397 & -3.5021 & 0.000435 \tabularnewline
25 & -0.483642 & -3.7774 & 0.000181 \tabularnewline
26 & -0.521075 & -4.0697 & 6.9e-05 \tabularnewline
27 & -0.518535 & -4.0499 & 7.4e-05 \tabularnewline
28 & -0.485399 & -3.7911 & 0.000173 \tabularnewline
29 & -0.437828 & -3.4195 & 0.000562 \tabularnewline
30 & -0.39668 & -3.0982 & 0.001471 \tabularnewline
31 & -0.35085 & -2.7402 & 0.004021 \tabularnewline
32 & -0.320247 & -2.5012 & 0.007539 \tabularnewline
33 & -0.294305 & -2.2986 & 0.012484 \tabularnewline
34 & -0.241844 & -1.8889 & 0.031834 \tabularnewline
35 & -0.164112 & -1.2818 & 0.10239 \tabularnewline
36 & -0.097532 & -0.7618 & 0.224572 \tabularnewline
37 & -0.077974 & -0.609 & 0.272393 \tabularnewline
38 & -0.070339 & -0.5494 & 0.29238 \tabularnewline
39 & -0.044738 & -0.3494 & 0.363991 \tabularnewline
40 & -0.019632 & -0.1533 & 0.439321 \tabularnewline
41 & 0.010768 & 0.0841 & 0.466626 \tabularnewline
42 & 0.037955 & 0.2964 & 0.38395 \tabularnewline
43 & 0.068558 & 0.5355 & 0.297142 \tabularnewline
44 & 0.085966 & 0.6714 & 0.252246 \tabularnewline
45 & 0.088055 & 0.6877 & 0.247113 \tabularnewline
46 & 0.103742 & 0.8103 & 0.210472 \tabularnewline
47 & 0.122901 & 0.9599 & 0.17045 \tabularnewline
48 & 0.143082 & 1.1175 & 0.13408 \tabularnewline
\hline
\end{tabular}
%Source: https://freestatistics.org/blog/index.php?pk=108319&T=1

[TABLE]
[ROW][C]Autocorrelation Function[/C][/ROW]
[ROW][C]Time lag k[/C][C]ACF(k)[/C][C]T-STAT[/C][C]P-value[/C][/ROW]
[ROW][C]1[/C][C]0.907745[/C][C]7.0897[/C][C]0[/C][/ROW]
[ROW][C]2[/C][C]0.78833[/C][C]6.1571[/C][C]0[/C][/ROW]
[ROW][C]3[/C][C]0.714772[/C][C]5.5825[/C][C]0[/C][/ROW]
[ROW][C]4[/C][C]0.676077[/C][C]5.2803[/C][C]1e-06[/C][/ROW]
[ROW][C]5[/C][C]0.652454[/C][C]5.0958[/C][C]2e-06[/C][/ROW]
[ROW][C]6[/C][C]0.602182[/C][C]4.7032[/C][C]8e-06[/C][/ROW]
[ROW][C]7[/C][C]0.53039[/C][C]4.1425[/C][C]5.4e-05[/C][/ROW]
[ROW][C]8[/C][C]0.426862[/C][C]3.3339[/C][C]0.00073[/C][/ROW]
[ROW][C]9[/C][C]0.320941[/C][C]2.5066[/C][C]0.007435[/C][/ROW]
[ROW][C]10[/C][C]0.249686[/C][C]1.9501[/C][C]0.027881[/C][/ROW]
[ROW][C]11[/C][C]0.223439[/C][C]1.7451[/C][C]0.043[/C][/ROW]
[ROW][C]12[/C][C]0.184606[/C][C]1.4418[/C][C]0.077234[/C][/ROW]
[ROW][C]13[/C][C]0.057766[/C][C]0.4512[/C][C]0.326734[/C][/ROW]
[ROW][C]14[/C][C]-0.078275[/C][C]-0.6113[/C][C]0.27162[/C][/ROW]
[ROW][C]15[/C][C]-0.168315[/C][C]-1.3146[/C][C]0.096786[/C][/ROW]
[ROW][C]16[/C][C]-0.22553[/C][C]-1.7614[/C][C]0.041587[/C][/ROW]
[ROW][C]17[/C][C]-0.258535[/C][C]-2.0192[/C][C]0.023932[/C][/ROW]
[ROW][C]18[/C][C]-0.302557[/C][C]-2.363[/C][C]0.010665[/C][/ROW]
[ROW][C]19[/C][C]-0.351555[/C][C]-2.7457[/C][C]0.003961[/C][/ROW]
[ROW][C]20[/C][C]-0.411775[/C][C]-3.2161[/C][C]0.00104[/C][/ROW]
[ROW][C]21[/C][C]-0.477623[/C][C]-3.7304[/C][C]0.000211[/C][/ROW]
[ROW][C]22[/C][C]-0.500667[/C][C]-3.9103[/C][C]0.000117[/C][/ROW]
[ROW][C]23[/C][C]-0.475228[/C][C]-3.7116[/C][C]0.000224[/C][/ROW]
[ROW][C]24[/C][C]-0.448397[/C][C]-3.5021[/C][C]0.000435[/C][/ROW]
[ROW][C]25[/C][C]-0.483642[/C][C]-3.7774[/C][C]0.000181[/C][/ROW]
[ROW][C]26[/C][C]-0.521075[/C][C]-4.0697[/C][C]6.9e-05[/C][/ROW]
[ROW][C]27[/C][C]-0.518535[/C][C]-4.0499[/C][C]7.4e-05[/C][/ROW]
[ROW][C]28[/C][C]-0.485399[/C][C]-3.7911[/C][C]0.000173[/C][/ROW]
[ROW][C]29[/C][C]-0.437828[/C][C]-3.4195[/C][C]0.000562[/C][/ROW]
[ROW][C]30[/C][C]-0.39668[/C][C]-3.0982[/C][C]0.001471[/C][/ROW]
[ROW][C]31[/C][C]-0.35085[/C][C]-2.7402[/C][C]0.004021[/C][/ROW]
[ROW][C]32[/C][C]-0.320247[/C][C]-2.5012[/C][C]0.007539[/C][/ROW]
[ROW][C]33[/C][C]-0.294305[/C][C]-2.2986[/C][C]0.012484[/C][/ROW]
[ROW][C]34[/C][C]-0.241844[/C][C]-1.8889[/C][C]0.031834[/C][/ROW]
[ROW][C]35[/C][C]-0.164112[/C][C]-1.2818[/C][C]0.10239[/C][/ROW]
[ROW][C]36[/C][C]-0.097532[/C][C]-0.7618[/C][C]0.224572[/C][/ROW]
[ROW][C]37[/C][C]-0.077974[/C][C]-0.609[/C][C]0.272393[/C][/ROW]
[ROW][C]38[/C][C]-0.070339[/C][C]-0.5494[/C][C]0.29238[/C][/ROW]
[ROW][C]39[/C][C]-0.044738[/C][C]-0.3494[/C][C]0.363991[/C][/ROW]
[ROW][C]40[/C][C]-0.019632[/C][C]-0.1533[/C][C]0.439321[/C][/ROW]
[ROW][C]41[/C][C]0.010768[/C][C]0.0841[/C][C]0.466626[/C][/ROW]
[ROW][C]42[/C][C]0.037955[/C][C]0.2964[/C][C]0.38395[/C][/ROW]
[ROW][C]43[/C][C]0.068558[/C][C]0.5355[/C][C]0.297142[/C][/ROW]
[ROW][C]44[/C][C]0.085966[/C][C]0.6714[/C][C]0.252246[/C][/ROW]
[ROW][C]45[/C][C]0.088055[/C][C]0.6877[/C][C]0.247113[/C][/ROW]
[ROW][C]46[/C][C]0.103742[/C][C]0.8103[/C][C]0.210472[/C][/ROW]
[ROW][C]47[/C][C]0.122901[/C][C]0.9599[/C][C]0.17045[/C][/ROW]
[ROW][C]48[/C][C]0.143082[/C][C]1.1175[/C][C]0.13408[/C][/ROW]
[/TABLE]
Source: https://freestatistics.org/blog/index.php?pk=108319&T=1

Globally Unique Identifier (entire table): ba.freestatistics.org/blog/index.php?pk=108319&T=1

As an alternative you can also use a QR Code:  

The GUIDs for individual cells are displayed in the table below:

Autocorrelation Function
Time lag kACF(k)T-STATP-value
10.9077457.08970
20.788336.15710
30.7147725.58250
40.6760775.28031e-06
50.6524545.09582e-06
60.6021824.70328e-06
70.530394.14255.4e-05
80.4268623.33390.00073
90.3209412.50660.007435
100.2496861.95010.027881
110.2234391.74510.043
120.1846061.44180.077234
130.0577660.45120.326734
14-0.078275-0.61130.27162
15-0.168315-1.31460.096786
16-0.22553-1.76140.041587
17-0.258535-2.01920.023932
18-0.302557-2.3630.010665
19-0.351555-2.74570.003961
20-0.411775-3.21610.00104
21-0.477623-3.73040.000211
22-0.500667-3.91030.000117
23-0.475228-3.71160.000224
24-0.448397-3.50210.000435
25-0.483642-3.77740.000181
26-0.521075-4.06976.9e-05
27-0.518535-4.04997.4e-05
28-0.485399-3.79110.000173
29-0.437828-3.41950.000562
30-0.39668-3.09820.001471
31-0.35085-2.74020.004021
32-0.320247-2.50120.007539
33-0.294305-2.29860.012484
34-0.241844-1.88890.031834
35-0.164112-1.28180.10239
36-0.097532-0.76180.224572
37-0.077974-0.6090.272393
38-0.070339-0.54940.29238
39-0.044738-0.34940.363991
40-0.019632-0.15330.439321
410.0107680.08410.466626
420.0379550.29640.38395
430.0685580.53550.297142
440.0859660.67140.252246
450.0880550.68770.247113
460.1037420.81030.210472
470.1229010.95990.17045
480.1430821.11750.13408


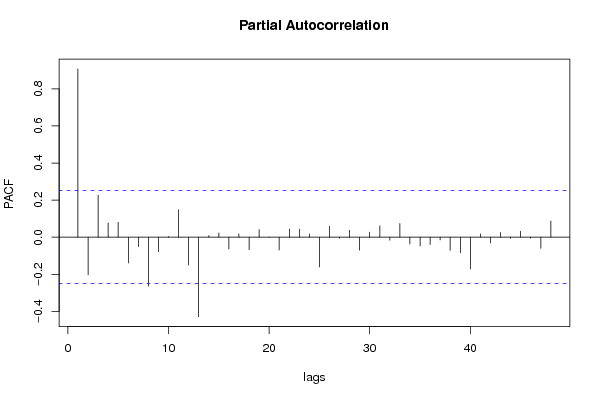
Partial Autocorrelation Function
Time lag kPACF(k)T-STATP-value
10.9077457.08970
2-0.202674-1.58290.059304
30.2258221.76370.041393
40.0759710.59340.277569
50.08070.63030.26543
6-0.139113-1.08650.140765
7-0.050442-0.3940.347491
8-0.263742-2.05990.021841
9-0.078701-0.61470.270528
100.0040680.03180.487379
110.1484861.15970.125343
12-0.149612-1.16850.123574
13-0.428606-3.34757e-04
140.0088850.06940.472453
150.0228850.17870.429369
16-0.06416-0.50110.30905
170.0175120.13680.445831
18-0.067225-0.5250.300727
190.0415710.32470.373268
20-0.001661-0.0130.494847
21-0.069646-0.5440.294229
220.0437050.34140.367006
230.0430480.33620.368932
240.0172550.13480.446619
25-0.160306-1.2520.107669
260.0585920.45760.324425
27-0.005283-0.04130.483612
280.0372770.29110.385966
29-0.070215-0.54840.292709
300.0273280.21340.415847
310.0618180.48280.315479
32-0.016181-0.12640.449925
330.0734610.57380.284123
34-0.036877-0.2880.387154
35-0.046999-0.36710.357417
36-0.039111-0.30550.380525
37-0.014823-0.11580.454107
38-0.070516-0.55070.291908
39-0.084205-0.65770.256614
40-0.171701-1.3410.092442
410.016910.13210.44768
42-0.030863-0.2410.405164
430.0256460.20030.420956
44-0.005906-0.04610.481679
450.0318910.24910.40207
46-0.005241-0.04090.48374
47-0.059721-0.46640.321282
480.0877640.68550.247825

\begin{tabular}{lllllllll}
\hline
Partial Autocorrelation Function \tabularnewline
Time lag k & PACF(k) & T-STAT & P-value \tabularnewline
1 & 0.907745 & 7.0897 & 0 \tabularnewline
2 & -0.202674 & -1.5829 & 0.059304 \tabularnewline
3 & 0.225822 & 1.7637 & 0.041393 \tabularnewline
4 & 0.075971 & 0.5934 & 0.277569 \tabularnewline
5 & 0.0807 & 0.6303 & 0.26543 \tabularnewline
6 & -0.139113 & -1.0865 & 0.140765 \tabularnewline
7 & -0.050442 & -0.394 & 0.347491 \tabularnewline
8 & -0.263742 & -2.0599 & 0.021841 \tabularnewline
9 & -0.078701 & -0.6147 & 0.270528 \tabularnewline
10 & 0.004068 & 0.0318 & 0.487379 \tabularnewline
11 & 0.148486 & 1.1597 & 0.125343 \tabularnewline
12 & -0.149612 & -1.1685 & 0.123574 \tabularnewline
13 & -0.428606 & -3.3475 & 7e-04 \tabularnewline
14 & 0.008885 & 0.0694 & 0.472453 \tabularnewline
15 & 0.022885 & 0.1787 & 0.429369 \tabularnewline
16 & -0.06416 & -0.5011 & 0.30905 \tabularnewline
17 & 0.017512 & 0.1368 & 0.445831 \tabularnewline
18 & -0.067225 & -0.525 & 0.300727 \tabularnewline
19 & 0.041571 & 0.3247 & 0.373268 \tabularnewline
20 & -0.001661 & -0.013 & 0.494847 \tabularnewline
21 & -0.069646 & -0.544 & 0.294229 \tabularnewline
22 & 0.043705 & 0.3414 & 0.367006 \tabularnewline
23 & 0.043048 & 0.3362 & 0.368932 \tabularnewline
24 & 0.017255 & 0.1348 & 0.446619 \tabularnewline
25 & -0.160306 & -1.252 & 0.107669 \tabularnewline
26 & 0.058592 & 0.4576 & 0.324425 \tabularnewline
27 & -0.005283 & -0.0413 & 0.483612 \tabularnewline
28 & 0.037277 & 0.2911 & 0.385966 \tabularnewline
29 & -0.070215 & -0.5484 & 0.292709 \tabularnewline
30 & 0.027328 & 0.2134 & 0.415847 \tabularnewline
31 & 0.061818 & 0.4828 & 0.315479 \tabularnewline
32 & -0.016181 & -0.1264 & 0.449925 \tabularnewline
33 & 0.073461 & 0.5738 & 0.284123 \tabularnewline
34 & -0.036877 & -0.288 & 0.387154 \tabularnewline
35 & -0.046999 & -0.3671 & 0.357417 \tabularnewline
36 & -0.039111 & -0.3055 & 0.380525 \tabularnewline
37 & -0.014823 & -0.1158 & 0.454107 \tabularnewline
38 & -0.070516 & -0.5507 & 0.291908 \tabularnewline
39 & -0.084205 & -0.6577 & 0.256614 \tabularnewline
40 & -0.171701 & -1.341 & 0.092442 \tabularnewline
41 & 0.01691 & 0.1321 & 0.44768 \tabularnewline
42 & -0.030863 & -0.241 & 0.405164 \tabularnewline
43 & 0.025646 & 0.2003 & 0.420956 \tabularnewline
44 & -0.005906 & -0.0461 & 0.481679 \tabularnewline
45 & 0.031891 & 0.2491 & 0.40207 \tabularnewline
46 & -0.005241 & -0.0409 & 0.48374 \tabularnewline
47 & -0.059721 & -0.4664 & 0.321282 \tabularnewline
48 & 0.087764 & 0.6855 & 0.247825 \tabularnewline
\hline
\end{tabular}
%Source: https://freestatistics.org/blog/index.php?pk=108319&T=2

[TABLE]
[ROW][C]Partial Autocorrelation Function[/C][/ROW]
[ROW][C]Time lag k[/C][C]PACF(k)[/C][C]T-STAT[/C][C]P-value[/C][/ROW]
[ROW][C]1[/C][C]0.907745[/C][C]7.0897[/C][C]0[/C][/ROW]
[ROW][C]2[/C][C]-0.202674[/C][C]-1.5829[/C][C]0.059304[/C][/ROW]
[ROW][C]3[/C][C]0.225822[/C][C]1.7637[/C][C]0.041393[/C][/ROW]
[ROW][C]4[/C][C]0.075971[/C][C]0.5934[/C][C]0.277569[/C][/ROW]
[ROW][C]5[/C][C]0.0807[/C][C]0.6303[/C][C]0.26543[/C][/ROW]
[ROW][C]6[/C][C]-0.139113[/C][C]-1.0865[/C][C]0.140765[/C][/ROW]
[ROW][C]7[/C][C]-0.050442[/C][C]-0.394[/C][C]0.347491[/C][/ROW]
[ROW][C]8[/C][C]-0.263742[/C][C]-2.0599[/C][C]0.021841[/C][/ROW]
[ROW][C]9[/C][C]-0.078701[/C][C]-0.6147[/C][C]0.270528[/C][/ROW]
[ROW][C]10[/C][C]0.004068[/C][C]0.0318[/C][C]0.487379[/C][/ROW]
[ROW][C]11[/C][C]0.148486[/C][C]1.1597[/C][C]0.125343[/C][/ROW]
[ROW][C]12[/C][C]-0.149612[/C][C]-1.1685[/C][C]0.123574[/C][/ROW]
[ROW][C]13[/C][C]-0.428606[/C][C]-3.3475[/C][C]7e-04[/C][/ROW]
[ROW][C]14[/C][C]0.008885[/C][C]0.0694[/C][C]0.472453[/C][/ROW]
[ROW][C]15[/C][C]0.022885[/C][C]0.1787[/C][C]0.429369[/C][/ROW]
[ROW][C]16[/C][C]-0.06416[/C][C]-0.5011[/C][C]0.30905[/C][/ROW]
[ROW][C]17[/C][C]0.017512[/C][C]0.1368[/C][C]0.445831[/C][/ROW]
[ROW][C]18[/C][C]-0.067225[/C][C]-0.525[/C][C]0.300727[/C][/ROW]
[ROW][C]19[/C][C]0.041571[/C][C]0.3247[/C][C]0.373268[/C][/ROW]
[ROW][C]20[/C][C]-0.001661[/C][C]-0.013[/C][C]0.494847[/C][/ROW]
[ROW][C]21[/C][C]-0.069646[/C][C]-0.544[/C][C]0.294229[/C][/ROW]
[ROW][C]22[/C][C]0.043705[/C][C]0.3414[/C][C]0.367006[/C][/ROW]
[ROW][C]23[/C][C]0.043048[/C][C]0.3362[/C][C]0.368932[/C][/ROW]
[ROW][C]24[/C][C]0.017255[/C][C]0.1348[/C][C]0.446619[/C][/ROW]
[ROW][C]25[/C][C]-0.160306[/C][C]-1.252[/C][C]0.107669[/C][/ROW]
[ROW][C]26[/C][C]0.058592[/C][C]0.4576[/C][C]0.324425[/C][/ROW]
[ROW][C]27[/C][C]-0.005283[/C][C]-0.0413[/C][C]0.483612[/C][/ROW]
[ROW][C]28[/C][C]0.037277[/C][C]0.2911[/C][C]0.385966[/C][/ROW]
[ROW][C]29[/C][C]-0.070215[/C][C]-0.5484[/C][C]0.292709[/C][/ROW]
[ROW][C]30[/C][C]0.027328[/C][C]0.2134[/C][C]0.415847[/C][/ROW]
[ROW][C]31[/C][C]0.061818[/C][C]0.4828[/C][C]0.315479[/C][/ROW]
[ROW][C]32[/C][C]-0.016181[/C][C]-0.1264[/C][C]0.449925[/C][/ROW]
[ROW][C]33[/C][C]0.073461[/C][C]0.5738[/C][C]0.284123[/C][/ROW]
[ROW][C]34[/C][C]-0.036877[/C][C]-0.288[/C][C]0.387154[/C][/ROW]
[ROW][C]35[/C][C]-0.046999[/C][C]-0.3671[/C][C]0.357417[/C][/ROW]
[ROW][C]36[/C][C]-0.039111[/C][C]-0.3055[/C][C]0.380525[/C][/ROW]
[ROW][C]37[/C][C]-0.014823[/C][C]-0.1158[/C][C]0.454107[/C][/ROW]
[ROW][C]38[/C][C]-0.070516[/C][C]-0.5507[/C][C]0.291908[/C][/ROW]
[ROW][C]39[/C][C]-0.084205[/C][C]-0.6577[/C][C]0.256614[/C][/ROW]
[ROW][C]40[/C][C]-0.171701[/C][C]-1.341[/C][C]0.092442[/C][/ROW]
[ROW][C]41[/C][C]0.01691[/C][C]0.1321[/C][C]0.44768[/C][/ROW]
[ROW][C]42[/C][C]-0.030863[/C][C]-0.241[/C][C]0.405164[/C][/ROW]
[ROW][C]43[/C][C]0.025646[/C][C]0.2003[/C][C]0.420956[/C][/ROW]
[ROW][C]44[/C][C]-0.005906[/C][C]-0.0461[/C][C]0.481679[/C][/ROW]
[ROW][C]45[/C][C]0.031891[/C][C]0.2491[/C][C]0.40207[/C][/ROW]
[ROW][C]46[/C][C]-0.005241[/C][C]-0.0409[/C][C]0.48374[/C][/ROW]
[ROW][C]47[/C][C]-0.059721[/C][C]-0.4664[/C][C]0.321282[/C][/ROW]
[ROW][C]48[/C][C]0.087764[/C][C]0.6855[/C][C]0.247825[/C][/ROW]
[/TABLE]
Source: https://freestatistics.org/blog/index.php?pk=108319&T=2

Globally Unique Identifier (entire table): ba.freestatistics.org/blog/index.php?pk=108319&T=2

As an alternative you can also use a QR Code:  

The GUIDs for individual cells are displayed in the table below:

Partial Autocorrelation Function
Time lag kPACF(k)T-STATP-value
10.9077457.08970
2-0.202674-1.58290.059304
30.2258221.76370.041393
40.0759710.59340.277569
50.08070.63030.26543
6-0.139113-1.08650.140765
7-0.050442-0.3940.347491
8-0.263742-2.05990.021841
9-0.078701-0.61470.270528
100.0040680.03180.487379
110.1484861.15970.125343
12-0.149612-1.16850.123574
13-0.428606-3.34757e-04
140.0088850.06940.472453
150.0228850.17870.429369
16-0.06416-0.50110.30905
170.0175120.13680.445831
18-0.067225-0.5250.300727
190.0415710.32470.373268
20-0.001661-0.0130.494847
21-0.069646-0.5440.294229
220.0437050.34140.367006
230.0430480.33620.368932
240.0172550.13480.446619
25-0.160306-1.2520.107669
260.0585920.45760.324425
27-0.005283-0.04130.483612
280.0372770.29110.385966
29-0.070215-0.54840.292709
300.0273280.21340.415847
310.0618180.48280.315479
32-0.016181-0.12640.449925
330.0734610.57380.284123
34-0.036877-0.2880.387154
35-0.046999-0.36710.357417
36-0.039111-0.30550.380525
37-0.014823-0.11580.454107
38-0.070516-0.55070.291908
39-0.084205-0.65770.256614
40-0.171701-1.3410.092442
410.016910.13210.44768
42-0.030863-0.2410.405164
430.0256460.20030.420956
44-0.005906-0.04610.481679
450.0318910.24910.40207
46-0.005241-0.04090.48374
47-0.059721-0.46640.321282
480.0877640.68550.247825


Parameters (Session):
Parameters (R input):
par1 = 48 ; par2 = 1 ; par3 = 0 ; par4 = 0 ; par5 = 12 ; par6 = White Noise ; par7 = 0.95 ;
R code (references can be found in the software module):
if (par1 == 'Default') {
par1 = 10*log10(length(x))
} else {
par1 <- as.numeric(par1)
}
par2 <- as.numeric(par2)
par3 <- as.numeric(par3)
par4 <- as.numeric(par4)
par5 <- as.numeric(par5)
if (par6 == 'White Noise') par6 <- 'white' else par6 <- 'ma'
par7 <- as.numeric(par7)
if (par2 == 0) {
x <- log(x)
} else {
x <- (x ^ par2 - 1) / par2
}
if (par3 > 0) x <- diff(x,lag=1,difference=par3)
if (par4 > 0) x <- diff(x,lag=par5,difference=par4)
bitmap(file='pic1.png')
racf <- acf(x, par1, main='Autocorrelation', xlab='time lag', ylab='ACF', ci.type=par6, ci=par7, sub=paste('(lambda=',par2,', d=',par3,', D=',par4,', CI=', par7, ', CI type=',par6,')',sep=''))
dev.off()
bitmap(file='pic2.png')
rpacf <- pacf(x,par1,main='Partial Autocorrelation',xlab='lags',ylab='PACF')
dev.off()
(myacf <- c(racf$acf))
(mypacf <- c(rpacf$acf))
lengthx <- length(x)
sqrtn <- sqrt(lengthx)
load(file='createtable')
a<-table.start()
a<-table.row.start(a)
a<-table.element(a,'Autocorrelation Function',4,TRUE)
a<-table.row.end(a)
a<-table.row.start(a)
a<-table.element(a,'Time lag k',header=TRUE)
a<-table.element(a,hyperlink('basics.htm','ACF(k)','click here for more information about the Autocorrelation Function'),header=TRUE)
a<-table.element(a,'T-STAT',header=TRUE)
a<-table.element(a,'P-value',header=TRUE)
a<-table.row.end(a)
for (i in 2:(par1+1)) {
a<-table.row.start(a)
a<-table.element(a,i-1,header=TRUE)
a<-table.element(a,round(myacf[i],6))
mytstat <- myacf[i]*sqrtn
a<-table.element(a,round(mytstat,4))
a<-table.element(a,round(1-pt(abs(mytstat),lengthx),6))
a<-table.row.end(a)
}
a<-table.end(a)
table.save(a,file='mytable.tab')
a<-table.start()
a<-table.row.start(a)
a<-table.element(a,'Partial Autocorrelation Function',4,TRUE)
a<-table.row.end(a)
a<-table.row.start(a)
a<-table.element(a,'Time lag k',header=TRUE)
a<-table.element(a,hyperlink('basics.htm','PACF(k)','click here for more information about the Partial Autocorrelation Function'),header=TRUE)
a<-table.element(a,'T-STAT',header=TRUE)
a<-table.element(a,'P-value',header=TRUE)
a<-table.row.end(a)
for (i in 1:par1) {
a<-table.row.start(a)
a<-table.element(a,i,header=TRUE)
a<-table.element(a,round(mypacf[i],6))
mytstat <- mypacf[i]*sqrtn
a<-table.element(a,round(mytstat,4))
a<-table.element(a,round(1-pt(abs(mytstat),lengthx),6))
a<-table.row.end(a)
}
a<-table.end(a)
table.save(a,file='mytable1.tab')