| Multiple Linear Regression - Estimated Regression Equation |
| Passengersbrussels[t] = + 1071749.92409519 + 33.106785413492DJIA[t] + e[t] |
| Multiple Linear Regression - Ordinary Least Squares | |||||
| Variable | Parameter | S.D. | T-STAT H0: parameter = 0 | 2-tail p-value | 1-tail p-value |
| (Intercept) | 1071749.92409519 | 234577.707801 | 4.5688 | 2.6e-05 | 1.3e-05 |
| DJIA | 33.106785413492 | 20.976377 | 1.5783 | 0.119938 | 0.059969 |
| Multiple Linear Regression - Regression Statistics | |
| Multiple R | 0.202927626023469 |
| R-squared | 0.0411796214035209 |
| Adjusted R-squared | 0.0246482355656507 |
| F-TEST (value) | 2.49099632707054 |
| F-TEST (DF numerator) | 1 |
| F-TEST (DF denominator) | 58 |
| p-value | 0.119938212265450 |
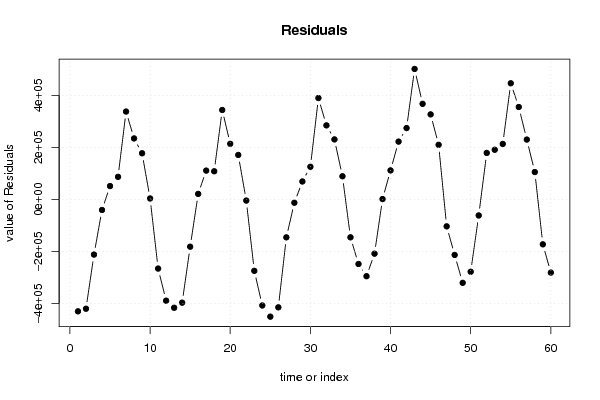
| Multiple Linear Regression - Residual Statistics | |
| Residual Standard Deviation | 266239.885706474 |
| Sum Squared Residuals | 4111253250977.78 |
| Multiple Linear Regression - Actuals, Interpolation, and Residuals | |||
| Time or Index | Actuals | Interpolation Forecast | Residuals Prediction Error |
| 1 | 989236 | 1419038.1166756 | -429802.116675601 |
| 2 | 1008380 | 1428185.19041749 | -419805.190417493 |
| 3 | 1207763 | 1419495.65245001 | -211732.652450014 |
| 4 | 1368839 | 1409191.16549006 | -40352.1654900646 |
| 5 | 1469798 | 1418294.53827521 | 51503.4617247875 |
| 6 | 1498721 | 1411921.15101526 | 86799.848984739 |
| 7 | 1761769 | 1424036.24806947 | 337732.751930526 |
| 8 | 1653214 | 1418762.00608525 | 234451.993914749 |
| 9 | 1599104 | 1421645.60709477 | 177458.392905234 |
| 10 | 1421179 | 1417387.08128703 | 3791.91871297136 |
| 11 | 1163995 | 1429497.54339128 | -265502.543391284 |
| 12 | 1037735 | 1426571.89676429 | -388836.896764294 |
| 13 | 1015407 | 1431450.51266283 | -416043.512662826 |
| 14 | 1039210 | 1435706.38992773 | -396496.38992773 |
| 15 | 1258049 | 1439543.79742501 | -181494.797425008 |
| 16 | 1469445 | 1448079.38884031 | 21365.6111596853 |
| 17 | 1552346 | 1441496.76669655 | 110849.23330345 |
| 18 | 1549144 | 1440897.86494842 | 108246.13505158 |
| 19 | 1785895 | 1442071.83155918 | 343823.168440818 |
| 20 | 1662335 | 1448543.21490396 | 213791.785096042 |
| 21 | 1629440 | 1458406.38841435 | 171033.611585655 |
| 22 | 1467430 | 1471704.05984353 | -4274.05984352845 |
| 23 | 1202209 | 1476378.73794391 | -274169.737943914 |
| 24 | 1076982 | 1484364.75672136 | -407382.756721356 |
| 25 | 1039367 | 1489613.50648081 | -450246.506480811 |
| 26 | 1063449 | 1477924.82482272 | -414475.824822724 |
| 27 | 1335135 | 1480762.73846837 | -145627.738468368 |
| 28 | 1491602 | 1504220.88234095 | -12618.8823409521 |
| 29 | 1591972 | 1522917.27726751 | 69054.7227324866 |
| 30 | 1641248 | 1515666.22912625 | 125581.770873750 |
| 31 | 1898849 | 1509156.44191040 | 389692.558089605 |
| 32 | 1798580 | 1513981.75588441 | 284598.244115588 |
| 33 | 1762444 | 1531789.56469048 | 230654.435309525 |
| 34 | 1622044 | 1532927.77597299 | 89116.224027009 |
| 35 | 1368955 | 1514444.58874449 | -145489.588744493 |
| 36 | 1262973 | 1510905.47338379 | -247932.47338379 |
| 37 | 1195650 | 1490562.67801862 | -294912.678018616 |
| 38 | 1269530 | 1477850.66562340 | -208320.665623397 |
| 39 | 1479279 | 1477734.79187445 | 1544.20812554985 |
| 40 | 1607819 | 1496183.21697826 | 111635.783021736 |
| 41 | 1712466 | 1490164.07232224 | 222301.927677763 |
| 42 | 1721766 | 1447512.26960618 | 274253.730393818 |
| 43 | 1949843 | 1448439.59066561 | 501403.409334387 |
| 44 | 1821326 | 1453919.75685511 | 367406.243144891 |
| 45 | 1757802 | 1430980.39630995 | 326821.603690046 |
| 46 | 1590367 | 1380471.02914386 | 209895.970856140 |
| 47 | 1260647 | 1364051.05678233 | -103404.056782331 |
| 48 | 1149235 | 1362307.98453031 | -213072.98453031 |
| 49 | 1016367 | 1336632.67923858 | -320265.679238585 |
| 50 | 1027885 | 1305580.83199571 | -277695.831995708 |
| 51 | 1262159 | 1323656.80576362 | -61497.8057636207 |
| 52 | 1520854 | 1342170.12016685 | 178683.879833155 |
| 53 | 1544144 | 1353168.52534906 | 190975.474650938 |
| 54 | 1564709 | 1351402.94048296 | 213306.05951704 |
| 55 | 1821776 | 1375392.44826143 | 446383.551738569 |
| 56 | 1741365 | 1386141.22828163 | 355223.771718371 |
| 57 | 1623386 | 1393292.29393094 | 230093.706069057 |
| 58 | 1498658 | 1393307.19198438 | 105350.808015621 |
| 59 | 1241822 | 1414234.32211210 | -172412.322112102 |
| 60 | 1136029 | 1416989.13772636 | -280960.137726358 |
| Goldfeld-Quandt test for Heteroskedasticity | |||
| p-values | Alternative Hypothesis | ||
| breakpoint index | greater | 2-sided | less |
| 5 | 0.336551027408893 | 0.673102054817787 | 0.663448972591107 |
| 6 | 0.225726299053095 | 0.451452598106191 | 0.774273700946905 |
| 7 | 0.709651963684601 | 0.580696072630797 | 0.290348036315398 |
| 8 | 0.713602570087373 | 0.572794859825254 | 0.286397429912627 |
| 9 | 0.676385494217328 | 0.647229011565344 | 0.323614505782672 |
| 10 | 0.56882177546268 | 0.86235644907464 | 0.43117822453732 |
| 11 | 0.496113926992465 | 0.99222785398493 | 0.503886073007535 |
| 12 | 0.497629573011568 | 0.995259146023137 | 0.502370426988431 |
| 13 | 0.469575741297462 | 0.939151482594924 | 0.530424258702538 |
| 14 | 0.424606942472294 | 0.849213884944589 | 0.575393057527706 |
| 15 | 0.408019262923499 | 0.816038525846998 | 0.591980737076501 |
| 16 | 0.490220512854605 | 0.98044102570921 | 0.509779487145395 |
| 17 | 0.498703878797394 | 0.997407757594787 | 0.501296121202606 |
| 18 | 0.472868262894514 | 0.945736525789028 | 0.527131737105486 |
| 19 | 0.578510303874273 | 0.842979392251454 | 0.421489696125727 |
| 20 | 0.55367015367938 | 0.89265969264124 | 0.44632984632062 |
| 21 | 0.492748459800135 | 0.98549691960027 | 0.507251540199865 |
| 22 | 0.418996391177156 | 0.837992782354313 | 0.581003608822844 |
| 23 | 0.436906665335915 | 0.87381333067183 | 0.563093334664085 |
| 24 | 0.511864569098319 | 0.976270861803362 | 0.488135430901681 |
| 25 | 0.597851173648182 | 0.804297652703636 | 0.402148826351818 |
| 26 | 0.668808710018814 | 0.662382579962372 | 0.331191289981186 |
| 27 | 0.630037026115978 | 0.739925947768044 | 0.369962973884022 |
| 28 | 0.599586837984897 | 0.800826324030206 | 0.400413162015103 |
| 29 | 0.574531123860656 | 0.850937752278688 | 0.425468876139344 |
| 30 | 0.538690941259919 | 0.922618117480161 | 0.461309058740081 |
| 31 | 0.62197678478271 | 0.75604643043458 | 0.37802321521729 |
| 32 | 0.614584456213431 | 0.770831087573137 | 0.385415543786569 |
| 33 | 0.573122756125457 | 0.853754487749086 | 0.426877243874543 |
| 34 | 0.497610750976743 | 0.995221501953485 | 0.502389249023257 |
| 35 | 0.46201995971998 | 0.92403991943996 | 0.53798004028002 |
| 36 | 0.498471476946992 | 0.996942953893983 | 0.501528523053008 |
| 37 | 0.603629937168227 | 0.792740125663545 | 0.396370062831773 |
| 38 | 0.677417958295361 | 0.645164083409277 | 0.322582041704639 |
| 39 | 0.661177444549415 | 0.67764511090117 | 0.338822555450585 |
| 40 | 0.644149363555708 | 0.711701272888583 | 0.355850636444292 |
| 41 | 0.616949259166243 | 0.766101481667514 | 0.383050740833757 |
| 42 | 0.574373249157682 | 0.851253501684637 | 0.425626750842318 |
| 43 | 0.631754108055115 | 0.73649178388977 | 0.368245891944885 |
| 44 | 0.604629433798416 | 0.790741132403168 | 0.395370566201584 |
| 45 | 0.580037076327375 | 0.83992584734525 | 0.419962923672625 |
| 46 | 0.52964701994663 | 0.940705960106741 | 0.470352980053371 |
| 47 | 0.451814345531793 | 0.903628691063586 | 0.548185654468207 |
| 48 | 0.425717600958218 | 0.851435201916436 | 0.574282399041782 |
| 49 | 0.486965044616028 | 0.973930089232056 | 0.513034955383972 |
| 50 | 0.641207066478689 | 0.717585867042622 | 0.358792933521311 |
| 51 | 0.773782546131827 | 0.452434907736346 | 0.226217453868173 |
| 52 | 0.752717987869609 | 0.494564024260782 | 0.247282012130391 |
| 53 | 0.7316504951113 | 0.536699009777401 | 0.268349504888700 |
| 54 | 0.994608676681441 | 0.0107826466371171 | 0.00539132331855853 |
| 55 | 0.984046005240724 | 0.0319079895185526 | 0.0159539947592763 |
| Meta Analysis of Goldfeld-Quandt test for Heteroskedasticity | |||
| Description | # significant tests | % significant tests | OK/NOK |
| 1% type I error level | 0 | 0 | OK |
| 5% type I error level | 2 | 0.0392156862745098 | OK |
| 10% type I error level | 2 | 0.0392156862745098 | OK |