| Multiple Linear Regression - Estimated Regression Equation |
| PS[t] = + 3.58737153871768 -0.0094560197051181L[t] + 0.00508884300409277Wb[t] -0.00390837673295982Wbr[t] -0.000786575888854624Tg[t] + 0.810406161455018P[t] + 0.327261431599046S[t] -1.66026239739375D[t] + e[t] |
| Multiple Linear Regression - Ordinary Least Squares | |||||
| Variable | Parameter | S.D. | T-STAT H0: parameter = 0 | 2-tail p-value | 1-tail p-value |
| (Intercept) | 3.58737153871768 | 0.467805 | 7.6685 | 0 | 0 |
| L | -0.0094560197051181 | 0.011399 | -0.8295 | 0.412587 | 0.206293 |
| Wb | 0.00508884300409277 | 0.002756 | 1.8462 | 0.073579 | 0.03679 |
| Wbr | -0.00390837673295982 | 0.002151 | -1.8174 | 0.07798 | 0.03899 |
| Tg | -0.000786575888854624 | 0.002026 | -0.3882 | 0.700288 | 0.350144 |
| P | 0.810406161455018 | 0.373808 | 2.168 | 0.037252 | 0.018626 |
| S | 0.327261431599046 | 0.225862 | 1.4489 | 0.156514 | 0.078257 |
| D | -1.66026239739375 | 0.463823 | -3.5795 | 0.001061 | 0.00053 |
| Multiple Linear Regression - Regression Statistics | |
| Multiple R | 0.731211507658874 |
| R-squared | 0.534670268932763 |
| Adjusted R-squared | 0.438867089007155 |
| F-TEST (value) | 5.58092402932702 |
| F-TEST (DF numerator) | 7 |
| F-TEST (DF denominator) | 34 |
| p-value | 0.000242790446010499 |
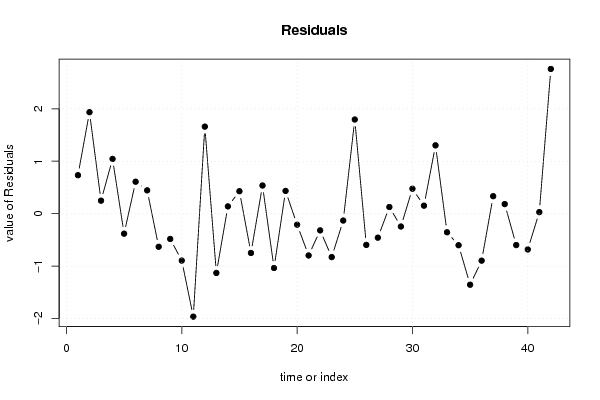
| Multiple Linear Regression - Residual Statistics | |
| Residual Standard Deviation | 1.04033754608211 |
| Sum Squared Residuals | 36.7982751327971 |
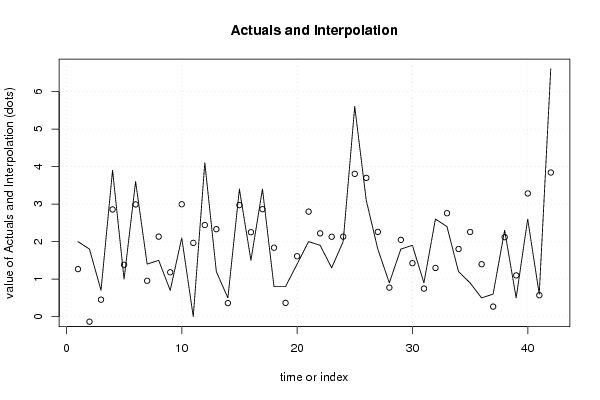
| Multiple Linear Regression - Actuals, Interpolation, and Residuals | |||
| Time or Index | Actuals | Interpolation Forecast | Residuals Prediction Error |
| 1 | 2 | 1.26720619236899 | 0.732793807631013 |
| 2 | 1.8 | -0.134470097765854 | 1.93447009776585 |
| 3 | 0.7 | 0.452565590439178 | 0.247434409560822 |
| 4 | 3.9 | 2.85652673424004 | 1.04347326575996 |
| 5 | 1 | 1.38215221827602 | -0.382152218276021 |
| 6 | 3.6 | 2.99136406719121 | 0.60863593280879 |
| 7 | 1.4 | 0.95599736839603 | 0.444002631603971 |
| 8 | 1.5 | 2.13182234320539 | -0.631822343205394 |
| 9 | 0.7 | 1.18275773995869 | -0.482757739958694 |
| 10 | 2.1 | 2.99511776457053 | -0.895117764570533 |
| 11 | 0 | 1.96491393058276 | -1.96491393058276 |
| 12 | 4.1 | 2.44077085930208 | 1.65922914069792 |
| 13 | 1.2 | 2.33092610337855 | -1.13092610337855 |
| 14 | 0.5 | 0.361888171190629 | 0.138111828809371 |
| 15 | 3.4 | 2.97256525325018 | 0.427434746749823 |
| 16 | 1.5 | 2.25009348125726 | -0.750093481257256 |
| 17 | 3.4 | 2.86362874938815 | 0.53637125061185 |
| 18 | 0.8 | 1.83642272362023 | -1.03642272362023 |
| 19 | 0.8 | 0.366431556972319 | 0.433568443027681 |
| 20 | 1.4 | 1.61085685824459 | -0.210856858244591 |
| 21 | 2 | 2.79757726125923 | -0.797577261259228 |
| 22 | 1.9 | 2.21950821050824 | -0.319508210508243 |
| 23 | 1.3 | 2.12881991170684 | -0.828819911706844 |
| 24 | 2 | 2.13191560802199 | -0.131915608021995 |
| 25 | 5.6 | 3.80519131225159 | 1.79480868774841 |
| 26 | 3.1 | 3.696692889041 | -0.596692889041002 |
| 27 | 1.8 | 2.25849768605185 | -0.458497686051852 |
| 28 | 0.9 | 0.773687927960818 | 0.126312072039182 |
| 29 | 1.8 | 2.04580599410783 | -0.245805994107826 |
| 30 | 1.9 | 1.42477360695551 | 0.475226393044487 |
| 31 | 0.9 | 0.748171317989398 | 0.151828682010602 |
| 32 | 2.6 | 1.29771099879576 | 1.30228900120424 |
| 33 | 2.4 | 2.75614233041578 | -0.356142330415776 |
| 34 | 1.2 | 1.80224281024561 | -0.602242810245615 |
| 35 | 0.9 | 2.25592632856774 | -1.35592632856774 |
| 36 | 0.5 | 1.39688946150080 | -0.896889461500795 |
| 37 | 0.6 | 0.267513443661074 | 0.332486556338926 |
| 38 | 2.3 | 2.11802868493976 | 0.181971315060242 |
| 39 | 0.5 | 1.10010610215389 | -0.60010610215389 |
| 40 | 2.6 | 3.28346086475779 | -0.683460864757789 |
| 41 | 0.6 | 0.571275001682291 | 0.0287249983177086 |
| 42 | 6.6 | 3.84052463935822 | 2.75947536064177 |
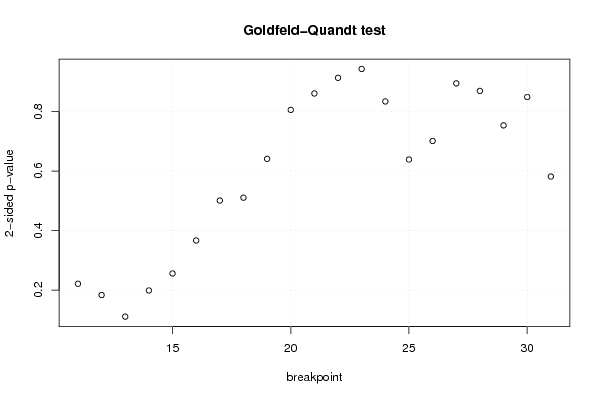
| Goldfeld-Quandt test for Heteroskedasticity | |||
| p-values | Alternative Hypothesis | ||
| breakpoint index | greater | 2-sided | less |
| 11 | 0.889415192356413 | 0.221169615287175 | 0.110584807643587 |
| 12 | 0.908310145515471 | 0.183379708969058 | 0.091689854484529 |
| 13 | 0.944663471821004 | 0.110673056357992 | 0.0553365281789958 |
| 14 | 0.900621473307166 | 0.198757053385669 | 0.0993785266928344 |
| 15 | 0.872015911749053 | 0.255968176501894 | 0.127984088250947 |
| 16 | 0.816609069227583 | 0.366781861544833 | 0.183390930772417 |
| 17 | 0.749466975169671 | 0.501066049660658 | 0.250533024830329 |
| 18 | 0.744648562825293 | 0.510702874349413 | 0.255351437174706 |
| 19 | 0.67935420003276 | 0.64129159993448 | 0.32064579996724 |
| 20 | 0.597003372397963 | 0.805993255204073 | 0.402996627602037 |
| 21 | 0.569372988344453 | 0.861254023311095 | 0.430627011655547 |
| 22 | 0.45685833620463 | 0.91371667240926 | 0.54314166379537 |
| 23 | 0.528185311856685 | 0.94362937628663 | 0.471814688143315 |
| 24 | 0.582818813948354 | 0.834362372103291 | 0.417181186051646 |
| 25 | 0.680487898828463 | 0.639024202343075 | 0.319512101171537 |
| 26 | 0.649243457016803 | 0.701513085966394 | 0.350756542983197 |
| 27 | 0.552399784585884 | 0.895200430828231 | 0.447600215414116 |
| 28 | 0.434884335469386 | 0.869768670938773 | 0.565115664530614 |
| 29 | 0.376963635713993 | 0.753927271427986 | 0.623036364286007 |
| 30 | 0.424585017592288 | 0.849170035184576 | 0.575414982407712 |
| 31 | 0.290907426716765 | 0.58181485343353 | 0.709092573283235 |
| Meta Analysis of Goldfeld-Quandt test for Heteroskedasticity | |||
| Description | # significant tests | % significant tests | OK/NOK |
| 1% type I error level | 0 | 0 | OK |
| 5% type I error level | 0 | 0 | OK |
| 10% type I error level | 0 | 0 | OK |