| Multiple Linear Regression - Estimated Regression Equation |
| SWS[t] = + 12.7894647555942 -0.000920360007190503Wb[t] -0.00407543480665229Wbr[t] -0.00545130109419674L[t] -0.0102385857977621Tg[t] + 1.43725443584876P[t] + 0.436070831135465S[t] -2.79782099005727D[t] + e[t] |
| Multiple Linear Regression - Ordinary Least Squares | |||||
| Variable | Parameter | S.D. | T-STAT H0: parameter = 0 | 2-tail p-value | 1-tail p-value |
| (Intercept) | 12.7894647555942 | 1.271119 | 10.0616 | 0 | 0 |
| Wb | -0.000920360007190503 | 0.00749 | -0.1229 | 0.902921 | 0.45146 |
| Wbr | -0.00407543480665229 | 0.005843 | -0.6974 | 0.490272 | 0.245136 |
| L | -0.00545130109419674 | 0.030974 | -0.176 | 0.86134 | 0.43067 |
| Tg | -0.0102385857977621 | 0.005506 | -1.8597 | 0.071604 | 0.035802 |
| P | 1.43725443584876 | 1.01571 | 1.415 | 0.166156 | 0.083078 |
| S | 0.436070831135465 | 0.613711 | 0.7105 | 0.48221 | 0.241105 |
| D | -2.79782099005727 | 1.260299 | -2.22 | 0.033193 | 0.016596 |
| Multiple Linear Regression - Regression Statistics | |
| Multiple R | 0.741625986682653 |
| R-squared | 0.550009104123018 |
| Adjusted R-squared | 0.457363919677757 |
| F-TEST (value) | 5.93672631142516 |
| F-TEST (DF numerator) | 7 |
| F-TEST (DF denominator) | 34 |
| p-value | 0.00014631561076639 |
| Multiple Linear Regression - Residual Statistics | |
| Residual Standard Deviation | 2.82680337537443 |
| Sum Squared Residuals | 271.68778898296 |
| Multiple Linear Regression - Actuals, Interpolation, and Residuals | |||
| Time or Index | Actuals | Interpolation Forecast | Residuals Prediction Error |
| 1 | 6.3 | 8.6598360620205 | -2.35983606202049 |
| 2 | 2.1 | 1.3041775619323 | 0.795822438067702 |
| 3 | 9.1 | 6.35764906488505 | 2.74235093511495 |
| 4 | 15.8 | 11.4018000100876 | 4.39819998991242 |
| 5 | 5.2 | 4.51230142497647 | 0.687698575023526 |
| 6 | 10.9 | 11.3946501427656 | -0.494650142765568 |
| 7 | 8.3 | 7.39647920902513 | 0.903520790974872 |
| 8 | 11 | 9.3190118202991 | 1.6809881797009 |
| 9 | 3.2 | 2.97452817167446 | 0.225471828325545 |
| 10 | 6.3 | 11.4117244133783 | -5.11172441337827 |
| 11 | 8.6 | 10.2765809022131 | -1.67658090221306 |
| 12 | 6.6 | 10.4607206775447 | -3.86072067754467 |
| 13 | 9.5 | 9.63458823630232 | -0.134588236302321 |
| 14 | 3.3 | 6.04820433730993 | -2.74820433730993 |
| 15 | 11 | 11.7523935891223 | -0.752393589122338 |
| 16 | 4.7 | 7.93689883985059 | -3.23689883985059 |
| 17 | 10.4 | 11.6662079880292 | -1.26620798802923 |
| 18 | 7.4 | 9.32963877660452 | -1.92963877660452 |
| 19 | 2.1 | 1.3271440997444 | 0.772855900255604 |
| 20 | 7.7 | 9.4217164967101 | -1.72171649671011 |
| 21 | 17.9 | 11.2211804540706 | 6.6788195459294 |
| 22 | 6.1 | 8.52369462070842 | -2.42369462070842 |
| 23 | 11.9 | 10.3674617240912 | 1.53253827590882 |
| 24 | 10.8 | 10.2616411130651 | 0.538358886934887 |
| 25 | 13.8 | 13.1258106044715 | 0.67418939552851 |
| 26 | 14.3 | 11.9896484926242 | 2.31035150737575 |
| 27 | 15.2 | 9.37600695492118 | 5.82399304507882 |
| 28 | 10 | 6.7629273927428 | 3.23707260725721 |
| 29 | 11.9 | 10.2128091026386 | 1.68719089736142 |
| 30 | 6.5 | 6.8565719804381 | -0.356571980438101 |
| 31 | 7.5 | 7.69980026310144 | -0.199800263101435 |
| 32 | 10.6 | 8.8947959367931 | 1.7052040632069 |
| 33 | 7.4 | 11.071686639953 | -3.67168663995302 |
| 34 | 8.4 | 8.8033829875778 | -0.403382987577802 |
| 35 | 5.7 | 8.54903690960705 | -2.84903690960705 |
| 36 | 4.9 | 7.1542515732095 | -2.25425157320951 |
| 37 | 3.2 | 5.74719241131617 | -2.54719241131617 |
| 38 | 11 | 9.85250184709661 | 1.14749815290339 |
| 39 | 4.9 | 7.00448806865105 | -2.10448806865105 |
| 40 | 13.2 | 11.8818927842225 | 1.31810721577753 |
| 41 | 9.7 | 6.13442012956122 | 3.56557987043878 |
| 42 | 12.8 | 13.1225461846633 | -0.322546184663286 |
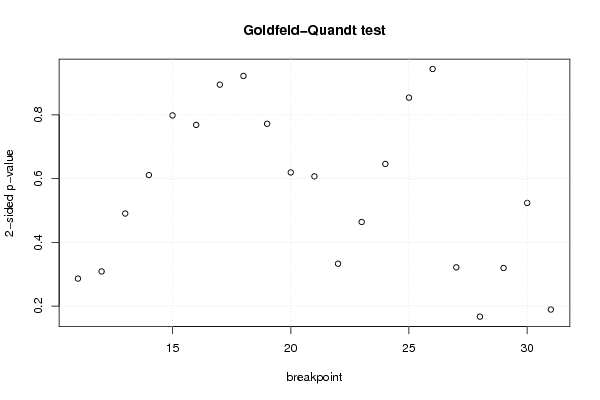
| Goldfeld-Quandt test for Heteroskedasticity | |||
| p-values | Alternative Hypothesis | ||
| breakpoint index | greater | 2-sided | less |
| 11 | 0.856868583750217 | 0.286262832499565 | 0.143131416249782 |
| 12 | 0.845675728554153 | 0.308648542891695 | 0.154324271445847 |
| 13 | 0.754751096787312 | 0.490497806425375 | 0.245248903212688 |
| 14 | 0.69444830114245 | 0.6111033977151 | 0.30555169885755 |
| 15 | 0.600845054765997 | 0.798309890468006 | 0.399154945234003 |
| 16 | 0.615677393970328 | 0.768645212059343 | 0.384322606029672 |
| 17 | 0.552557319840022 | 0.894885360319956 | 0.447442680159978 |
| 18 | 0.461189679929969 | 0.922379359859939 | 0.538810320070031 |
| 19 | 0.386077796341983 | 0.772155592683966 | 0.613922203658017 |
| 20 | 0.309751836622774 | 0.619503673245549 | 0.690248163377226 |
| 21 | 0.696441628799634 | 0.607116742400732 | 0.303558371200366 |
| 22 | 0.833507766906959 | 0.332984466186082 | 0.166492233093041 |
| 23 | 0.768032243482033 | 0.463935513035934 | 0.231967756517967 |
| 24 | 0.676908420262236 | 0.646183159475529 | 0.323091579737764 |
| 25 | 0.572910953347738 | 0.854178093304525 | 0.427089046652262 |
| 26 | 0.472124245771711 | 0.944248491543422 | 0.527875754228289 |
| 27 | 0.839199431853468 | 0.321601136293064 | 0.160800568146532 |
| 28 | 0.916626373141186 | 0.166747253717629 | 0.0833736268588143 |
| 29 | 0.840248852597185 | 0.31950229480563 | 0.159751147402815 |
| 30 | 0.738157753068605 | 0.52368449386279 | 0.261842246931395 |
| 31 | 0.905481060936367 | 0.189037878127266 | 0.0945189390636328 |
| Meta Analysis of Goldfeld-Quandt test for Heteroskedasticity | |||
| Description | # significant tests | % significant tests | OK/NOK |
| 1% type I error level | 0 | 0 | OK |
| 5% type I error level | 0 | 0 | OK |
| 10% type I error level | 0 | 0 | OK |