Free Statistics

of Irreproducible Research!

Author's title

Author*The author of this computation has been verified*
R Software Modulerwasp_multipleregression.wasp
Title produced by softwareMultiple Regression
Date of computationSat, 11 Dec 2010 14:55:59 +0000
Cite this page as followsStatistical Computations at FreeStatistics.org, Office for Research Development and Education, URL https://freestatistics.org/blog/index.php?v=date/2010/Dec/11/t1292079425xouwq4jwqdou5rt.htm/, Retrieved Mon, 06 May 2024 21:55:11 +0000
Statistical Computations at FreeStatistics.org, Office for Research Development and Education, URL https://freestatistics.org/blog/index.php?pk=108189, Retrieved Mon, 06 May 2024 21:55:11 +0000
QR Codes:

Original text written by user:
IsPrivate?No (this computation is public)
User-defined keywords
Estimated Impact147
Family? (F = Feedback message, R = changed R code, M = changed R Module, P = changed Parameters, D = changed Data)
-     [Kendall tau Correlation Matrix] [Pearsons Corr Mam...] [2010-12-09 13:00:40] [6ca0fc48dd5333d51a15728999009c83]
- RMPD    [Multiple Regression] [Bonus: MR PS] [2010-12-11 14:55:59] [b4ba846736d082ffaee409a197f454c7] [Current]
-    D      [Multiple Regression] [Bonus: MR PS 2 var] [2010-12-11 15:33:46] [6ca0fc48dd5333d51a15728999009c83]
Feedback Forum

Post a new message
Dataseries X:
2.0	4.5	1000,00	6600,00	42.0	3,00	1,00	3,00
1.8	69.0	2547000,00	4603000,00	624.0	3,00	5,00	4,00
0.7	27.0	10550,00	179500,00	180.0	4,00	4,00	4,00
3.9	19.0	0.023	0.300	35.0	1,00	1,00	1,00
1.0	30.4	160000,00	169000,00	392.0	4,00	5,00	4,00
3.6	28.0	3300,00	25600,00	63.0	1,00	2,00	1,00
1.4	50.0	52160,00	440000,00	230.0	1,00	1,00	1,00
1.5	7.0	0.425	6400,00	112.0	5,00	4,00	4,00
0.7	30.0	465000,00	423000,00	281.0	5,00	5,00	5,00
2.1	3.5	0.075	1200,00	42.0	1,00	1,00	1,00
4.1	6.0	0.785	3500,00	42.0	2,00	2,00	2,00
1.2	10.4	0.200	5000,00	120.0	2,00	2,00	2,00
0.5	20.0	27660,00	115000,00	148.0	5,00	5,00	5,00
3.4	3.9	0.120	1000,00	16.0	3,00	1,00	2,00
1.5	41.0	85000,00	325000,00	310.0	1,00	3,00	1,00
3.4	9.0	0.101	4000,00	28.0	5,00	1,00	3,00
0.8	7.6	1040,00	5500,00	68.0	5,00	3,00	4,00
0.8	46.0	521000,00	655000,00	336.0	5,00	5,00	5,00
2.0	24.0	0.010	0.250	50.0	1,00	1,00	1,00
1.9	100.0	62000,00	1320000,00	267.0	1,00	1,00	1,00
1.3	3.2	.023	0.400	19.0	4,00	1,00	3,00
5.6	5.0	1700,00	6300,00	12.0	2,00	1,00	1,00
3.1	6.5	3500,00	10800,00	120.0	2,00	1,00	1,00
1.8	12.0	0.480	15500,00	140.0	2,00	2,00	2,00
0.9	20.2	10000,00	115000,00	170.0	4,00	4,00	4,00
1.8	13.0	1620,00	11400,00	17.0	2,00	1,00	2,00
1.9	27.0	192000,00	180000,00	115.0	4,00	4,00	4,00
0.9	18.0	2500,00	12100,00	31.0	5,00	5,00	5,00
2.6	4.7	0.280	1900,00	21.0	3,00	1,00	3,00
2.4	9.8	4235,00	50400,00	52.0	1,00	1,00	1,00
1.2	29.0	6800,00	179000,00	164.0	2,00	3,00	2,00
0.9	7.0	0.750	12300,00	225.0	2,00	2,00	2,00
0.5	6.0	3600,00	21000,00	225.0	3,00	2,00	3,00
0.6	20.0	55500,00	175000,00	151.0	5,00	5,00	5,00
2.3	4.5	0.900	2600,00	60.0	2,00	1,00	2,00
0.5	7.5	2000,00	12300,00	200.0	3,00	1,00	3,00
2.6	2.3	0.104	2500,00	46.0	3,00	2,00	2,00
0.6	24.0	4190,00	58000,00	210.0	4,00	3,00	4,00
6.6	3.0	3500,00	3900,00	14.0	2,00	1,00	1,00


Summary of computational transaction
Raw Inputview raw input (R code)
Raw Outputview raw output of R engine
Computing time6 seconds
R Server'Gwilym Jenkins' @ 72.249.127.135

\begin{tabular}{lllllllll}
\hline
Summary of computational transaction \tabularnewline
Raw Input & view raw input (R code)  \tabularnewline
Raw Output & view raw output of R engine  \tabularnewline
Computing time & 6 seconds \tabularnewline
R Server & 'Gwilym Jenkins' @ 72.249.127.135 \tabularnewline
\hline
\end{tabular}
%Source: https://freestatistics.org/blog/index.php?pk=108189&T=0

[TABLE]
[ROW][C]Summary of computational transaction[/C][/ROW]
[ROW][C]Raw Input[/C][C]view raw input (R code) [/C][/ROW]
[ROW][C]Raw Output[/C][C]view raw output of R engine [/C][/ROW]
[ROW][C]Computing time[/C][C]6 seconds[/C][/ROW]
[ROW][C]R Server[/C][C]'Gwilym Jenkins' @ 72.249.127.135[/C][/ROW]
[/TABLE]
Source: https://freestatistics.org/blog/index.php?pk=108189&T=0

Globally Unique Identifier (entire table): ba.freestatistics.org/blog/index.php?pk=108189&T=0

As an alternative you can also use a QR Code:  

The GUIDs for individual cells are displayed in the table below:

Summary of computational transaction
Raw Inputview raw input (R code)
Raw Outputview raw output of R engine
Computing time6 seconds
R Server'Gwilym Jenkins' @ 72.249.127.135


Multiple Linear Regression - Estimated Regression Equation
PS[t] = + 3.80087752167087 + 0.0116286267514754L[t] + 3.56230226124492e-06Wb[t] -9.87715046978052e-07Wbr[t] -0.00728026813938717Tg[t] + 0.904135193634048P[t] + 0.261340559481030S[t] -1.67549920357273D[t] + e[t]

\begin{tabular}{lllllllll}
\hline
Multiple Linear Regression - Estimated Regression Equation \tabularnewline
PS[t] =  +  3.80087752167087 +  0.0116286267514754L[t] +  3.56230226124492e-06Wb[t] -9.87715046978052e-07Wbr[t] -0.00728026813938717Tg[t] +  0.904135193634048P[t] +  0.261340559481030S[t] -1.67549920357273D[t]  + e[t] \tabularnewline
\hline
\end{tabular}
%Source: https://freestatistics.org/blog/index.php?pk=108189&T=1

[TABLE]
[ROW][C]Multiple Linear Regression - Estimated Regression Equation[/C][/ROW]
[ROW][C]PS[t] =  +  3.80087752167087 +  0.0116286267514754L[t] +  3.56230226124492e-06Wb[t] -9.87715046978052e-07Wbr[t] -0.00728026813938717Tg[t] +  0.904135193634048P[t] +  0.261340559481030S[t] -1.67549920357273D[t]  + e[t][/C][/ROW]
[/TABLE]
Source: https://freestatistics.org/blog/index.php?pk=108189&T=1

Globally Unique Identifier (entire table): ba.freestatistics.org/blog/index.php?pk=108189&T=1

As an alternative you can also use a QR Code:  

The GUIDs for individual cells are displayed in the table below:

Multiple Linear Regression - Estimated Regression Equation
PS[t] = + 3.80087752167087 + 0.0116286267514754L[t] + 3.56230226124492e-06Wb[t] -9.87715046978052e-07Wbr[t] -0.00728026813938717Tg[t] + 0.904135193634048P[t] + 0.261340559481030S[t] -1.67549920357273D[t] + e[t]


Multiple Linear Regression - Ordinary Least Squares
VariableParameterS.D.T-STATH0: parameter = 02-tail p-value1-tail p-value
(Intercept)3.800877521670870.3819069.952400
L0.01162862675147540.0157480.73840.4658130.232907
Wb3.56230226124492e-062e-061.92230.0637970.031898
Wbr-9.87715046978052e-071e-06-0.88830.381240.19062
Tg-0.007280268139387170.00213-3.41840.0017820.000891
P0.9041351936340480.316772.85420.0076240.003812
S0.2613405594810300.201641.29610.2045160.102258
D-1.675499203572730.386851-4.33110.0001447.2e-05

\begin{tabular}{lllllllll}
\hline
Multiple Linear Regression - Ordinary Least Squares \tabularnewline
Variable & Parameter & S.D. & T-STATH0: parameter = 0 & 2-tail p-value & 1-tail p-value \tabularnewline
(Intercept) & 3.80087752167087 & 0.381906 & 9.9524 & 0 & 0 \tabularnewline
L & 0.0116286267514754 & 0.015748 & 0.7384 & 0.465813 & 0.232907 \tabularnewline
Wb & 3.56230226124492e-06 & 2e-06 & 1.9223 & 0.063797 & 0.031898 \tabularnewline
Wbr & -9.87715046978052e-07 & 1e-06 & -0.8883 & 0.38124 & 0.19062 \tabularnewline
Tg & -0.00728026813938717 & 0.00213 & -3.4184 & 0.001782 & 0.000891 \tabularnewline
P & 0.904135193634048 & 0.31677 & 2.8542 & 0.007624 & 0.003812 \tabularnewline
S & 0.261340559481030 & 0.20164 & 1.2961 & 0.204516 & 0.102258 \tabularnewline
D & -1.67549920357273 & 0.386851 & -4.3311 & 0.000144 & 7.2e-05 \tabularnewline
\hline
\end{tabular}
%Source: https://freestatistics.org/blog/index.php?pk=108189&T=2

[TABLE]
[ROW][C]Multiple Linear Regression - Ordinary Least Squares[/C][/ROW]
[ROW][C]Variable[/C][C]Parameter[/C][C]S.D.[/C][C]T-STATH0: parameter = 0[/C][C]2-tail p-value[/C][C]1-tail p-value[/C][/ROW]
[ROW][C](Intercept)[/C][C]3.80087752167087[/C][C]0.381906[/C][C]9.9524[/C][C]0[/C][C]0[/C][/ROW]
[ROW][C]L[/C][C]0.0116286267514754[/C][C]0.015748[/C][C]0.7384[/C][C]0.465813[/C][C]0.232907[/C][/ROW]
[ROW][C]Wb[/C][C]3.56230226124492e-06[/C][C]2e-06[/C][C]1.9223[/C][C]0.063797[/C][C]0.031898[/C][/ROW]
[ROW][C]Wbr[/C][C]-9.87715046978052e-07[/C][C]1e-06[/C][C]-0.8883[/C][C]0.38124[/C][C]0.19062[/C][/ROW]
[ROW][C]Tg[/C][C]-0.00728026813938717[/C][C]0.00213[/C][C]-3.4184[/C][C]0.001782[/C][C]0.000891[/C][/ROW]
[ROW][C]P[/C][C]0.904135193634048[/C][C]0.31677[/C][C]2.8542[/C][C]0.007624[/C][C]0.003812[/C][/ROW]
[ROW][C]S[/C][C]0.261340559481030[/C][C]0.20164[/C][C]1.2961[/C][C]0.204516[/C][C]0.102258[/C][/ROW]
[ROW][C]D[/C][C]-1.67549920357273[/C][C]0.386851[/C][C]-4.3311[/C][C]0.000144[/C][C]7.2e-05[/C][/ROW]
[/TABLE]
Source: https://freestatistics.org/blog/index.php?pk=108189&T=2

Globally Unique Identifier (entire table): ba.freestatistics.org/blog/index.php?pk=108189&T=2

As an alternative you can also use a QR Code:  

The GUIDs for individual cells are displayed in the table below:

Multiple Linear Regression - Ordinary Least Squares
VariableParameterS.D.T-STATH0: parameter = 02-tail p-value1-tail p-value
(Intercept)3.800877521670870.3819069.952400
L0.01162862675147540.0157480.73840.4658130.232907
Wb3.56230226124492e-062e-061.92230.0637970.031898
Wbr-9.87715046978052e-071e-06-0.88830.381240.19062
Tg-0.007280268139387170.00213-3.41840.0017820.000891
P0.9041351936340480.316772.85420.0076240.003812
S0.2613405594810300.201641.29610.2045160.102258
D-1.675499203572730.386851-4.33110.0001447.2e-05


Multiple Linear Regression - Regression Statistics
Multiple R0.831306208882482
R-squared0.691070012926565
Adjusted R-squared0.621311628748692
F-TEST (value)9.9066229969497
F-TEST (DF numerator)7
F-TEST (DF denominator)31
p-value1.95327288599056e-06
Multiple Linear Regression - Residual Statistics
Residual Standard Deviation0.864957965555126
Sum Squared Residuals23.1927207474952

\begin{tabular}{lllllllll}
\hline
Multiple Linear Regression - Regression Statistics \tabularnewline
Multiple R & 0.831306208882482 \tabularnewline
R-squared & 0.691070012926565 \tabularnewline
Adjusted R-squared & 0.621311628748692 \tabularnewline
F-TEST (value) & 9.9066229969497 \tabularnewline
F-TEST (DF numerator) & 7 \tabularnewline
F-TEST (DF denominator) & 31 \tabularnewline
p-value & 1.95327288599056e-06 \tabularnewline
Multiple Linear Regression - Residual Statistics \tabularnewline
Residual Standard Deviation & 0.864957965555126 \tabularnewline
Sum Squared Residuals & 23.1927207474952 \tabularnewline
\hline
\end{tabular}
%Source: https://freestatistics.org/blog/index.php?pk=108189&T=3

[TABLE]
[ROW][C]Multiple Linear Regression - Regression Statistics[/C][/ROW]
[ROW][C]Multiple R[/C][C]0.831306208882482[/C][/ROW]
[ROW][C]R-squared[/C][C]0.691070012926565[/C][/ROW]
[ROW][C]Adjusted R-squared[/C][C]0.621311628748692[/C][/ROW]
[ROW][C]F-TEST (value)[/C][C]9.9066229969497[/C][/ROW]
[ROW][C]F-TEST (DF numerator)[/C][C]7[/C][/ROW]
[ROW][C]F-TEST (DF denominator)[/C][C]31[/C][/ROW]
[ROW][C]p-value[/C][C]1.95327288599056e-06[/C][/ROW]
[ROW][C]Multiple Linear Regression - Residual Statistics[/C][/ROW]
[ROW][C]Residual Standard Deviation[/C][C]0.864957965555126[/C][/ROW]
[ROW][C]Sum Squared Residuals[/C][C]23.1927207474952[/C][/ROW]
[/TABLE]
Source: https://freestatistics.org/blog/index.php?pk=108189&T=3

Globally Unique Identifier (entire table): ba.freestatistics.org/blog/index.php?pk=108189&T=3

As an alternative you can also use a QR Code:  

The GUIDs for individual cells are displayed in the table below:

Multiple Linear Regression - Regression Statistics
Multiple R0.831306208882482
R-squared0.691070012926565
Adjusted R-squared0.621311628748692
F-TEST (value)9.9066229969497
F-TEST (DF numerator)7
F-TEST (DF denominator)31
p-value1.95327288599056e-06
Multiple Linear Regression - Residual Statistics
Residual Standard Deviation0.864957965555126
Sum Squared Residuals23.1927207474952


Multiple Linear Regression - Actuals, Interpolation, and Residuals
Time or IndexActualsInterpolationForecastResidualsPrediction Error
121.491726992814420.508273007185578
21.81.90420851071227-0.104208510712273
30.70.6245958149639620.0754041850360376
43.93.256988380231140.643011619768864
51-0.07518605921374541.07518605921375
63.63.405609379213630.194390620786369
71.41.94903880200413-0.549038802004129
81.51.92460940680106-0.424609406801063
90.70.792530811366229-0.0925308113662289
102.13.02459801210541-0.924598012105413
114.12.5413769131531.55862308684700
121.22.02319829947000-0.823198299470005
130.50.3907991699263560.109200830073644
143.43.351505321438430.0484946785615689
151.52.01521406571369-0.515214065713694
163.43.45325607106899-0.053256071068995
170.81.99517004541947-1.19517004541947
180.80.5485131274543480.251486872545652
1923.20592749497353-1.20592749497353
201.91.426964031330540.473035968669461
211.32.55114744277319-1.25114744277319
225.64.165602489980151.43439751001985
233.13.39874389741239-0.298743897412388
241.81.88582872893599-0.0858287289359854
250.90.6800721887342040.219927811265796
261.82.54140862880179-0.741408628801795
271.91.743699131803530.156300868196467
280.91.23134164217282-0.331341642172823
292.61.648019304996020.951980695003978
302.42.99154618183822-0.59154618183822
311.22.03286004313727-0.832860043137274
320.91.21202445330264-0.312024453302640
330.50.4332603121175540.0667396878824456
340.60.4088699576425710.191130042357429
352.32.132437940242830.167562059757169
360.50.3742628335391350.125737166460865
372.63.37435040436818-0.774350404368182
380.60.207312466873210.39268753312679
396.64.136567360381412.46343263961859

\begin{tabular}{lllllllll}
\hline
Multiple Linear Regression - Actuals, Interpolation, and Residuals \tabularnewline
Time or Index & Actuals & InterpolationForecast & ResidualsPrediction Error \tabularnewline
1 & 2 & 1.49172699281442 & 0.508273007185578 \tabularnewline
2 & 1.8 & 1.90420851071227 & -0.104208510712273 \tabularnewline
3 & 0.7 & 0.624595814963962 & 0.0754041850360376 \tabularnewline
4 & 3.9 & 3.25698838023114 & 0.643011619768864 \tabularnewline
5 & 1 & -0.0751860592137454 & 1.07518605921375 \tabularnewline
6 & 3.6 & 3.40560937921363 & 0.194390620786369 \tabularnewline
7 & 1.4 & 1.94903880200413 & -0.549038802004129 \tabularnewline
8 & 1.5 & 1.92460940680106 & -0.424609406801063 \tabularnewline
9 & 0.7 & 0.792530811366229 & -0.0925308113662289 \tabularnewline
10 & 2.1 & 3.02459801210541 & -0.924598012105413 \tabularnewline
11 & 4.1 & 2.541376913153 & 1.55862308684700 \tabularnewline
12 & 1.2 & 2.02319829947000 & -0.823198299470005 \tabularnewline
13 & 0.5 & 0.390799169926356 & 0.109200830073644 \tabularnewline
14 & 3.4 & 3.35150532143843 & 0.0484946785615689 \tabularnewline
15 & 1.5 & 2.01521406571369 & -0.515214065713694 \tabularnewline
16 & 3.4 & 3.45325607106899 & -0.053256071068995 \tabularnewline
17 & 0.8 & 1.99517004541947 & -1.19517004541947 \tabularnewline
18 & 0.8 & 0.548513127454348 & 0.251486872545652 \tabularnewline
19 & 2 & 3.20592749497353 & -1.20592749497353 \tabularnewline
20 & 1.9 & 1.42696403133054 & 0.473035968669461 \tabularnewline
21 & 1.3 & 2.55114744277319 & -1.25114744277319 \tabularnewline
22 & 5.6 & 4.16560248998015 & 1.43439751001985 \tabularnewline
23 & 3.1 & 3.39874389741239 & -0.298743897412388 \tabularnewline
24 & 1.8 & 1.88582872893599 & -0.0858287289359854 \tabularnewline
25 & 0.9 & 0.680072188734204 & 0.219927811265796 \tabularnewline
26 & 1.8 & 2.54140862880179 & -0.741408628801795 \tabularnewline
27 & 1.9 & 1.74369913180353 & 0.156300868196467 \tabularnewline
28 & 0.9 & 1.23134164217282 & -0.331341642172823 \tabularnewline
29 & 2.6 & 1.64801930499602 & 0.951980695003978 \tabularnewline
30 & 2.4 & 2.99154618183822 & -0.59154618183822 \tabularnewline
31 & 1.2 & 2.03286004313727 & -0.832860043137274 \tabularnewline
32 & 0.9 & 1.21202445330264 & -0.312024453302640 \tabularnewline
33 & 0.5 & 0.433260312117554 & 0.0667396878824456 \tabularnewline
34 & 0.6 & 0.408869957642571 & 0.191130042357429 \tabularnewline
35 & 2.3 & 2.13243794024283 & 0.167562059757169 \tabularnewline
36 & 0.5 & 0.374262833539135 & 0.125737166460865 \tabularnewline
37 & 2.6 & 3.37435040436818 & -0.774350404368182 \tabularnewline
38 & 0.6 & 0.20731246687321 & 0.39268753312679 \tabularnewline
39 & 6.6 & 4.13656736038141 & 2.46343263961859 \tabularnewline
\hline
\end{tabular}
%Source: https://freestatistics.org/blog/index.php?pk=108189&T=4

[TABLE]
[ROW][C]Multiple Linear Regression - Actuals, Interpolation, and Residuals[/C][/ROW]
[ROW][C]Time or Index[/C][C]Actuals[/C][C]InterpolationForecast[/C][C]ResidualsPrediction Error[/C][/ROW]
[ROW][C]1[/C][C]2[/C][C]1.49172699281442[/C][C]0.508273007185578[/C][/ROW]
[ROW][C]2[/C][C]1.8[/C][C]1.90420851071227[/C][C]-0.104208510712273[/C][/ROW]
[ROW][C]3[/C][C]0.7[/C][C]0.624595814963962[/C][C]0.0754041850360376[/C][/ROW]
[ROW][C]4[/C][C]3.9[/C][C]3.25698838023114[/C][C]0.643011619768864[/C][/ROW]
[ROW][C]5[/C][C]1[/C][C]-0.0751860592137454[/C][C]1.07518605921375[/C][/ROW]
[ROW][C]6[/C][C]3.6[/C][C]3.40560937921363[/C][C]0.194390620786369[/C][/ROW]
[ROW][C]7[/C][C]1.4[/C][C]1.94903880200413[/C][C]-0.549038802004129[/C][/ROW]
[ROW][C]8[/C][C]1.5[/C][C]1.92460940680106[/C][C]-0.424609406801063[/C][/ROW]
[ROW][C]9[/C][C]0.7[/C][C]0.792530811366229[/C][C]-0.0925308113662289[/C][/ROW]
[ROW][C]10[/C][C]2.1[/C][C]3.02459801210541[/C][C]-0.924598012105413[/C][/ROW]
[ROW][C]11[/C][C]4.1[/C][C]2.541376913153[/C][C]1.55862308684700[/C][/ROW]
[ROW][C]12[/C][C]1.2[/C][C]2.02319829947000[/C][C]-0.823198299470005[/C][/ROW]
[ROW][C]13[/C][C]0.5[/C][C]0.390799169926356[/C][C]0.109200830073644[/C][/ROW]
[ROW][C]14[/C][C]3.4[/C][C]3.35150532143843[/C][C]0.0484946785615689[/C][/ROW]
[ROW][C]15[/C][C]1.5[/C][C]2.01521406571369[/C][C]-0.515214065713694[/C][/ROW]
[ROW][C]16[/C][C]3.4[/C][C]3.45325607106899[/C][C]-0.053256071068995[/C][/ROW]
[ROW][C]17[/C][C]0.8[/C][C]1.99517004541947[/C][C]-1.19517004541947[/C][/ROW]
[ROW][C]18[/C][C]0.8[/C][C]0.548513127454348[/C][C]0.251486872545652[/C][/ROW]
[ROW][C]19[/C][C]2[/C][C]3.20592749497353[/C][C]-1.20592749497353[/C][/ROW]
[ROW][C]20[/C][C]1.9[/C][C]1.42696403133054[/C][C]0.473035968669461[/C][/ROW]
[ROW][C]21[/C][C]1.3[/C][C]2.55114744277319[/C][C]-1.25114744277319[/C][/ROW]
[ROW][C]22[/C][C]5.6[/C][C]4.16560248998015[/C][C]1.43439751001985[/C][/ROW]
[ROW][C]23[/C][C]3.1[/C][C]3.39874389741239[/C][C]-0.298743897412388[/C][/ROW]
[ROW][C]24[/C][C]1.8[/C][C]1.88582872893599[/C][C]-0.0858287289359854[/C][/ROW]
[ROW][C]25[/C][C]0.9[/C][C]0.680072188734204[/C][C]0.219927811265796[/C][/ROW]
[ROW][C]26[/C][C]1.8[/C][C]2.54140862880179[/C][C]-0.741408628801795[/C][/ROW]
[ROW][C]27[/C][C]1.9[/C][C]1.74369913180353[/C][C]0.156300868196467[/C][/ROW]
[ROW][C]28[/C][C]0.9[/C][C]1.23134164217282[/C][C]-0.331341642172823[/C][/ROW]
[ROW][C]29[/C][C]2.6[/C][C]1.64801930499602[/C][C]0.951980695003978[/C][/ROW]
[ROW][C]30[/C][C]2.4[/C][C]2.99154618183822[/C][C]-0.59154618183822[/C][/ROW]
[ROW][C]31[/C][C]1.2[/C][C]2.03286004313727[/C][C]-0.832860043137274[/C][/ROW]
[ROW][C]32[/C][C]0.9[/C][C]1.21202445330264[/C][C]-0.312024453302640[/C][/ROW]
[ROW][C]33[/C][C]0.5[/C][C]0.433260312117554[/C][C]0.0667396878824456[/C][/ROW]
[ROW][C]34[/C][C]0.6[/C][C]0.408869957642571[/C][C]0.191130042357429[/C][/ROW]
[ROW][C]35[/C][C]2.3[/C][C]2.13243794024283[/C][C]0.167562059757169[/C][/ROW]
[ROW][C]36[/C][C]0.5[/C][C]0.374262833539135[/C][C]0.125737166460865[/C][/ROW]
[ROW][C]37[/C][C]2.6[/C][C]3.37435040436818[/C][C]-0.774350404368182[/C][/ROW]
[ROW][C]38[/C][C]0.6[/C][C]0.20731246687321[/C][C]0.39268753312679[/C][/ROW]
[ROW][C]39[/C][C]6.6[/C][C]4.13656736038141[/C][C]2.46343263961859[/C][/ROW]
[/TABLE]
Source: https://freestatistics.org/blog/index.php?pk=108189&T=4

Globally Unique Identifier (entire table): ba.freestatistics.org/blog/index.php?pk=108189&T=4

As an alternative you can also use a QR Code:  

The GUIDs for individual cells are displayed in the table below:

Multiple Linear Regression - Actuals, Interpolation, and Residuals
Time or IndexActualsInterpolationForecastResidualsPrediction Error
121.491726992814420.508273007185578
21.81.90420851071227-0.104208510712273
30.70.6245958149639620.0754041850360376
43.93.256988380231140.643011619768864
51-0.07518605921374541.07518605921375
63.63.405609379213630.194390620786369
71.41.94903880200413-0.549038802004129
81.51.92460940680106-0.424609406801063
90.70.792530811366229-0.0925308113662289
102.13.02459801210541-0.924598012105413
114.12.5413769131531.55862308684700
121.22.02319829947000-0.823198299470005
130.50.3907991699263560.109200830073644
143.43.351505321438430.0484946785615689
151.52.01521406571369-0.515214065713694
163.43.45325607106899-0.053256071068995
170.81.99517004541947-1.19517004541947
180.80.5485131274543480.251486872545652
1923.20592749497353-1.20592749497353
201.91.426964031330540.473035968669461
211.32.55114744277319-1.25114744277319
225.64.165602489980151.43439751001985
233.13.39874389741239-0.298743897412388
241.81.88582872893599-0.0858287289359854
250.90.6800721887342040.219927811265796
261.82.54140862880179-0.741408628801795
271.91.743699131803530.156300868196467
280.91.23134164217282-0.331341642172823
292.61.648019304996020.951980695003978
302.42.99154618183822-0.59154618183822
311.22.03286004313727-0.832860043137274
320.91.21202445330264-0.312024453302640
330.50.4332603121175540.0667396878824456
340.60.4088699576425710.191130042357429
352.32.132437940242830.167562059757169
360.50.3742628335391350.125737166460865
372.63.37435040436818-0.774350404368182
380.60.207312466873210.39268753312679
396.64.136567360381412.46343263961859


Goldfeld-Quandt test for Heteroskedasticity
p-valuesAlternative Hypothesis
breakpoint indexgreater2-sidedless
110.7898814746083410.4202370507833180.210118525391659
120.7942504375387760.4114991249224480.205749562461224
130.6974965887140720.6050068225718560.302503411285928
140.5914139125664380.8171721748671250.408586087433562
150.4664452678858620.9328905357717240.533554732114138
160.3539976786086080.7079953572172160.646002321391392
170.4075016578672890.8150033157345790.592498342132711
180.3015904797506710.6031809595013420.698409520249329
190.3086953478726480.6173906957452960.691304652127352
200.2413223212604270.4826446425208550.758677678739573
210.4395565644232030.8791131288464050.560443435576797
220.5493263158822390.9013473682355230.450673684117761
230.4868740122199950.973748024439990.513125987780005
240.3727540059052140.7455080118104290.627245994094786
250.2675478187316570.5350956374633130.732452181268343
260.2324641878104000.4649283756207990.7675358121896
270.2473124155004850.4946248310009690.752687584499515
280.1530491118286720.3060982236573430.846950888171328

\begin{tabular}{lllllllll}
\hline
Goldfeld-Quandt test for Heteroskedasticity \tabularnewline
p-values & Alternative Hypothesis \tabularnewline
breakpoint index & greater & 2-sided & less \tabularnewline
11 & 0.789881474608341 & 0.420237050783318 & 0.210118525391659 \tabularnewline
12 & 0.794250437538776 & 0.411499124922448 & 0.205749562461224 \tabularnewline
13 & 0.697496588714072 & 0.605006822571856 & 0.302503411285928 \tabularnewline
14 & 0.591413912566438 & 0.817172174867125 & 0.408586087433562 \tabularnewline
15 & 0.466445267885862 & 0.932890535771724 & 0.533554732114138 \tabularnewline
16 & 0.353997678608608 & 0.707995357217216 & 0.646002321391392 \tabularnewline
17 & 0.407501657867289 & 0.815003315734579 & 0.592498342132711 \tabularnewline
18 & 0.301590479750671 & 0.603180959501342 & 0.698409520249329 \tabularnewline
19 & 0.308695347872648 & 0.617390695745296 & 0.691304652127352 \tabularnewline
20 & 0.241322321260427 & 0.482644642520855 & 0.758677678739573 \tabularnewline
21 & 0.439556564423203 & 0.879113128846405 & 0.560443435576797 \tabularnewline
22 & 0.549326315882239 & 0.901347368235523 & 0.450673684117761 \tabularnewline
23 & 0.486874012219995 & 0.97374802443999 & 0.513125987780005 \tabularnewline
24 & 0.372754005905214 & 0.745508011810429 & 0.627245994094786 \tabularnewline
25 & 0.267547818731657 & 0.535095637463313 & 0.732452181268343 \tabularnewline
26 & 0.232464187810400 & 0.464928375620799 & 0.7675358121896 \tabularnewline
27 & 0.247312415500485 & 0.494624831000969 & 0.752687584499515 \tabularnewline
28 & 0.153049111828672 & 0.306098223657343 & 0.846950888171328 \tabularnewline
\hline
\end{tabular}
%Source: https://freestatistics.org/blog/index.php?pk=108189&T=5

[TABLE]
[ROW][C]Goldfeld-Quandt test for Heteroskedasticity[/C][/ROW]
[ROW][C]p-values[/C][C]Alternative Hypothesis[/C][/ROW]
[ROW][C]breakpoint index[/C][C]greater[/C][C]2-sided[/C][C]less[/C][/ROW]
[ROW][C]11[/C][C]0.789881474608341[/C][C]0.420237050783318[/C][C]0.210118525391659[/C][/ROW]
[ROW][C]12[/C][C]0.794250437538776[/C][C]0.411499124922448[/C][C]0.205749562461224[/C][/ROW]
[ROW][C]13[/C][C]0.697496588714072[/C][C]0.605006822571856[/C][C]0.302503411285928[/C][/ROW]
[ROW][C]14[/C][C]0.591413912566438[/C][C]0.817172174867125[/C][C]0.408586087433562[/C][/ROW]
[ROW][C]15[/C][C]0.466445267885862[/C][C]0.932890535771724[/C][C]0.533554732114138[/C][/ROW]
[ROW][C]16[/C][C]0.353997678608608[/C][C]0.707995357217216[/C][C]0.646002321391392[/C][/ROW]
[ROW][C]17[/C][C]0.407501657867289[/C][C]0.815003315734579[/C][C]0.592498342132711[/C][/ROW]
[ROW][C]18[/C][C]0.301590479750671[/C][C]0.603180959501342[/C][C]0.698409520249329[/C][/ROW]
[ROW][C]19[/C][C]0.308695347872648[/C][C]0.617390695745296[/C][C]0.691304652127352[/C][/ROW]
[ROW][C]20[/C][C]0.241322321260427[/C][C]0.482644642520855[/C][C]0.758677678739573[/C][/ROW]
[ROW][C]21[/C][C]0.439556564423203[/C][C]0.879113128846405[/C][C]0.560443435576797[/C][/ROW]
[ROW][C]22[/C][C]0.549326315882239[/C][C]0.901347368235523[/C][C]0.450673684117761[/C][/ROW]
[ROW][C]23[/C][C]0.486874012219995[/C][C]0.97374802443999[/C][C]0.513125987780005[/C][/ROW]
[ROW][C]24[/C][C]0.372754005905214[/C][C]0.745508011810429[/C][C]0.627245994094786[/C][/ROW]
[ROW][C]25[/C][C]0.267547818731657[/C][C]0.535095637463313[/C][C]0.732452181268343[/C][/ROW]
[ROW][C]26[/C][C]0.232464187810400[/C][C]0.464928375620799[/C][C]0.7675358121896[/C][/ROW]
[ROW][C]27[/C][C]0.247312415500485[/C][C]0.494624831000969[/C][C]0.752687584499515[/C][/ROW]
[ROW][C]28[/C][C]0.153049111828672[/C][C]0.306098223657343[/C][C]0.846950888171328[/C][/ROW]
[/TABLE]
Source: https://freestatistics.org/blog/index.php?pk=108189&T=5

Globally Unique Identifier (entire table): ba.freestatistics.org/blog/index.php?pk=108189&T=5

As an alternative you can also use a QR Code:  

The GUIDs for individual cells are displayed in the table below:

Goldfeld-Quandt test for Heteroskedasticity
p-valuesAlternative Hypothesis
breakpoint indexgreater2-sidedless
110.7898814746083410.4202370507833180.210118525391659
120.7942504375387760.4114991249224480.205749562461224
130.6974965887140720.6050068225718560.302503411285928
140.5914139125664380.8171721748671250.408586087433562
150.4664452678858620.9328905357717240.533554732114138
160.3539976786086080.7079953572172160.646002321391392
170.4075016578672890.8150033157345790.592498342132711
180.3015904797506710.6031809595013420.698409520249329
190.3086953478726480.6173906957452960.691304652127352
200.2413223212604270.4826446425208550.758677678739573
210.4395565644232030.8791131288464050.560443435576797
220.5493263158822390.9013473682355230.450673684117761
230.4868740122199950.973748024439990.513125987780005
240.3727540059052140.7455080118104290.627245994094786
250.2675478187316570.5350956374633130.732452181268343
260.2324641878104000.4649283756207990.7675358121896
270.2473124155004850.4946248310009690.752687584499515
280.1530491118286720.3060982236573430.846950888171328


Meta Analysis of Goldfeld-Quandt test for Heteroskedasticity
Description# significant tests% significant testsOK/NOK
1% type I error level00OK
5% type I error level00OK
10% type I error level00OK

\begin{tabular}{lllllllll}
\hline
Meta Analysis of Goldfeld-Quandt test for Heteroskedasticity \tabularnewline
Description & # significant tests & % significant tests & OK/NOK \tabularnewline
1% type I error level & 0 & 0 & OK \tabularnewline
5% type I error level & 0 & 0 & OK \tabularnewline
10% type I error level & 0 & 0 & OK \tabularnewline
\hline
\end{tabular}
%Source: https://freestatistics.org/blog/index.php?pk=108189&T=6

[TABLE]
[ROW][C]Meta Analysis of Goldfeld-Quandt test for Heteroskedasticity[/C][/ROW]
[ROW][C]Description[/C][C]# significant tests[/C][C]% significant tests[/C][C]OK/NOK[/C][/ROW]
[ROW][C]1% type I error level[/C][C]0[/C][C]0[/C][C]OK[/C][/ROW]
[ROW][C]5% type I error level[/C][C]0[/C][C]0[/C][C]OK[/C][/ROW]
[ROW][C]10% type I error level[/C][C]0[/C][C]0[/C][C]OK[/C][/ROW]
[/TABLE]
Source: https://freestatistics.org/blog/index.php?pk=108189&T=6

Globally Unique Identifier (entire table): ba.freestatistics.org/blog/index.php?pk=108189&T=6

As an alternative you can also use a QR Code:  

The GUIDs for individual cells are displayed in the table below:

Meta Analysis of Goldfeld-Quandt test for Heteroskedasticity
Description# significant tests% significant testsOK/NOK
1% type I error level00OK
5% type I error level00OK
10% type I error level00OK


Parameters (Session):
par1 = 1 ; par2 = Do not include Seasonal Dummies ; par3 = No Linear Trend ;
Parameters (R input):
par1 = 1 ; par2 = Do not include Seasonal Dummies ; par3 = No Linear Trend ;
R code (references can be found in the software module):
library(lattice)
library(lmtest)
n25 <- 25 #minimum number of obs. for Goldfeld-Quandt test
par1 <- as.numeric(par1)
x <- t(y)
k <- length(x[1,])
n <- length(x[,1])
x1 <- cbind(x[,par1], x[,1:k!=par1])
mycolnames <- c(colnames(x)[par1], colnames(x)[1:k!=par1])
colnames(x1) <- mycolnames #colnames(x)[par1]
x <- x1
if (par3 == 'First Differences'){
x2 <- array(0, dim=c(n-1,k), dimnames=list(1:(n-1), paste('(1-B)',colnames(x),sep='')))
for (i in 1:n-1) {
for (j in 1:k) {
x2[i,j] <- x[i+1,j] - x[i,j]
}
}
x <- x2
}
if (par2 == 'Include Monthly Dummies'){
x2 <- array(0, dim=c(n,11), dimnames=list(1:n, paste('M', seq(1:11), sep ='')))
for (i in 1:11){
x2[seq(i,n,12),i] <- 1
}
x <- cbind(x, x2)
}
if (par2 == 'Include Quarterly Dummies'){
x2 <- array(0, dim=c(n,3), dimnames=list(1:n, paste('Q', seq(1:3), sep ='')))
for (i in 1:3){
x2[seq(i,n,4),i] <- 1
}
x <- cbind(x, x2)
}
k <- length(x[1,])
if (par3 == 'Linear Trend'){
x <- cbind(x, c(1:n))
colnames(x)[k+1] <- 't'
}
x
k <- length(x[1,])
df <- as.data.frame(x)
(mylm <- lm(df))
(mysum <- summary(mylm))
if (n > n25) {
kp3 <- k + 3
nmkm3 <- n - k - 3
gqarr <- array(NA, dim=c(nmkm3-kp3+1,3))
numgqtests <- 0
numsignificant1 <- 0
numsignificant5 <- 0
numsignificant10 <- 0
for (mypoint in kp3:nmkm3) {
j <- 0
numgqtests <- numgqtests + 1
for (myalt in c('greater', 'two.sided', 'less')) {
j <- j + 1
gqarr[mypoint-kp3+1,j] <- gqtest(mylm, point=mypoint, alternative=myalt)$p.value
}
if (gqarr[mypoint-kp3+1,2] < 0.01) numsignificant1 <- numsignificant1 + 1
if (gqarr[mypoint-kp3+1,2] < 0.05) numsignificant5 <- numsignificant5 + 1
if (gqarr[mypoint-kp3+1,2] < 0.10) numsignificant10 <- numsignificant10 + 1
}
gqarr
}
bitmap(file='test0.png')
plot(x[,1], type='l', main='Actuals and Interpolation', ylab='value of Actuals and Interpolation (dots)', xlab='time or index')
points(x[,1]-mysum$resid)
grid()
dev.off()
bitmap(file='test1.png')
plot(mysum$resid, type='b', pch=19, main='Residuals', ylab='value of Residuals', xlab='time or index')
grid()
dev.off()
bitmap(file='test2.png')
hist(mysum$resid, main='Residual Histogram', xlab='values of Residuals')
grid()
dev.off()
bitmap(file='test3.png')
densityplot(~mysum$resid,col='black',main='Residual Density Plot', xlab='values of Residuals')
dev.off()
bitmap(file='test4.png')
qqnorm(mysum$resid, main='Residual Normal Q-Q Plot')
qqline(mysum$resid)
grid()
dev.off()
(myerror <- as.ts(mysum$resid))
bitmap(file='test5.png')
dum <- cbind(lag(myerror,k=1),myerror)
dum
dum1 <- dum[2:length(myerror),]
dum1
z <- as.data.frame(dum1)
z
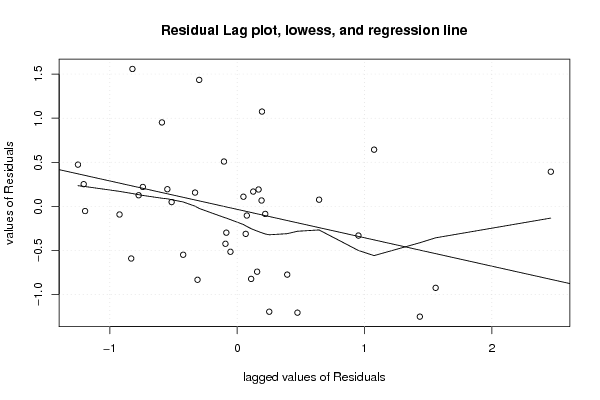
plot(z,main=paste('Residual Lag plot, lowess, and regression line'), ylab='values of Residuals', xlab='lagged values of Residuals')
lines(lowess(z))
abline(lm(z))
grid()
dev.off()
bitmap(file='test6.png')
acf(mysum$resid, lag.max=length(mysum$resid)/2, main='Residual Autocorrelation Function')
grid()
dev.off()
bitmap(file='test7.png')
pacf(mysum$resid, lag.max=length(mysum$resid)/2, main='Residual Partial Autocorrelation Function')
grid()
dev.off()
bitmap(file='test8.png')
opar <- par(mfrow = c(2,2), oma = c(0, 0, 1.1, 0))
plot(mylm, las = 1, sub='Residual Diagnostics')
par(opar)
dev.off()
if (n > n25) {
bitmap(file='test9.png')
plot(kp3:nmkm3,gqarr[,2], main='Goldfeld-Quandt test',ylab='2-sided p-value',xlab='breakpoint')
grid()
dev.off()
}
load(file='createtable')
a<-table.start()
a<-table.row.start(a)
a<-table.element(a, 'Multiple Linear Regression - Estimated Regression Equation', 1, TRUE)
a<-table.row.end(a)
myeq <- colnames(x)[1]
myeq <- paste(myeq, '[t] = ', sep='')
for (i in 1:k){
if (mysum$coefficients[i,1] > 0) myeq <- paste(myeq, '+', '')
myeq <- paste(myeq, mysum$coefficients[i,1], sep=' ')
if (rownames(mysum$coefficients)[i] != '(Intercept)') {
myeq <- paste(myeq, rownames(mysum$coefficients)[i], sep='')
if (rownames(mysum$coefficients)[i] != 't') myeq <- paste(myeq, '[t]', sep='')
}
}
myeq <- paste(myeq, ' + e[t]')
a<-table.row.start(a)
a<-table.element(a, myeq)
a<-table.row.end(a)
a<-table.end(a)
table.save(a,file='mytable1.tab')
a<-table.start()
a<-table.row.start(a)
a<-table.element(a,hyperlink('ols1.htm','Multiple Linear Regression - Ordinary Least Squares',''), 6, TRUE)
a<-table.row.end(a)
a<-table.row.start(a)
a<-table.element(a,'Variable',header=TRUE)
a<-table.element(a,'Parameter',header=TRUE)
a<-table.element(a,'S.D.',header=TRUE)
a<-table.element(a,'T-STAT
H0: parameter = 0',header=TRUE)
a<-table.element(a,'2-tail p-value',header=TRUE)
a<-table.element(a,'1-tail p-value',header=TRUE)
a<-table.row.end(a)
for (i in 1:k){
a<-table.row.start(a)
a<-table.element(a,rownames(mysum$coefficients)[i],header=TRUE)
a<-table.element(a,mysum$coefficients[i,1])
a<-table.element(a, round(mysum$coefficients[i,2],6))
a<-table.element(a, round(mysum$coefficients[i,3],4))
a<-table.element(a, round(mysum$coefficients[i,4],6))
a<-table.element(a, round(mysum$coefficients[i,4]/2,6))
a<-table.row.end(a)
}
a<-table.end(a)
table.save(a,file='mytable2.tab')
a<-table.start()
a<-table.row.start(a)
a<-table.element(a, 'Multiple Linear Regression - Regression Statistics', 2, TRUE)
a<-table.row.end(a)
a<-table.row.start(a)
a<-table.element(a, 'Multiple R',1,TRUE)
a<-table.element(a, sqrt(mysum$r.squared))
a<-table.row.end(a)
a<-table.row.start(a)
a<-table.element(a, 'R-squared',1,TRUE)
a<-table.element(a, mysum$r.squared)
a<-table.row.end(a)
a<-table.row.start(a)
a<-table.element(a, 'Adjusted R-squared',1,TRUE)
a<-table.element(a, mysum$adj.r.squared)
a<-table.row.end(a)
a<-table.row.start(a)
a<-table.element(a, 'F-TEST (value)',1,TRUE)
a<-table.element(a, mysum$fstatistic[1])
a<-table.row.end(a)
a<-table.row.start(a)
a<-table.element(a, 'F-TEST (DF numerator)',1,TRUE)
a<-table.element(a, mysum$fstatistic[2])
a<-table.row.end(a)
a<-table.row.start(a)
a<-table.element(a, 'F-TEST (DF denominator)',1,TRUE)
a<-table.element(a, mysum$fstatistic[3])
a<-table.row.end(a)
a<-table.row.start(a)
a<-table.element(a, 'p-value',1,TRUE)
a<-table.element(a, 1-pf(mysum$fstatistic[1],mysum$fstatistic[2],mysum$fstatistic[3]))
a<-table.row.end(a)
a<-table.row.start(a)
a<-table.element(a, 'Multiple Linear Regression - Residual Statistics', 2, TRUE)
a<-table.row.end(a)
a<-table.row.start(a)
a<-table.element(a, 'Residual Standard Deviation',1,TRUE)
a<-table.element(a, mysum$sigma)
a<-table.row.end(a)
a<-table.row.start(a)
a<-table.element(a, 'Sum Squared Residuals',1,TRUE)
a<-table.element(a, sum(myerror*myerror))
a<-table.row.end(a)
a<-table.end(a)
table.save(a,file='mytable3.tab')
a<-table.start()
a<-table.row.start(a)
a<-table.element(a, 'Multiple Linear Regression - Actuals, Interpolation, and Residuals', 4, TRUE)
a<-table.row.end(a)
a<-table.row.start(a)
a<-table.element(a, 'Time or Index', 1, TRUE)
a<-table.element(a, 'Actuals', 1, TRUE)
a<-table.element(a, 'Interpolation
Forecast', 1, TRUE)
a<-table.element(a, 'Residuals
Prediction Error', 1, TRUE)
a<-table.row.end(a)
for (i in 1:n) {
a<-table.row.start(a)
a<-table.element(a,i, 1, TRUE)
a<-table.element(a,x[i])
a<-table.element(a,x[i]-mysum$resid[i])
a<-table.element(a,mysum$resid[i])
a<-table.row.end(a)
}
a<-table.end(a)
table.save(a,file='mytable4.tab')
if (n > n25) {
a<-table.start()
a<-table.row.start(a)
a<-table.element(a,'Goldfeld-Quandt test for Heteroskedasticity',4,TRUE)
a<-table.row.end(a)
a<-table.row.start(a)
a<-table.element(a,'p-values',header=TRUE)
a<-table.element(a,'Alternative Hypothesis',3,header=TRUE)
a<-table.row.end(a)
a<-table.row.start(a)
a<-table.element(a,'breakpoint index',header=TRUE)
a<-table.element(a,'greater',header=TRUE)
a<-table.element(a,'2-sided',header=TRUE)
a<-table.element(a,'less',header=TRUE)
a<-table.row.end(a)
for (mypoint in kp3:nmkm3) {
a<-table.row.start(a)
a<-table.element(a,mypoint,header=TRUE)
a<-table.element(a,gqarr[mypoint-kp3+1,1])
a<-table.element(a,gqarr[mypoint-kp3+1,2])
a<-table.element(a,gqarr[mypoint-kp3+1,3])
a<-table.row.end(a)
}
a<-table.end(a)
table.save(a,file='mytable5.tab')
a<-table.start()
a<-table.row.start(a)
a<-table.element(a,'Meta Analysis of Goldfeld-Quandt test for Heteroskedasticity',4,TRUE)
a<-table.row.end(a)
a<-table.row.start(a)
a<-table.element(a,'Description',header=TRUE)
a<-table.element(a,'# significant tests',header=TRUE)
a<-table.element(a,'% significant tests',header=TRUE)
a<-table.element(a,'OK/NOK',header=TRUE)
a<-table.row.end(a)
a<-table.row.start(a)
a<-table.element(a,'1% type I error level',header=TRUE)
a<-table.element(a,numsignificant1)
a<-table.element(a,numsignificant1/numgqtests)
if (numsignificant1/numgqtests < 0.01) dum <- 'OK' else dum <- 'NOK'
a<-table.element(a,dum)
a<-table.row.end(a)
a<-table.row.start(a)
a<-table.element(a,'5% type I error level',header=TRUE)
a<-table.element(a,numsignificant5)
a<-table.element(a,numsignificant5/numgqtests)
if (numsignificant5/numgqtests < 0.05) dum <- 'OK' else dum <- 'NOK'
a<-table.element(a,dum)
a<-table.row.end(a)
a<-table.row.start(a)
a<-table.element(a,'10% type I error level',header=TRUE)
a<-table.element(a,numsignificant10)
a<-table.element(a,numsignificant10/numgqtests)
if (numsignificant10/numgqtests < 0.1) dum <- 'OK' else dum <- 'NOK'
a<-table.element(a,dum)
a<-table.row.end(a)
a<-table.end(a)
table.save(a,file='mytable6.tab')
}