Free Statistics

of Irreproducible Research!

Author's title

Author*The author of this computation has been verified*
R Software Modulerwasp_autocorrelation.wasp
Title produced by software(Partial) Autocorrelation Function
Date of computationSat, 11 Dec 2010 13:24:27 +0000
Cite this page as followsStatistical Computations at FreeStatistics.org, Office for Research Development and Education, URL https://freestatistics.org/blog/index.php?v=date/2010/Dec/11/t1292073787tm8vgdhxcwx5zmt.htm/, Retrieved Tue, 07 May 2024 03:55:27 +0000
Statistical Computations at FreeStatistics.org, Office for Research Development and Education, URL https://freestatistics.org/blog/index.php?pk=108136, Retrieved Tue, 07 May 2024 03:55:27 +0000
QR Codes:

Original text written by user:
IsPrivate?No (this computation is public)
User-defined keywords
Estimated Impact136
Family? (F = Feedback message, R = changed R code, M = changed R Module, P = changed Parameters, D = changed Data)
-     [Univariate Explorative Data Analysis] [paper] [2007-12-11 21:01:08] [b3bb3ec527e23fa7d74d4348b38c8499]
- RMPD  [Univariate Explorative Data Analysis] [PAPER] [2009-12-30 15:50:30] [23722951c28e05bb35cc9a97084fe0d9]
- RMPD    [(Partial) Autocorrelation Function] [Paper ACF] [2010-12-11 12:03:59] [6e6854a111a7f2438dd668bfaa6f3aa0]
-             [(Partial) Autocorrelation Function] [Paper ACF 2] [2010-12-11 13:24:27] [81b44bf7e2a3251743773b0d7e91dd87] [Current]
Feedback Forum

Post a new message
Dataseries X:
172
150.6
163.3
153.7
152.9
135.5
148.5
148.4
133.6
194.1
208.6
197.3
164.4
148.1
152
144.1
155
124.5
153
146
138
190
192
192
147
133
163
150
129
131
145
137
138
168
176
188
139
143
150
154
137
129
128
140
143
151
177
184
151
134
164
126
131
125
127
143
143
160
190
182
138
136
152
127
151
130
119
153


Summary of computational transaction
Raw Inputview raw input (R code)
Raw Outputview raw output of R engine
Computing time2 seconds
R Server'Sir Ronald Aylmer Fisher' @ 193.190.124.24

\begin{tabular}{lllllllll}
\hline
Summary of computational transaction \tabularnewline
Raw Input & view raw input (R code)  \tabularnewline
Raw Output & view raw output of R engine  \tabularnewline
Computing time & 2 seconds \tabularnewline
R Server & 'Sir Ronald Aylmer Fisher' @ 193.190.124.24 \tabularnewline
\hline
\end{tabular}
%Source: https://freestatistics.org/blog/index.php?pk=108136&T=0

[TABLE]
[ROW][C]Summary of computational transaction[/C][/ROW]
[ROW][C]Raw Input[/C][C]view raw input (R code) [/C][/ROW]
[ROW][C]Raw Output[/C][C]view raw output of R engine [/C][/ROW]
[ROW][C]Computing time[/C][C]2 seconds[/C][/ROW]
[ROW][C]R Server[/C][C]'Sir Ronald Aylmer Fisher' @ 193.190.124.24[/C][/ROW]
[/TABLE]
Source: https://freestatistics.org/blog/index.php?pk=108136&T=0

Globally Unique Identifier (entire table): ba.freestatistics.org/blog/index.php?pk=108136&T=0

As an alternative you can also use a QR Code:  

The GUIDs for individual cells are displayed in the table below:

Summary of computational transaction
Raw Inputview raw input (R code)
Raw Outputview raw output of R engine
Computing time2 seconds
R Server'Sir Ronald Aylmer Fisher' @ 193.190.124.24


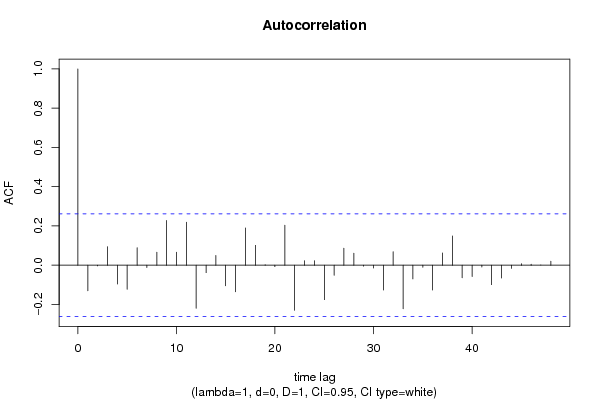
Autocorrelation Function
Time lag kACF(k)T-STATP-value
1-0.130383-0.97570.166706
2-0.003483-0.02610.48965
30.0939990.70340.242353
4-0.09619-0.71980.237315
5-0.12213-0.91390.182334
60.0890040.6660.254057
7-0.011961-0.08950.464498
80.0666190.49850.310032
90.2277341.70420.046943
100.0658780.4930.311976
110.2195911.64330.052965
12-0.219579-1.64320.052975
13-0.037815-0.2830.389117
140.0501970.37560.354302
15-0.104447-0.78160.218868
16-0.135535-1.01430.157413
170.1893921.41730.080971
180.1014420.75910.225482
190.0028550.02140.491515
20-0.0071-0.05310.478907
210.2036921.52430.066532
22-0.229727-1.71910.045558
230.0226210.16930.433093
240.0226850.16980.432906
25-0.175201-1.31110.09759
26-0.051586-0.3860.350466
270.0869240.65050.259021
280.0609940.45640.324921
29-0.004721-0.03530.485972
30-0.013749-0.10290.459209
31-0.126654-0.94780.173654
320.0690970.51710.30357
33-0.222262-1.66330.050924
34-0.069675-0.52140.302073
35-0.010613-0.07940.468491
36-0.126423-0.94610.174091
370.0621260.46490.321899
380.1486431.11230.135371
39-0.063866-0.47790.31728
40-0.057522-0.43050.334257
41-0.009433-0.07060.471989
42-0.098886-0.740.231197
43-0.064912-0.48580.314518
44-0.0162-0.12120.451971
450.0077230.05780.477061
460.005310.03970.484222
470.0003610.00270.498927
480.0205610.15390.439135

\begin{tabular}{lllllllll}
\hline
Autocorrelation Function \tabularnewline
Time lag k & ACF(k) & T-STAT & P-value \tabularnewline
1 & -0.130383 & -0.9757 & 0.166706 \tabularnewline
2 & -0.003483 & -0.0261 & 0.48965 \tabularnewline
3 & 0.093999 & 0.7034 & 0.242353 \tabularnewline
4 & -0.09619 & -0.7198 & 0.237315 \tabularnewline
5 & -0.12213 & -0.9139 & 0.182334 \tabularnewline
6 & 0.089004 & 0.666 & 0.254057 \tabularnewline
7 & -0.011961 & -0.0895 & 0.464498 \tabularnewline
8 & 0.066619 & 0.4985 & 0.310032 \tabularnewline
9 & 0.227734 & 1.7042 & 0.046943 \tabularnewline
10 & 0.065878 & 0.493 & 0.311976 \tabularnewline
11 & 0.219591 & 1.6433 & 0.052965 \tabularnewline
12 & -0.219579 & -1.6432 & 0.052975 \tabularnewline
13 & -0.037815 & -0.283 & 0.389117 \tabularnewline
14 & 0.050197 & 0.3756 & 0.354302 \tabularnewline
15 & -0.104447 & -0.7816 & 0.218868 \tabularnewline
16 & -0.135535 & -1.0143 & 0.157413 \tabularnewline
17 & 0.189392 & 1.4173 & 0.080971 \tabularnewline
18 & 0.101442 & 0.7591 & 0.225482 \tabularnewline
19 & 0.002855 & 0.0214 & 0.491515 \tabularnewline
20 & -0.0071 & -0.0531 & 0.478907 \tabularnewline
21 & 0.203692 & 1.5243 & 0.066532 \tabularnewline
22 & -0.229727 & -1.7191 & 0.045558 \tabularnewline
23 & 0.022621 & 0.1693 & 0.433093 \tabularnewline
24 & 0.022685 & 0.1698 & 0.432906 \tabularnewline
25 & -0.175201 & -1.3111 & 0.09759 \tabularnewline
26 & -0.051586 & -0.386 & 0.350466 \tabularnewline
27 & 0.086924 & 0.6505 & 0.259021 \tabularnewline
28 & 0.060994 & 0.4564 & 0.324921 \tabularnewline
29 & -0.004721 & -0.0353 & 0.485972 \tabularnewline
30 & -0.013749 & -0.1029 & 0.459209 \tabularnewline
31 & -0.126654 & -0.9478 & 0.173654 \tabularnewline
32 & 0.069097 & 0.5171 & 0.30357 \tabularnewline
33 & -0.222262 & -1.6633 & 0.050924 \tabularnewline
34 & -0.069675 & -0.5214 & 0.302073 \tabularnewline
35 & -0.010613 & -0.0794 & 0.468491 \tabularnewline
36 & -0.126423 & -0.9461 & 0.174091 \tabularnewline
37 & 0.062126 & 0.4649 & 0.321899 \tabularnewline
38 & 0.148643 & 1.1123 & 0.135371 \tabularnewline
39 & -0.063866 & -0.4779 & 0.31728 \tabularnewline
40 & -0.057522 & -0.4305 & 0.334257 \tabularnewline
41 & -0.009433 & -0.0706 & 0.471989 \tabularnewline
42 & -0.098886 & -0.74 & 0.231197 \tabularnewline
43 & -0.064912 & -0.4858 & 0.314518 \tabularnewline
44 & -0.0162 & -0.1212 & 0.451971 \tabularnewline
45 & 0.007723 & 0.0578 & 0.477061 \tabularnewline
46 & 0.00531 & 0.0397 & 0.484222 \tabularnewline
47 & 0.000361 & 0.0027 & 0.498927 \tabularnewline
48 & 0.020561 & 0.1539 & 0.439135 \tabularnewline
\hline
\end{tabular}
%Source: https://freestatistics.org/blog/index.php?pk=108136&T=1

[TABLE]
[ROW][C]Autocorrelation Function[/C][/ROW]
[ROW][C]Time lag k[/C][C]ACF(k)[/C][C]T-STAT[/C][C]P-value[/C][/ROW]
[ROW][C]1[/C][C]-0.130383[/C][C]-0.9757[/C][C]0.166706[/C][/ROW]
[ROW][C]2[/C][C]-0.003483[/C][C]-0.0261[/C][C]0.48965[/C][/ROW]
[ROW][C]3[/C][C]0.093999[/C][C]0.7034[/C][C]0.242353[/C][/ROW]
[ROW][C]4[/C][C]-0.09619[/C][C]-0.7198[/C][C]0.237315[/C][/ROW]
[ROW][C]5[/C][C]-0.12213[/C][C]-0.9139[/C][C]0.182334[/C][/ROW]
[ROW][C]6[/C][C]0.089004[/C][C]0.666[/C][C]0.254057[/C][/ROW]
[ROW][C]7[/C][C]-0.011961[/C][C]-0.0895[/C][C]0.464498[/C][/ROW]
[ROW][C]8[/C][C]0.066619[/C][C]0.4985[/C][C]0.310032[/C][/ROW]
[ROW][C]9[/C][C]0.227734[/C][C]1.7042[/C][C]0.046943[/C][/ROW]
[ROW][C]10[/C][C]0.065878[/C][C]0.493[/C][C]0.311976[/C][/ROW]
[ROW][C]11[/C][C]0.219591[/C][C]1.6433[/C][C]0.052965[/C][/ROW]
[ROW][C]12[/C][C]-0.219579[/C][C]-1.6432[/C][C]0.052975[/C][/ROW]
[ROW][C]13[/C][C]-0.037815[/C][C]-0.283[/C][C]0.389117[/C][/ROW]
[ROW][C]14[/C][C]0.050197[/C][C]0.3756[/C][C]0.354302[/C][/ROW]
[ROW][C]15[/C][C]-0.104447[/C][C]-0.7816[/C][C]0.218868[/C][/ROW]
[ROW][C]16[/C][C]-0.135535[/C][C]-1.0143[/C][C]0.157413[/C][/ROW]
[ROW][C]17[/C][C]0.189392[/C][C]1.4173[/C][C]0.080971[/C][/ROW]
[ROW][C]18[/C][C]0.101442[/C][C]0.7591[/C][C]0.225482[/C][/ROW]
[ROW][C]19[/C][C]0.002855[/C][C]0.0214[/C][C]0.491515[/C][/ROW]
[ROW][C]20[/C][C]-0.0071[/C][C]-0.0531[/C][C]0.478907[/C][/ROW]
[ROW][C]21[/C][C]0.203692[/C][C]1.5243[/C][C]0.066532[/C][/ROW]
[ROW][C]22[/C][C]-0.229727[/C][C]-1.7191[/C][C]0.045558[/C][/ROW]
[ROW][C]23[/C][C]0.022621[/C][C]0.1693[/C][C]0.433093[/C][/ROW]
[ROW][C]24[/C][C]0.022685[/C][C]0.1698[/C][C]0.432906[/C][/ROW]
[ROW][C]25[/C][C]-0.175201[/C][C]-1.3111[/C][C]0.09759[/C][/ROW]
[ROW][C]26[/C][C]-0.051586[/C][C]-0.386[/C][C]0.350466[/C][/ROW]
[ROW][C]27[/C][C]0.086924[/C][C]0.6505[/C][C]0.259021[/C][/ROW]
[ROW][C]28[/C][C]0.060994[/C][C]0.4564[/C][C]0.324921[/C][/ROW]
[ROW][C]29[/C][C]-0.004721[/C][C]-0.0353[/C][C]0.485972[/C][/ROW]
[ROW][C]30[/C][C]-0.013749[/C][C]-0.1029[/C][C]0.459209[/C][/ROW]
[ROW][C]31[/C][C]-0.126654[/C][C]-0.9478[/C][C]0.173654[/C][/ROW]
[ROW][C]32[/C][C]0.069097[/C][C]0.5171[/C][C]0.30357[/C][/ROW]
[ROW][C]33[/C][C]-0.222262[/C][C]-1.6633[/C][C]0.050924[/C][/ROW]
[ROW][C]34[/C][C]-0.069675[/C][C]-0.5214[/C][C]0.302073[/C][/ROW]
[ROW][C]35[/C][C]-0.010613[/C][C]-0.0794[/C][C]0.468491[/C][/ROW]
[ROW][C]36[/C][C]-0.126423[/C][C]-0.9461[/C][C]0.174091[/C][/ROW]
[ROW][C]37[/C][C]0.062126[/C][C]0.4649[/C][C]0.321899[/C][/ROW]
[ROW][C]38[/C][C]0.148643[/C][C]1.1123[/C][C]0.135371[/C][/ROW]
[ROW][C]39[/C][C]-0.063866[/C][C]-0.4779[/C][C]0.31728[/C][/ROW]
[ROW][C]40[/C][C]-0.057522[/C][C]-0.4305[/C][C]0.334257[/C][/ROW]
[ROW][C]41[/C][C]-0.009433[/C][C]-0.0706[/C][C]0.471989[/C][/ROW]
[ROW][C]42[/C][C]-0.098886[/C][C]-0.74[/C][C]0.231197[/C][/ROW]
[ROW][C]43[/C][C]-0.064912[/C][C]-0.4858[/C][C]0.314518[/C][/ROW]
[ROW][C]44[/C][C]-0.0162[/C][C]-0.1212[/C][C]0.451971[/C][/ROW]
[ROW][C]45[/C][C]0.007723[/C][C]0.0578[/C][C]0.477061[/C][/ROW]
[ROW][C]46[/C][C]0.00531[/C][C]0.0397[/C][C]0.484222[/C][/ROW]
[ROW][C]47[/C][C]0.000361[/C][C]0.0027[/C][C]0.498927[/C][/ROW]
[ROW][C]48[/C][C]0.020561[/C][C]0.1539[/C][C]0.439135[/C][/ROW]
[/TABLE]
Source: https://freestatistics.org/blog/index.php?pk=108136&T=1

Globally Unique Identifier (entire table): ba.freestatistics.org/blog/index.php?pk=108136&T=1

As an alternative you can also use a QR Code:  

The GUIDs for individual cells are displayed in the table below:

Autocorrelation Function
Time lag kACF(k)T-STATP-value
1-0.130383-0.97570.166706
2-0.003483-0.02610.48965
30.0939990.70340.242353
4-0.09619-0.71980.237315
5-0.12213-0.91390.182334
60.0890040.6660.254057
7-0.011961-0.08950.464498
80.0666190.49850.310032
90.2277341.70420.046943
100.0658780.4930.311976
110.2195911.64330.052965
12-0.219579-1.64320.052975
13-0.037815-0.2830.389117
140.0501970.37560.354302
15-0.104447-0.78160.218868
16-0.135535-1.01430.157413
170.1893921.41730.080971
180.1014420.75910.225482
190.0028550.02140.491515
20-0.0071-0.05310.478907
210.2036921.52430.066532
22-0.229727-1.71910.045558
230.0226210.16930.433093
240.0226850.16980.432906
25-0.175201-1.31110.09759
26-0.051586-0.3860.350466
270.0869240.65050.259021
280.0609940.45640.324921
29-0.004721-0.03530.485972
30-0.013749-0.10290.459209
31-0.126654-0.94780.173654
320.0690970.51710.30357
33-0.222262-1.66330.050924
34-0.069675-0.52140.302073
35-0.010613-0.07940.468491
36-0.126423-0.94610.174091
370.0621260.46490.321899
380.1486431.11230.135371
39-0.063866-0.47790.31728
40-0.057522-0.43050.334257
41-0.009433-0.07060.471989
42-0.098886-0.740.231197
43-0.064912-0.48580.314518
44-0.0162-0.12120.451971
450.0077230.05780.477061
460.005310.03970.484222
470.0003610.00270.498927
480.0205610.15390.439135


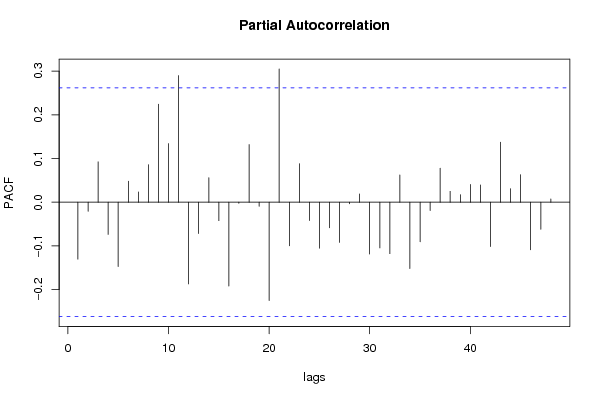
Partial Autocorrelation Function
Time lag kPACF(k)T-STATP-value
1-0.130383-0.97570.166706
2-0.020837-0.15590.438325
30.0924290.69170.245999
4-0.073742-0.55180.291628
5-0.147136-1.10110.13779
60.0481320.36020.360032
70.0235340.17610.430421
80.0859970.64350.261249
90.2241581.67740.049515
100.1342241.00440.159744
110.2898482.1690.017171
12-0.187017-1.39950.083588
13-0.07185-0.53770.296465
140.0560660.41960.338206
15-0.042175-0.31560.376737
16-0.191988-1.43670.078182
17-0.002419-0.01810.492811
180.131810.98640.164096
19-0.009226-0.0690.472602
20-0.22508-1.68430.048841
210.3049972.28240.013143
22-0.099922-0.74780.228869
230.0883040.66080.255724
24-0.042024-0.31450.377163
25-0.105206-0.78730.217216
26-0.058458-0.43750.33173
27-0.092045-0.68880.246895
28-0.003499-0.02620.489601
290.0188070.14070.444292
30-0.118647-0.88790.189203
31-0.104577-0.78260.218585
32-0.117742-0.88110.191015
330.0624390.46720.321068
34-0.151766-1.13570.130458
35-0.090484-0.67710.250558
36-0.01923-0.14390.443047
370.0778220.58240.28133
380.0249260.18650.426353
390.0169750.1270.449685
400.0404780.30290.38154
410.0396410.29660.383916
42-0.101271-0.75780.225862
430.1373721.0280.154185
440.0308390.23080.409165
450.0628180.47010.320058
46-0.108953-0.81530.20917
47-0.061854-0.46290.322625
480.0075480.05650.47758

\begin{tabular}{lllllllll}
\hline
Partial Autocorrelation Function \tabularnewline
Time lag k & PACF(k) & T-STAT & P-value \tabularnewline
1 & -0.130383 & -0.9757 & 0.166706 \tabularnewline
2 & -0.020837 & -0.1559 & 0.438325 \tabularnewline
3 & 0.092429 & 0.6917 & 0.245999 \tabularnewline
4 & -0.073742 & -0.5518 & 0.291628 \tabularnewline
5 & -0.147136 & -1.1011 & 0.13779 \tabularnewline
6 & 0.048132 & 0.3602 & 0.360032 \tabularnewline
7 & 0.023534 & 0.1761 & 0.430421 \tabularnewline
8 & 0.085997 & 0.6435 & 0.261249 \tabularnewline
9 & 0.224158 & 1.6774 & 0.049515 \tabularnewline
10 & 0.134224 & 1.0044 & 0.159744 \tabularnewline
11 & 0.289848 & 2.169 & 0.017171 \tabularnewline
12 & -0.187017 & -1.3995 & 0.083588 \tabularnewline
13 & -0.07185 & -0.5377 & 0.296465 \tabularnewline
14 & 0.056066 & 0.4196 & 0.338206 \tabularnewline
15 & -0.042175 & -0.3156 & 0.376737 \tabularnewline
16 & -0.191988 & -1.4367 & 0.078182 \tabularnewline
17 & -0.002419 & -0.0181 & 0.492811 \tabularnewline
18 & 0.13181 & 0.9864 & 0.164096 \tabularnewline
19 & -0.009226 & -0.069 & 0.472602 \tabularnewline
20 & -0.22508 & -1.6843 & 0.048841 \tabularnewline
21 & 0.304997 & 2.2824 & 0.013143 \tabularnewline
22 & -0.099922 & -0.7478 & 0.228869 \tabularnewline
23 & 0.088304 & 0.6608 & 0.255724 \tabularnewline
24 & -0.042024 & -0.3145 & 0.377163 \tabularnewline
25 & -0.105206 & -0.7873 & 0.217216 \tabularnewline
26 & -0.058458 & -0.4375 & 0.33173 \tabularnewline
27 & -0.092045 & -0.6888 & 0.246895 \tabularnewline
28 & -0.003499 & -0.0262 & 0.489601 \tabularnewline
29 & 0.018807 & 0.1407 & 0.444292 \tabularnewline
30 & -0.118647 & -0.8879 & 0.189203 \tabularnewline
31 & -0.104577 & -0.7826 & 0.218585 \tabularnewline
32 & -0.117742 & -0.8811 & 0.191015 \tabularnewline
33 & 0.062439 & 0.4672 & 0.321068 \tabularnewline
34 & -0.151766 & -1.1357 & 0.130458 \tabularnewline
35 & -0.090484 & -0.6771 & 0.250558 \tabularnewline
36 & -0.01923 & -0.1439 & 0.443047 \tabularnewline
37 & 0.077822 & 0.5824 & 0.28133 \tabularnewline
38 & 0.024926 & 0.1865 & 0.426353 \tabularnewline
39 & 0.016975 & 0.127 & 0.449685 \tabularnewline
40 & 0.040478 & 0.3029 & 0.38154 \tabularnewline
41 & 0.039641 & 0.2966 & 0.383916 \tabularnewline
42 & -0.101271 & -0.7578 & 0.225862 \tabularnewline
43 & 0.137372 & 1.028 & 0.154185 \tabularnewline
44 & 0.030839 & 0.2308 & 0.409165 \tabularnewline
45 & 0.062818 & 0.4701 & 0.320058 \tabularnewline
46 & -0.108953 & -0.8153 & 0.20917 \tabularnewline
47 & -0.061854 & -0.4629 & 0.322625 \tabularnewline
48 & 0.007548 & 0.0565 & 0.47758 \tabularnewline
\hline
\end{tabular}
%Source: https://freestatistics.org/blog/index.php?pk=108136&T=2

[TABLE]
[ROW][C]Partial Autocorrelation Function[/C][/ROW]
[ROW][C]Time lag k[/C][C]PACF(k)[/C][C]T-STAT[/C][C]P-value[/C][/ROW]
[ROW][C]1[/C][C]-0.130383[/C][C]-0.9757[/C][C]0.166706[/C][/ROW]
[ROW][C]2[/C][C]-0.020837[/C][C]-0.1559[/C][C]0.438325[/C][/ROW]
[ROW][C]3[/C][C]0.092429[/C][C]0.6917[/C][C]0.245999[/C][/ROW]
[ROW][C]4[/C][C]-0.073742[/C][C]-0.5518[/C][C]0.291628[/C][/ROW]
[ROW][C]5[/C][C]-0.147136[/C][C]-1.1011[/C][C]0.13779[/C][/ROW]
[ROW][C]6[/C][C]0.048132[/C][C]0.3602[/C][C]0.360032[/C][/ROW]
[ROW][C]7[/C][C]0.023534[/C][C]0.1761[/C][C]0.430421[/C][/ROW]
[ROW][C]8[/C][C]0.085997[/C][C]0.6435[/C][C]0.261249[/C][/ROW]
[ROW][C]9[/C][C]0.224158[/C][C]1.6774[/C][C]0.049515[/C][/ROW]
[ROW][C]10[/C][C]0.134224[/C][C]1.0044[/C][C]0.159744[/C][/ROW]
[ROW][C]11[/C][C]0.289848[/C][C]2.169[/C][C]0.017171[/C][/ROW]
[ROW][C]12[/C][C]-0.187017[/C][C]-1.3995[/C][C]0.083588[/C][/ROW]
[ROW][C]13[/C][C]-0.07185[/C][C]-0.5377[/C][C]0.296465[/C][/ROW]
[ROW][C]14[/C][C]0.056066[/C][C]0.4196[/C][C]0.338206[/C][/ROW]
[ROW][C]15[/C][C]-0.042175[/C][C]-0.3156[/C][C]0.376737[/C][/ROW]
[ROW][C]16[/C][C]-0.191988[/C][C]-1.4367[/C][C]0.078182[/C][/ROW]
[ROW][C]17[/C][C]-0.002419[/C][C]-0.0181[/C][C]0.492811[/C][/ROW]
[ROW][C]18[/C][C]0.13181[/C][C]0.9864[/C][C]0.164096[/C][/ROW]
[ROW][C]19[/C][C]-0.009226[/C][C]-0.069[/C][C]0.472602[/C][/ROW]
[ROW][C]20[/C][C]-0.22508[/C][C]-1.6843[/C][C]0.048841[/C][/ROW]
[ROW][C]21[/C][C]0.304997[/C][C]2.2824[/C][C]0.013143[/C][/ROW]
[ROW][C]22[/C][C]-0.099922[/C][C]-0.7478[/C][C]0.228869[/C][/ROW]
[ROW][C]23[/C][C]0.088304[/C][C]0.6608[/C][C]0.255724[/C][/ROW]
[ROW][C]24[/C][C]-0.042024[/C][C]-0.3145[/C][C]0.377163[/C][/ROW]
[ROW][C]25[/C][C]-0.105206[/C][C]-0.7873[/C][C]0.217216[/C][/ROW]
[ROW][C]26[/C][C]-0.058458[/C][C]-0.4375[/C][C]0.33173[/C][/ROW]
[ROW][C]27[/C][C]-0.092045[/C][C]-0.6888[/C][C]0.246895[/C][/ROW]
[ROW][C]28[/C][C]-0.003499[/C][C]-0.0262[/C][C]0.489601[/C][/ROW]
[ROW][C]29[/C][C]0.018807[/C][C]0.1407[/C][C]0.444292[/C][/ROW]
[ROW][C]30[/C][C]-0.118647[/C][C]-0.8879[/C][C]0.189203[/C][/ROW]
[ROW][C]31[/C][C]-0.104577[/C][C]-0.7826[/C][C]0.218585[/C][/ROW]
[ROW][C]32[/C][C]-0.117742[/C][C]-0.8811[/C][C]0.191015[/C][/ROW]
[ROW][C]33[/C][C]0.062439[/C][C]0.4672[/C][C]0.321068[/C][/ROW]
[ROW][C]34[/C][C]-0.151766[/C][C]-1.1357[/C][C]0.130458[/C][/ROW]
[ROW][C]35[/C][C]-0.090484[/C][C]-0.6771[/C][C]0.250558[/C][/ROW]
[ROW][C]36[/C][C]-0.01923[/C][C]-0.1439[/C][C]0.443047[/C][/ROW]
[ROW][C]37[/C][C]0.077822[/C][C]0.5824[/C][C]0.28133[/C][/ROW]
[ROW][C]38[/C][C]0.024926[/C][C]0.1865[/C][C]0.426353[/C][/ROW]
[ROW][C]39[/C][C]0.016975[/C][C]0.127[/C][C]0.449685[/C][/ROW]
[ROW][C]40[/C][C]0.040478[/C][C]0.3029[/C][C]0.38154[/C][/ROW]
[ROW][C]41[/C][C]0.039641[/C][C]0.2966[/C][C]0.383916[/C][/ROW]
[ROW][C]42[/C][C]-0.101271[/C][C]-0.7578[/C][C]0.225862[/C][/ROW]
[ROW][C]43[/C][C]0.137372[/C][C]1.028[/C][C]0.154185[/C][/ROW]
[ROW][C]44[/C][C]0.030839[/C][C]0.2308[/C][C]0.409165[/C][/ROW]
[ROW][C]45[/C][C]0.062818[/C][C]0.4701[/C][C]0.320058[/C][/ROW]
[ROW][C]46[/C][C]-0.108953[/C][C]-0.8153[/C][C]0.20917[/C][/ROW]
[ROW][C]47[/C][C]-0.061854[/C][C]-0.4629[/C][C]0.322625[/C][/ROW]
[ROW][C]48[/C][C]0.007548[/C][C]0.0565[/C][C]0.47758[/C][/ROW]
[/TABLE]
Source: https://freestatistics.org/blog/index.php?pk=108136&T=2

Globally Unique Identifier (entire table): ba.freestatistics.org/blog/index.php?pk=108136&T=2

As an alternative you can also use a QR Code:  

The GUIDs for individual cells are displayed in the table below:

Partial Autocorrelation Function
Time lag kPACF(k)T-STATP-value
1-0.130383-0.97570.166706
2-0.020837-0.15590.438325
30.0924290.69170.245999
4-0.073742-0.55180.291628
5-0.147136-1.10110.13779
60.0481320.36020.360032
70.0235340.17610.430421
80.0859970.64350.261249
90.2241581.67740.049515
100.1342241.00440.159744
110.2898482.1690.017171
12-0.187017-1.39950.083588
13-0.07185-0.53770.296465
140.0560660.41960.338206
15-0.042175-0.31560.376737
16-0.191988-1.43670.078182
17-0.002419-0.01810.492811
180.131810.98640.164096
19-0.009226-0.0690.472602
20-0.22508-1.68430.048841
210.3049972.28240.013143
22-0.099922-0.74780.228869
230.0883040.66080.255724
24-0.042024-0.31450.377163
25-0.105206-0.78730.217216
26-0.058458-0.43750.33173
27-0.092045-0.68880.246895
28-0.003499-0.02620.489601
290.0188070.14070.444292
30-0.118647-0.88790.189203
31-0.104577-0.78260.218585
32-0.117742-0.88110.191015
330.0624390.46720.321068
34-0.151766-1.13570.130458
35-0.090484-0.67710.250558
36-0.01923-0.14390.443047
370.0778220.58240.28133
380.0249260.18650.426353
390.0169750.1270.449685
400.0404780.30290.38154
410.0396410.29660.383916
42-0.101271-0.75780.225862
430.1373721.0280.154185
440.0308390.23080.409165
450.0628180.47010.320058
46-0.108953-0.81530.20917
47-0.061854-0.46290.322625
480.0075480.05650.47758


Parameters (Session):
Parameters (R input):
par1 = 48 ; par2 = 1 ; par3 = 0 ; par4 = 1 ; par5 = 12 ; par6 = White Noise ; par7 = 0.95 ;
R code (references can be found in the software module):
if (par1 == 'Default') {
par1 = 10*log10(length(x))
} else {
par1 <- as.numeric(par1)
}
par2 <- as.numeric(par2)
par3 <- as.numeric(par3)
par4 <- as.numeric(par4)
par5 <- as.numeric(par5)
if (par6 == 'White Noise') par6 <- 'white' else par6 <- 'ma'
par7 <- as.numeric(par7)
if (par2 == 0) {
x <- log(x)
} else {
x <- (x ^ par2 - 1) / par2
}
if (par3 > 0) x <- diff(x,lag=1,difference=par3)
if (par4 > 0) x <- diff(x,lag=par5,difference=par4)
bitmap(file='pic1.png')
racf <- acf(x, par1, main='Autocorrelation', xlab='time lag', ylab='ACF', ci.type=par6, ci=par7, sub=paste('(lambda=',par2,', d=',par3,', D=',par4,', CI=', par7, ', CI type=',par6,')',sep=''))
dev.off()
bitmap(file='pic2.png')
rpacf <- pacf(x,par1,main='Partial Autocorrelation',xlab='lags',ylab='PACF')
dev.off()
(myacf <- c(racf$acf))
(mypacf <- c(rpacf$acf))
lengthx <- length(x)
sqrtn <- sqrt(lengthx)
load(file='createtable')
a<-table.start()
a<-table.row.start(a)
a<-table.element(a,'Autocorrelation Function',4,TRUE)
a<-table.row.end(a)
a<-table.row.start(a)
a<-table.element(a,'Time lag k',header=TRUE)
a<-table.element(a,hyperlink('basics.htm','ACF(k)','click here for more information about the Autocorrelation Function'),header=TRUE)
a<-table.element(a,'T-STAT',header=TRUE)
a<-table.element(a,'P-value',header=TRUE)
a<-table.row.end(a)
for (i in 2:(par1+1)) {
a<-table.row.start(a)
a<-table.element(a,i-1,header=TRUE)
a<-table.element(a,round(myacf[i],6))
mytstat <- myacf[i]*sqrtn
a<-table.element(a,round(mytstat,4))
a<-table.element(a,round(1-pt(abs(mytstat),lengthx),6))
a<-table.row.end(a)
}
a<-table.end(a)
table.save(a,file='mytable.tab')
a<-table.start()
a<-table.row.start(a)
a<-table.element(a,'Partial Autocorrelation Function',4,TRUE)
a<-table.row.end(a)
a<-table.row.start(a)
a<-table.element(a,'Time lag k',header=TRUE)
a<-table.element(a,hyperlink('basics.htm','PACF(k)','click here for more information about the Partial Autocorrelation Function'),header=TRUE)
a<-table.element(a,'T-STAT',header=TRUE)
a<-table.element(a,'P-value',header=TRUE)
a<-table.row.end(a)
for (i in 1:par1) {
a<-table.row.start(a)
a<-table.element(a,i,header=TRUE)
a<-table.element(a,round(mypacf[i],6))
mytstat <- mypacf[i]*sqrtn
a<-table.element(a,round(mytstat,4))
a<-table.element(a,round(1-pt(abs(mytstat),lengthx),6))
a<-table.row.end(a)
}
a<-table.end(a)
table.save(a,file='mytable1.tab')