Free Statistics

of Irreproducible Research!

Author's title

Author*The author of this computation has been verified*
R Software Modulerwasp_arimaforecasting.wasp
Title produced by softwareARIMA Forecasting
Date of computationSat, 11 Dec 2010 12:59:41 +0000
Cite this page as followsStatistical Computations at FreeStatistics.org, Office for Research Development and Education, URL https://freestatistics.org/blog/index.php?v=date/2010/Dec/11/t12920722547mq6pwoiudghf9o.htm/, Retrieved Mon, 06 May 2024 15:12:29 +0000
Statistical Computations at FreeStatistics.org, Office for Research Development and Education, URL https://freestatistics.org/blog/index.php?pk=108113, Retrieved Mon, 06 May 2024 15:12:29 +0000
QR Codes:

Original text written by user:
IsPrivate?No (this computation is public)
User-defined keywords
Estimated Impact183
Family? (F = Feedback message, R = changed R code, M = changed R Module, P = changed Parameters, D = changed Data)
-     [Univariate Data Series] [data set] [2008-12-01 19:54:57] [b98453cac15ba1066b407e146608df68]
- RMP   [Standard Deviation-Mean Plot] [Unemployment] [2010-11-29 10:34:47] [b98453cac15ba1066b407e146608df68]
- RMP     [ARIMA Forecasting] [Unemployment] [2010-11-29 20:46:45] [b98453cac15ba1066b407e146608df68]
-   PD      [ARIMA Forecasting] [W9 ] [2010-12-03 13:29:18] [56d90b683fcd93137645f9226b43c62b]
-   PD          [ARIMA Forecasting] [Paper Forecasting...] [2010-12-11 12:59:41] [59f7d3e7fcb6374015f4e6b9053b0f01] [Current]
Feedback Forum

Post a new message
Dataseries X:
17848
19592
21092
20899
25890
24965
22225
20977
22897
22785
22769
19637
20203
20450
23083
21738
26766
25280
22574
22729
21378
22902
24989
21116
15169
15846
20927
18273
22538
15596
14034
11366
14861
15149
13577
13026
13190
13196
15826
14733
16307
15703
14589
12043
15057
14053
12698
10888
10045
11549
13767
12434
13116
14211
12266
12602
15714
13742
12745
10491
10057
10900
11771
11992
11933
14504
11727
11477
13578
11555
11846
11397
10066
10269
14279
13870
13695
14420
11424
9704
12464
14301
13464
9893
11572
12380
16692
16052
16459
14761
13654
13480
18068
16560
14530
10650
11651
13735
13360
17818
20613
16231
13862
12004
17734
15034
12609
12320
10833
11350
13648
14890
16325
18045
15616
11926
16855
15083
12520
12355


Summary of computational transaction
Raw Inputview raw input (R code)
Raw Outputview raw output of R engine
Computing time2 seconds
R Server'Gwilym Jenkins' @ 72.249.127.135

\begin{tabular}{lllllllll}
\hline
Summary of computational transaction \tabularnewline
Raw Input & view raw input (R code)  \tabularnewline
Raw Output & view raw output of R engine  \tabularnewline
Computing time & 2 seconds \tabularnewline
R Server & 'Gwilym Jenkins' @ 72.249.127.135 \tabularnewline
\hline
\end{tabular}
%Source: https://freestatistics.org/blog/index.php?pk=108113&T=0

[TABLE]
[ROW][C]Summary of computational transaction[/C][/ROW]
[ROW][C]Raw Input[/C][C]view raw input (R code) [/C][/ROW]
[ROW][C]Raw Output[/C][C]view raw output of R engine [/C][/ROW]
[ROW][C]Computing time[/C][C]2 seconds[/C][/ROW]
[ROW][C]R Server[/C][C]'Gwilym Jenkins' @ 72.249.127.135[/C][/ROW]
[/TABLE]
Source: https://freestatistics.org/blog/index.php?pk=108113&T=0

Globally Unique Identifier (entire table): ba.freestatistics.org/blog/index.php?pk=108113&T=0

As an alternative you can also use a QR Code:  

The GUIDs for individual cells are displayed in the table below:

Summary of computational transaction
Raw Inputview raw input (R code)
Raw Outputview raw output of R engine
Computing time2 seconds
R Server'Gwilym Jenkins' @ 72.249.127.135


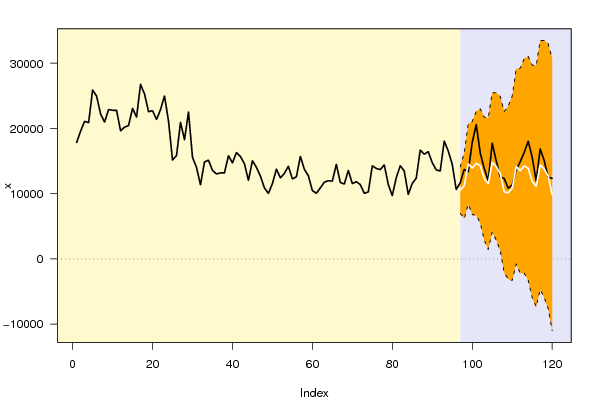
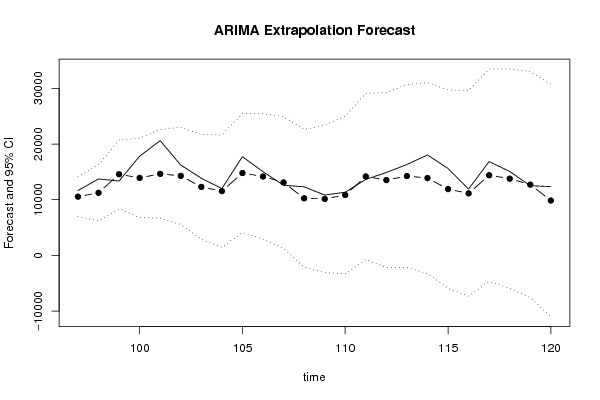
Univariate ARIMA Extrapolation Forecast
timeY[t]F[t]95% LB95% UBp-value(H0: Y[t] = F[t])P(F[t]>Y[t-1])P(F[t]>Y[t-s])P(F[t]>Y[96])
849893-------
8511572-------
8612380-------
8716692-------
8816052-------
8916459-------
9014761-------
9113654-------
9213480-------
9318068-------
9416560-------
9514530-------
9610650-------
971165110547.69766980.603614114.79150.27220.47760.28680.4776
981373511238.21916194.414416282.02380.1660.43630.32860.5904
991336014571.7828394.746120748.81790.35030.60470.25060.8933
1001781813922.61636790.184921055.04780.14220.56140.27920.8158
1012061314648.89336674.723422623.06320.07130.2180.32820.8372
1021623114286.42035551.250523021.59020.33130.07790.45760.7927
1031386212302.44132867.453321737.42930.3730.20720.38940.6343
1041200411535.87361449.506321622.24090.46380.32560.35280.5683
1051773414792.72284094.563525490.8820.2950.69530.27420.7761
1061503414175.99092899.18225452.79970.44070.26820.33930.73
1071260913106.59931279.417824933.78090.46710.37470.40680.658
1081232010254.0909-2098.966622607.14840.37150.35430.4750.475
1091083310151.7884-3122.41623425.99280.45990.37440.41240.4707
1101135010842.31-3292.254724976.87470.47190.50050.34420.5106
1111364814175.8728-769.605929121.35160.47240.64450.54260.6781
1121489013526.7072-2187.895929241.31030.43250.4940.29620.6401
1131632514252.9842-2194.817230700.78550.40250.46970.22430.6662
1141804513890.5112-3259.170531040.19290.31750.39040.39450.6444
1151561611906.5322-5917.412429730.47670.34170.24980.41490.5549
1161192611139.9645-7333.649629613.57850.46680.31740.46350.5207
1171685514396.8136-4704.386133498.01340.40040.60010.3660.6497
1181508313780.0817-5928.729733488.89310.44850.37990.45040.6222
1191252012710.6902-7587.552633008.93310.49270.40940.50390.5789
120123559858.1817-11012.852730729.21620.40730.40130.40860.4704

\begin{tabular}{lllllllll}
\hline
Univariate ARIMA Extrapolation Forecast \tabularnewline
time & Y[t] & F[t] & 95% LB & 95% UB & p-value(H0: Y[t] = F[t]) & P(F[t]>Y[t-1]) & P(F[t]>Y[t-s]) & P(F[t]>Y[96]) \tabularnewline
84 & 9893 & - & - & - & - & - & - & - \tabularnewline
85 & 11572 & - & - & - & - & - & - & - \tabularnewline
86 & 12380 & - & - & - & - & - & - & - \tabularnewline
87 & 16692 & - & - & - & - & - & - & - \tabularnewline
88 & 16052 & - & - & - & - & - & - & - \tabularnewline
89 & 16459 & - & - & - & - & - & - & - \tabularnewline
90 & 14761 & - & - & - & - & - & - & - \tabularnewline
91 & 13654 & - & - & - & - & - & - & - \tabularnewline
92 & 13480 & - & - & - & - & - & - & - \tabularnewline
93 & 18068 & - & - & - & - & - & - & - \tabularnewline
94 & 16560 & - & - & - & - & - & - & - \tabularnewline
95 & 14530 & - & - & - & - & - & - & - \tabularnewline
96 & 10650 & - & - & - & - & - & - & - \tabularnewline
97 & 11651 & 10547.6976 & 6980.6036 & 14114.7915 & 0.2722 & 0.4776 & 0.2868 & 0.4776 \tabularnewline
98 & 13735 & 11238.2191 & 6194.4144 & 16282.0238 & 0.166 & 0.4363 & 0.3286 & 0.5904 \tabularnewline
99 & 13360 & 14571.782 & 8394.7461 & 20748.8179 & 0.3503 & 0.6047 & 0.2506 & 0.8933 \tabularnewline
100 & 17818 & 13922.6163 & 6790.1849 & 21055.0478 & 0.1422 & 0.5614 & 0.2792 & 0.8158 \tabularnewline
101 & 20613 & 14648.8933 & 6674.7234 & 22623.0632 & 0.0713 & 0.218 & 0.3282 & 0.8372 \tabularnewline
102 & 16231 & 14286.4203 & 5551.2505 & 23021.5902 & 0.3313 & 0.0779 & 0.4576 & 0.7927 \tabularnewline
103 & 13862 & 12302.4413 & 2867.4533 & 21737.4293 & 0.373 & 0.2072 & 0.3894 & 0.6343 \tabularnewline
104 & 12004 & 11535.8736 & 1449.5063 & 21622.2409 & 0.4638 & 0.3256 & 0.3528 & 0.5683 \tabularnewline
105 & 17734 & 14792.7228 & 4094.5635 & 25490.882 & 0.295 & 0.6953 & 0.2742 & 0.7761 \tabularnewline
106 & 15034 & 14175.9909 & 2899.182 & 25452.7997 & 0.4407 & 0.2682 & 0.3393 & 0.73 \tabularnewline
107 & 12609 & 13106.5993 & 1279.4178 & 24933.7809 & 0.4671 & 0.3747 & 0.4068 & 0.658 \tabularnewline
108 & 12320 & 10254.0909 & -2098.9666 & 22607.1484 & 0.3715 & 0.3543 & 0.475 & 0.475 \tabularnewline
109 & 10833 & 10151.7884 & -3122.416 & 23425.9928 & 0.4599 & 0.3744 & 0.4124 & 0.4707 \tabularnewline
110 & 11350 & 10842.31 & -3292.2547 & 24976.8747 & 0.4719 & 0.5005 & 0.3442 & 0.5106 \tabularnewline
111 & 13648 & 14175.8728 & -769.6059 & 29121.3516 & 0.4724 & 0.6445 & 0.5426 & 0.6781 \tabularnewline
112 & 14890 & 13526.7072 & -2187.8959 & 29241.3103 & 0.4325 & 0.494 & 0.2962 & 0.6401 \tabularnewline
113 & 16325 & 14252.9842 & -2194.8172 & 30700.7855 & 0.4025 & 0.4697 & 0.2243 & 0.6662 \tabularnewline
114 & 18045 & 13890.5112 & -3259.1705 & 31040.1929 & 0.3175 & 0.3904 & 0.3945 & 0.6444 \tabularnewline
115 & 15616 & 11906.5322 & -5917.4124 & 29730.4767 & 0.3417 & 0.2498 & 0.4149 & 0.5549 \tabularnewline
116 & 11926 & 11139.9645 & -7333.6496 & 29613.5785 & 0.4668 & 0.3174 & 0.4635 & 0.5207 \tabularnewline
117 & 16855 & 14396.8136 & -4704.3861 & 33498.0134 & 0.4004 & 0.6001 & 0.366 & 0.6497 \tabularnewline
118 & 15083 & 13780.0817 & -5928.7297 & 33488.8931 & 0.4485 & 0.3799 & 0.4504 & 0.6222 \tabularnewline
119 & 12520 & 12710.6902 & -7587.5526 & 33008.9331 & 0.4927 & 0.4094 & 0.5039 & 0.5789 \tabularnewline
120 & 12355 & 9858.1817 & -11012.8527 & 30729.2162 & 0.4073 & 0.4013 & 0.4086 & 0.4704 \tabularnewline
\hline
\end{tabular}
%Source: https://freestatistics.org/blog/index.php?pk=108113&T=1

[TABLE]
[ROW][C]Univariate ARIMA Extrapolation Forecast[/C][/ROW]
[ROW][C]time[/C][C]Y[t][/C][C]F[t][/C][C]95% LB[/C][C]95% UB[/C][C]p-value(H0: Y[t] = F[t])[/C][C]P(F[t]>Y[t-1])[/C][C]P(F[t]>Y[t-s])[/C][C]P(F[t]>Y[96])[/C][/ROW]
[ROW][C]84[/C][C]9893[/C][C]-[/C][C]-[/C][C]-[/C][C]-[/C][C]-[/C][C]-[/C][C]-[/C][/ROW]
[ROW][C]85[/C][C]11572[/C][C]-[/C][C]-[/C][C]-[/C][C]-[/C][C]-[/C][C]-[/C][C]-[/C][/ROW]
[ROW][C]86[/C][C]12380[/C][C]-[/C][C]-[/C][C]-[/C][C]-[/C][C]-[/C][C]-[/C][C]-[/C][/ROW]
[ROW][C]87[/C][C]16692[/C][C]-[/C][C]-[/C][C]-[/C][C]-[/C][C]-[/C][C]-[/C][C]-[/C][/ROW]
[ROW][C]88[/C][C]16052[/C][C]-[/C][C]-[/C][C]-[/C][C]-[/C][C]-[/C][C]-[/C][C]-[/C][/ROW]
[ROW][C]89[/C][C]16459[/C][C]-[/C][C]-[/C][C]-[/C][C]-[/C][C]-[/C][C]-[/C][C]-[/C][/ROW]
[ROW][C]90[/C][C]14761[/C][C]-[/C][C]-[/C][C]-[/C][C]-[/C][C]-[/C][C]-[/C][C]-[/C][/ROW]
[ROW][C]91[/C][C]13654[/C][C]-[/C][C]-[/C][C]-[/C][C]-[/C][C]-[/C][C]-[/C][C]-[/C][/ROW]
[ROW][C]92[/C][C]13480[/C][C]-[/C][C]-[/C][C]-[/C][C]-[/C][C]-[/C][C]-[/C][C]-[/C][/ROW]
[ROW][C]93[/C][C]18068[/C][C]-[/C][C]-[/C][C]-[/C][C]-[/C][C]-[/C][C]-[/C][C]-[/C][/ROW]
[ROW][C]94[/C][C]16560[/C][C]-[/C][C]-[/C][C]-[/C][C]-[/C][C]-[/C][C]-[/C][C]-[/C][/ROW]
[ROW][C]95[/C][C]14530[/C][C]-[/C][C]-[/C][C]-[/C][C]-[/C][C]-[/C][C]-[/C][C]-[/C][/ROW]
[ROW][C]96[/C][C]10650[/C][C]-[/C][C]-[/C][C]-[/C][C]-[/C][C]-[/C][C]-[/C][C]-[/C][/ROW]
[ROW][C]97[/C][C]11651[/C][C]10547.6976[/C][C]6980.6036[/C][C]14114.7915[/C][C]0.2722[/C][C]0.4776[/C][C]0.2868[/C][C]0.4776[/C][/ROW]
[ROW][C]98[/C][C]13735[/C][C]11238.2191[/C][C]6194.4144[/C][C]16282.0238[/C][C]0.166[/C][C]0.4363[/C][C]0.3286[/C][C]0.5904[/C][/ROW]
[ROW][C]99[/C][C]13360[/C][C]14571.782[/C][C]8394.7461[/C][C]20748.8179[/C][C]0.3503[/C][C]0.6047[/C][C]0.2506[/C][C]0.8933[/C][/ROW]
[ROW][C]100[/C][C]17818[/C][C]13922.6163[/C][C]6790.1849[/C][C]21055.0478[/C][C]0.1422[/C][C]0.5614[/C][C]0.2792[/C][C]0.8158[/C][/ROW]
[ROW][C]101[/C][C]20613[/C][C]14648.8933[/C][C]6674.7234[/C][C]22623.0632[/C][C]0.0713[/C][C]0.218[/C][C]0.3282[/C][C]0.8372[/C][/ROW]
[ROW][C]102[/C][C]16231[/C][C]14286.4203[/C][C]5551.2505[/C][C]23021.5902[/C][C]0.3313[/C][C]0.0779[/C][C]0.4576[/C][C]0.7927[/C][/ROW]
[ROW][C]103[/C][C]13862[/C][C]12302.4413[/C][C]2867.4533[/C][C]21737.4293[/C][C]0.373[/C][C]0.2072[/C][C]0.3894[/C][C]0.6343[/C][/ROW]
[ROW][C]104[/C][C]12004[/C][C]11535.8736[/C][C]1449.5063[/C][C]21622.2409[/C][C]0.4638[/C][C]0.3256[/C][C]0.3528[/C][C]0.5683[/C][/ROW]
[ROW][C]105[/C][C]17734[/C][C]14792.7228[/C][C]4094.5635[/C][C]25490.882[/C][C]0.295[/C][C]0.6953[/C][C]0.2742[/C][C]0.7761[/C][/ROW]
[ROW][C]106[/C][C]15034[/C][C]14175.9909[/C][C]2899.182[/C][C]25452.7997[/C][C]0.4407[/C][C]0.2682[/C][C]0.3393[/C][C]0.73[/C][/ROW]
[ROW][C]107[/C][C]12609[/C][C]13106.5993[/C][C]1279.4178[/C][C]24933.7809[/C][C]0.4671[/C][C]0.3747[/C][C]0.4068[/C][C]0.658[/C][/ROW]
[ROW][C]108[/C][C]12320[/C][C]10254.0909[/C][C]-2098.9666[/C][C]22607.1484[/C][C]0.3715[/C][C]0.3543[/C][C]0.475[/C][C]0.475[/C][/ROW]
[ROW][C]109[/C][C]10833[/C][C]10151.7884[/C][C]-3122.416[/C][C]23425.9928[/C][C]0.4599[/C][C]0.3744[/C][C]0.4124[/C][C]0.4707[/C][/ROW]
[ROW][C]110[/C][C]11350[/C][C]10842.31[/C][C]-3292.2547[/C][C]24976.8747[/C][C]0.4719[/C][C]0.5005[/C][C]0.3442[/C][C]0.5106[/C][/ROW]
[ROW][C]111[/C][C]13648[/C][C]14175.8728[/C][C]-769.6059[/C][C]29121.3516[/C][C]0.4724[/C][C]0.6445[/C][C]0.5426[/C][C]0.6781[/C][/ROW]
[ROW][C]112[/C][C]14890[/C][C]13526.7072[/C][C]-2187.8959[/C][C]29241.3103[/C][C]0.4325[/C][C]0.494[/C][C]0.2962[/C][C]0.6401[/C][/ROW]
[ROW][C]113[/C][C]16325[/C][C]14252.9842[/C][C]-2194.8172[/C][C]30700.7855[/C][C]0.4025[/C][C]0.4697[/C][C]0.2243[/C][C]0.6662[/C][/ROW]
[ROW][C]114[/C][C]18045[/C][C]13890.5112[/C][C]-3259.1705[/C][C]31040.1929[/C][C]0.3175[/C][C]0.3904[/C][C]0.3945[/C][C]0.6444[/C][/ROW]
[ROW][C]115[/C][C]15616[/C][C]11906.5322[/C][C]-5917.4124[/C][C]29730.4767[/C][C]0.3417[/C][C]0.2498[/C][C]0.4149[/C][C]0.5549[/C][/ROW]
[ROW][C]116[/C][C]11926[/C][C]11139.9645[/C][C]-7333.6496[/C][C]29613.5785[/C][C]0.4668[/C][C]0.3174[/C][C]0.4635[/C][C]0.5207[/C][/ROW]
[ROW][C]117[/C][C]16855[/C][C]14396.8136[/C][C]-4704.3861[/C][C]33498.0134[/C][C]0.4004[/C][C]0.6001[/C][C]0.366[/C][C]0.6497[/C][/ROW]
[ROW][C]118[/C][C]15083[/C][C]13780.0817[/C][C]-5928.7297[/C][C]33488.8931[/C][C]0.4485[/C][C]0.3799[/C][C]0.4504[/C][C]0.6222[/C][/ROW]
[ROW][C]119[/C][C]12520[/C][C]12710.6902[/C][C]-7587.5526[/C][C]33008.9331[/C][C]0.4927[/C][C]0.4094[/C][C]0.5039[/C][C]0.5789[/C][/ROW]
[ROW][C]120[/C][C]12355[/C][C]9858.1817[/C][C]-11012.8527[/C][C]30729.2162[/C][C]0.4073[/C][C]0.4013[/C][C]0.4086[/C][C]0.4704[/C][/ROW]
[/TABLE]
Source: https://freestatistics.org/blog/index.php?pk=108113&T=1

Globally Unique Identifier (entire table): ba.freestatistics.org/blog/index.php?pk=108113&T=1

As an alternative you can also use a QR Code:  

The GUIDs for individual cells are displayed in the table below:

Univariate ARIMA Extrapolation Forecast
timeY[t]F[t]95% LB95% UBp-value(H0: Y[t] = F[t])P(F[t]>Y[t-1])P(F[t]>Y[t-s])P(F[t]>Y[96])
849893-------
8511572-------
8612380-------
8716692-------
8816052-------
8916459-------
9014761-------
9113654-------
9213480-------
9318068-------
9416560-------
9514530-------
9610650-------
971165110547.69766980.603614114.79150.27220.47760.28680.4776
981373511238.21916194.414416282.02380.1660.43630.32860.5904
991336014571.7828394.746120748.81790.35030.60470.25060.8933
1001781813922.61636790.184921055.04780.14220.56140.27920.8158
1012061314648.89336674.723422623.06320.07130.2180.32820.8372
1021623114286.42035551.250523021.59020.33130.07790.45760.7927
1031386212302.44132867.453321737.42930.3730.20720.38940.6343
1041200411535.87361449.506321622.24090.46380.32560.35280.5683
1051773414792.72284094.563525490.8820.2950.69530.27420.7761
1061503414175.99092899.18225452.79970.44070.26820.33930.73
1071260913106.59931279.417824933.78090.46710.37470.40680.658
1081232010254.0909-2098.966622607.14840.37150.35430.4750.475
1091083310151.7884-3122.41623425.99280.45990.37440.41240.4707
1101135010842.31-3292.254724976.87470.47190.50050.34420.5106
1111364814175.8728-769.605929121.35160.47240.64450.54260.6781
1121489013526.7072-2187.895929241.31030.43250.4940.29620.6401
1131632514252.9842-2194.817230700.78550.40250.46970.22430.6662
1141804513890.5112-3259.170531040.19290.31750.39040.39450.6444
1151561611906.5322-5917.412429730.47670.34170.24980.41490.5549
1161192611139.9645-7333.649629613.57850.46680.31740.46350.5207
1171685514396.8136-4704.386133498.01340.40040.60010.3660.6497
1181508313780.0817-5928.729733488.89310.44850.37990.45040.6222
1191252012710.6902-7587.552633008.93310.49270.40940.50390.5789
120123559858.1817-11012.852730729.21620.40730.40130.40860.4704


Univariate ARIMA Extrapolation Forecast Performance
time% S.E.PEMAPESq.EMSERMSE
970.17250.104601217276.245200
980.2290.22220.16346233914.8063725595.52561930.1802
990.2163-0.08320.13661468415.55182973202.2011724.2976
1000.26140.27980.172415174013.81856023405.10532454.2626
1010.27770.40710.219435570568.919211932837.86813454.394
1020.3120.13610.20553781390.043710574263.23073251.8092
1030.39130.12680.19422432223.2779411114.66593067.754
1040.44610.04060.175219142.32818262118.12372874.39
1050.3690.19880.17778651111.72918305339.63542881.8986
1060.40590.06050.166736179.67047548423.63892747.4395
1070.4604-0.0380.1543247605.11296884712.86382623.8736
1080.61460.20150.15834267980.54666666651.83742581.986
1090.66710.06710.1512464049.18966189528.55682487.8763
1100.66510.04680.1438257749.15835765830.02832401.2143
1110.5379-0.03720.1367278649.73575400018.00882323.7939
1120.59270.10080.13441858567.22595178677.33492275.6707
1130.58880.14540.13514293249.67915126593.35512264.1982
1140.62990.29910.144217259777.11055800659.11932408.4558
1150.76380.31150.15313760151.45866219579.76872493.9085
1160.84610.07060.1489617851.86235939493.37342437.1076
1170.67690.17070.14996042680.1845944407.03112438.1155
1180.72970.09460.14741697596.00555751370.16632398.2014
1190.8148-0.0150.141636362.75875502891.58332345.8243
1201.08020.25330.14636234101.45545533358.66132352.3092

\begin{tabular}{lllllllll}
\hline
Univariate ARIMA Extrapolation Forecast Performance \tabularnewline
time & % S.E. & PE & MAPE & Sq.E & MSE & RMSE \tabularnewline
97 & 0.1725 & 0.1046 & 0 & 1217276.2452 & 0 & 0 \tabularnewline
98 & 0.229 & 0.2222 & 0.1634 & 6233914.806 & 3725595.5256 & 1930.1802 \tabularnewline
99 & 0.2163 & -0.0832 & 0.1366 & 1468415.5518 & 2973202.201 & 1724.2976 \tabularnewline
100 & 0.2614 & 0.2798 & 0.1724 & 15174013.8185 & 6023405.1053 & 2454.2626 \tabularnewline
101 & 0.2777 & 0.4071 & 0.2194 & 35570568.9192 & 11932837.8681 & 3454.394 \tabularnewline
102 & 0.312 & 0.1361 & 0.2055 & 3781390.0437 & 10574263.2307 & 3251.8092 \tabularnewline
103 & 0.3913 & 0.1268 & 0.1942 & 2432223.277 & 9411114.6659 & 3067.754 \tabularnewline
104 & 0.4461 & 0.0406 & 0.175 & 219142.3281 & 8262118.1237 & 2874.39 \tabularnewline
105 & 0.369 & 0.1988 & 0.1777 & 8651111.7291 & 8305339.6354 & 2881.8986 \tabularnewline
106 & 0.4059 & 0.0605 & 0.166 & 736179.6704 & 7548423.6389 & 2747.4395 \tabularnewline
107 & 0.4604 & -0.038 & 0.1543 & 247605.1129 & 6884712.8638 & 2623.8736 \tabularnewline
108 & 0.6146 & 0.2015 & 0.1583 & 4267980.5466 & 6666651.8374 & 2581.986 \tabularnewline
109 & 0.6671 & 0.0671 & 0.1512 & 464049.1896 & 6189528.5568 & 2487.8763 \tabularnewline
110 & 0.6651 & 0.0468 & 0.1438 & 257749.1583 & 5765830.0283 & 2401.2143 \tabularnewline
111 & 0.5379 & -0.0372 & 0.1367 & 278649.7357 & 5400018.0088 & 2323.7939 \tabularnewline
112 & 0.5927 & 0.1008 & 0.1344 & 1858567.2259 & 5178677.3349 & 2275.6707 \tabularnewline
113 & 0.5888 & 0.1454 & 0.1351 & 4293249.6791 & 5126593.3551 & 2264.1982 \tabularnewline
114 & 0.6299 & 0.2991 & 0.1442 & 17259777.1105 & 5800659.1193 & 2408.4558 \tabularnewline
115 & 0.7638 & 0.3115 & 0.153 & 13760151.4586 & 6219579.7687 & 2493.9085 \tabularnewline
116 & 0.8461 & 0.0706 & 0.1489 & 617851.8623 & 5939493.3734 & 2437.1076 \tabularnewline
117 & 0.6769 & 0.1707 & 0.1499 & 6042680.184 & 5944407.0311 & 2438.1155 \tabularnewline
118 & 0.7297 & 0.0946 & 0.1474 & 1697596.0055 & 5751370.1663 & 2398.2014 \tabularnewline
119 & 0.8148 & -0.015 & 0.1416 & 36362.7587 & 5502891.5833 & 2345.8243 \tabularnewline
120 & 1.0802 & 0.2533 & 0.1463 & 6234101.4554 & 5533358.6613 & 2352.3092 \tabularnewline
\hline
\end{tabular}
%Source: https://freestatistics.org/blog/index.php?pk=108113&T=2

[TABLE]
[ROW][C]Univariate ARIMA Extrapolation Forecast Performance[/C][/ROW]
[ROW][C]time[/C][C]% S.E.[/C][C]PE[/C][C]MAPE[/C][C]Sq.E[/C][C]MSE[/C][C]RMSE[/C][/ROW]
[ROW][C]97[/C][C]0.1725[/C][C]0.1046[/C][C]0[/C][C]1217276.2452[/C][C]0[/C][C]0[/C][/ROW]
[ROW][C]98[/C][C]0.229[/C][C]0.2222[/C][C]0.1634[/C][C]6233914.806[/C][C]3725595.5256[/C][C]1930.1802[/C][/ROW]
[ROW][C]99[/C][C]0.2163[/C][C]-0.0832[/C][C]0.1366[/C][C]1468415.5518[/C][C]2973202.201[/C][C]1724.2976[/C][/ROW]
[ROW][C]100[/C][C]0.2614[/C][C]0.2798[/C][C]0.1724[/C][C]15174013.8185[/C][C]6023405.1053[/C][C]2454.2626[/C][/ROW]
[ROW][C]101[/C][C]0.2777[/C][C]0.4071[/C][C]0.2194[/C][C]35570568.9192[/C][C]11932837.8681[/C][C]3454.394[/C][/ROW]
[ROW][C]102[/C][C]0.312[/C][C]0.1361[/C][C]0.2055[/C][C]3781390.0437[/C][C]10574263.2307[/C][C]3251.8092[/C][/ROW]
[ROW][C]103[/C][C]0.3913[/C][C]0.1268[/C][C]0.1942[/C][C]2432223.277[/C][C]9411114.6659[/C][C]3067.754[/C][/ROW]
[ROW][C]104[/C][C]0.4461[/C][C]0.0406[/C][C]0.175[/C][C]219142.3281[/C][C]8262118.1237[/C][C]2874.39[/C][/ROW]
[ROW][C]105[/C][C]0.369[/C][C]0.1988[/C][C]0.1777[/C][C]8651111.7291[/C][C]8305339.6354[/C][C]2881.8986[/C][/ROW]
[ROW][C]106[/C][C]0.4059[/C][C]0.0605[/C][C]0.166[/C][C]736179.6704[/C][C]7548423.6389[/C][C]2747.4395[/C][/ROW]
[ROW][C]107[/C][C]0.4604[/C][C]-0.038[/C][C]0.1543[/C][C]247605.1129[/C][C]6884712.8638[/C][C]2623.8736[/C][/ROW]
[ROW][C]108[/C][C]0.6146[/C][C]0.2015[/C][C]0.1583[/C][C]4267980.5466[/C][C]6666651.8374[/C][C]2581.986[/C][/ROW]
[ROW][C]109[/C][C]0.6671[/C][C]0.0671[/C][C]0.1512[/C][C]464049.1896[/C][C]6189528.5568[/C][C]2487.8763[/C][/ROW]
[ROW][C]110[/C][C]0.6651[/C][C]0.0468[/C][C]0.1438[/C][C]257749.1583[/C][C]5765830.0283[/C][C]2401.2143[/C][/ROW]
[ROW][C]111[/C][C]0.5379[/C][C]-0.0372[/C][C]0.1367[/C][C]278649.7357[/C][C]5400018.0088[/C][C]2323.7939[/C][/ROW]
[ROW][C]112[/C][C]0.5927[/C][C]0.1008[/C][C]0.1344[/C][C]1858567.2259[/C][C]5178677.3349[/C][C]2275.6707[/C][/ROW]
[ROW][C]113[/C][C]0.5888[/C][C]0.1454[/C][C]0.1351[/C][C]4293249.6791[/C][C]5126593.3551[/C][C]2264.1982[/C][/ROW]
[ROW][C]114[/C][C]0.6299[/C][C]0.2991[/C][C]0.1442[/C][C]17259777.1105[/C][C]5800659.1193[/C][C]2408.4558[/C][/ROW]
[ROW][C]115[/C][C]0.7638[/C][C]0.3115[/C][C]0.153[/C][C]13760151.4586[/C][C]6219579.7687[/C][C]2493.9085[/C][/ROW]
[ROW][C]116[/C][C]0.8461[/C][C]0.0706[/C][C]0.1489[/C][C]617851.8623[/C][C]5939493.3734[/C][C]2437.1076[/C][/ROW]
[ROW][C]117[/C][C]0.6769[/C][C]0.1707[/C][C]0.1499[/C][C]6042680.184[/C][C]5944407.0311[/C][C]2438.1155[/C][/ROW]
[ROW][C]118[/C][C]0.7297[/C][C]0.0946[/C][C]0.1474[/C][C]1697596.0055[/C][C]5751370.1663[/C][C]2398.2014[/C][/ROW]
[ROW][C]119[/C][C]0.8148[/C][C]-0.015[/C][C]0.1416[/C][C]36362.7587[/C][C]5502891.5833[/C][C]2345.8243[/C][/ROW]
[ROW][C]120[/C][C]1.0802[/C][C]0.2533[/C][C]0.1463[/C][C]6234101.4554[/C][C]5533358.6613[/C][C]2352.3092[/C][/ROW]
[/TABLE]
Source: https://freestatistics.org/blog/index.php?pk=108113&T=2

Globally Unique Identifier (entire table): ba.freestatistics.org/blog/index.php?pk=108113&T=2

As an alternative you can also use a QR Code:  

The GUIDs for individual cells are displayed in the table below:

Univariate ARIMA Extrapolation Forecast Performance
time% S.E.PEMAPESq.EMSERMSE
970.17250.104601217276.245200
980.2290.22220.16346233914.8063725595.52561930.1802
990.2163-0.08320.13661468415.55182973202.2011724.2976
1000.26140.27980.172415174013.81856023405.10532454.2626
1010.27770.40710.219435570568.919211932837.86813454.394
1020.3120.13610.20553781390.043710574263.23073251.8092
1030.39130.12680.19422432223.2779411114.66593067.754
1040.44610.04060.175219142.32818262118.12372874.39
1050.3690.19880.17778651111.72918305339.63542881.8986
1060.40590.06050.166736179.67047548423.63892747.4395
1070.4604-0.0380.1543247605.11296884712.86382623.8736
1080.61460.20150.15834267980.54666666651.83742581.986
1090.66710.06710.1512464049.18966189528.55682487.8763
1100.66510.04680.1438257749.15835765830.02832401.2143
1110.5379-0.03720.1367278649.73575400018.00882323.7939
1120.59270.10080.13441858567.22595178677.33492275.6707
1130.58880.14540.13514293249.67915126593.35512264.1982
1140.62990.29910.144217259777.11055800659.11932408.4558
1150.76380.31150.15313760151.45866219579.76872493.9085
1160.84610.07060.1489617851.86235939493.37342437.1076
1170.67690.17070.14996042680.1845944407.03112438.1155
1180.72970.09460.14741697596.00555751370.16632398.2014
1190.8148-0.0150.141636362.75875502891.58332345.8243
1201.08020.25330.14636234101.45545533358.66132352.3092


Parameters (Session):
par1 = 24 ; par2 = 1 ; par3 = 1 ; par4 = 1 ; par5 = 12 ; par6 = 0 ; par7 = 0 ; par8 = 0 ; par9 = 1 ; par10 = FALSE ;
Parameters (R input):
par1 = 24 ; par2 = 1 ; par3 = 1 ; par4 = 1 ; par5 = 12 ; par6 = 0 ; par7 = 0 ; par8 = 0 ; par9 = 1 ; par10 = FALSE ;
R code (references can be found in the software module):
par1 <- as.numeric(par1) #cut off periods
par2 <- as.numeric(par2) #lambda
par3 <- as.numeric(par3) #degree of non-seasonal differencing
par4 <- as.numeric(par4) #degree of seasonal differencing
par5 <- as.numeric(par5) #seasonal period
par6 <- as.numeric(par6) #p
par7 <- as.numeric(par7) #q
par8 <- as.numeric(par8) #P
par9 <- as.numeric(par9) #Q
if (par10 == 'TRUE') par10 <- TRUE
if (par10 == 'FALSE') par10 <- FALSE
if (par2 == 0) x <- log(x)
if (par2 != 0) x <- x^par2
lx <- length(x)
first <- lx - 2*par1
nx <- lx - par1
nx1 <- nx + 1
fx <- lx - nx
if (fx < 1) {
fx <- par5
nx1 <- lx + fx - 1
first <- lx - 2*fx
}
first <- 1
if (fx < 3) fx <- round(lx/10,0)
(arima.out <- arima(x[1:nx], order=c(par6,par3,par7), seasonal=list(order=c(par8,par4,par9), period=par5), include.mean=par10, method='ML'))
(forecast <- predict(arima.out,par1))
(lb <- forecast$pred - 1.96 * forecast$se)
(ub <- forecast$pred + 1.96 * forecast$se)
if (par2 == 0) {
x <- exp(x)
forecast$pred <- exp(forecast$pred)
lb <- exp(lb)
ub <- exp(ub)
}
if (par2 != 0) {
x <- x^(1/par2)
forecast$pred <- forecast$pred^(1/par2)
lb <- lb^(1/par2)
ub <- ub^(1/par2)
}
if (par2 < 0) {
olb <- lb
lb <- ub
ub <- olb
}
(actandfor <- c(x[1:nx], forecast$pred))
(perc.se <- (ub-forecast$pred)/1.96/forecast$pred)
bitmap(file='test1.png')
opar <- par(mar=c(4,4,2,2),las=1)
ylim <- c( min(x[first:nx],lb), max(x[first:nx],ub))
plot(x,ylim=ylim,type='n',xlim=c(first,lx))
usr <- par('usr')
rect(usr[1],usr[3],nx+1,usr[4],border=NA,col='lemonchiffon')
rect(nx1,usr[3],usr[2],usr[4],border=NA,col='lavender')
abline(h= (-3:3)*2 , col ='gray', lty =3)
polygon( c(nx1:lx,lx:nx1), c(lb,rev(ub)), col = 'orange', lty=2,border=NA)
lines(nx1:lx, lb , lty=2)
lines(nx1:lx, ub , lty=2)
lines(x, lwd=2)
lines(nx1:lx, forecast$pred , lwd=2 , col ='white')
box()
par(opar)
dev.off()
prob.dec <- array(NA, dim=fx)
prob.sdec <- array(NA, dim=fx)
prob.ldec <- array(NA, dim=fx)
prob.pval <- array(NA, dim=fx)
perf.pe <- array(0, dim=fx)
perf.mape <- array(0, dim=fx)
perf.mape1 <- array(0, dim=fx)
perf.se <- array(0, dim=fx)
perf.mse <- array(0, dim=fx)
perf.mse1 <- array(0, dim=fx)
perf.rmse <- array(0, dim=fx)
for (i in 1:fx) {
locSD <- (ub[i] - forecast$pred[i]) / 1.96
perf.pe[i] = (x[nx+i] - forecast$pred[i]) / forecast$pred[i]
perf.se[i] = (x[nx+i] - forecast$pred[i])^2
prob.dec[i] = pnorm((x[nx+i-1] - forecast$pred[i]) / locSD)
prob.sdec[i] = pnorm((x[nx+i-par5] - forecast$pred[i]) / locSD)
prob.ldec[i] = pnorm((x[nx] - forecast$pred[i]) / locSD)
prob.pval[i] = pnorm(abs(x[nx+i] - forecast$pred[i]) / locSD)
}
perf.mape[1] = abs(perf.pe[1])
perf.mse[1] = abs(perf.se[1])
for (i in 2:fx) {
perf.mape[i] = perf.mape[i-1] + abs(perf.pe[i])
perf.mape1[i] = perf.mape[i] / i
perf.mse[i] = perf.mse[i-1] + perf.se[i]
perf.mse1[i] = perf.mse[i] / i
}
perf.rmse = sqrt(perf.mse1)
bitmap(file='test2.png')
plot(forecast$pred, pch=19, type='b',main='ARIMA Extrapolation Forecast', ylab='Forecast and 95% CI', xlab='time',ylim=c(min(lb),max(ub)))
dum <- forecast$pred
dum[1:par1] <- x[(nx+1):lx]
lines(dum, lty=1)
lines(ub,lty=3)
lines(lb,lty=3)
dev.off()
load(file='createtable')
a<-table.start()
a<-table.row.start(a)
a<-table.element(a,'Univariate ARIMA Extrapolation Forecast',9,TRUE)
a<-table.row.end(a)
a<-table.row.start(a)
a<-table.element(a,'time',1,header=TRUE)
a<-table.element(a,'Y[t]',1,header=TRUE)
a<-table.element(a,'F[t]',1,header=TRUE)
a<-table.element(a,'95% LB',1,header=TRUE)
a<-table.element(a,'95% UB',1,header=TRUE)
a<-table.element(a,'p-value
(H0: Y[t] = F[t])',1,header=TRUE)
a<-table.element(a,'P(F[t]>Y[t-1])',1,header=TRUE)
a<-table.element(a,'P(F[t]>Y[t-s])',1,header=TRUE)
mylab <- paste('P(F[t]>Y[',nx,sep='')
mylab <- paste(mylab,'])',sep='')
a<-table.element(a,mylab,1,header=TRUE)
a<-table.row.end(a)
for (i in (nx-par5):nx) {
a<-table.row.start(a)
a<-table.element(a,i,header=TRUE)
a<-table.element(a,x[i])
a<-table.element(a,'-')
a<-table.row.end(a)
}
for (i in 1:fx) {
a<-table.row.start(a)
a<-table.element(a,nx+i,header=TRUE)
a<-table.element(a,round(x[nx+i],4))
a<-table.element(a,round(forecast$pred[i],4))
a<-table.element(a,round(lb[i],4))
a<-table.element(a,round(ub[i],4))
a<-table.element(a,round((1-prob.pval[i]),4))
a<-table.element(a,round((1-prob.dec[i]),4))
a<-table.element(a,round((1-prob.sdec[i]),4))
a<-table.element(a,round((1-prob.ldec[i]),4))
a<-table.row.end(a)
}
a<-table.end(a)
table.save(a,file='mytable.tab')
a<-table.start()
a<-table.row.start(a)
a<-table.element(a,'Univariate ARIMA Extrapolation Forecast Performance',7,TRUE)
a<-table.row.end(a)
a<-table.row.start(a)
a<-table.element(a,'time',1,header=TRUE)
a<-table.element(a,'% S.E.',1,header=TRUE)
a<-table.element(a,'PE',1,header=TRUE)
a<-table.element(a,'MAPE',1,header=TRUE)
a<-table.element(a,'Sq.E',1,header=TRUE)
a<-table.element(a,'MSE',1,header=TRUE)
a<-table.element(a,'RMSE',1,header=TRUE)
a<-table.row.end(a)
for (i in 1:fx) {
a<-table.row.start(a)
a<-table.element(a,nx+i,header=TRUE)
a<-table.element(a,round(perc.se[i],4))
a<-table.element(a,round(perf.pe[i],4))
a<-table.element(a,round(perf.mape1[i],4))
a<-table.element(a,round(perf.se[i],4))
a<-table.element(a,round(perf.mse1[i],4))
a<-table.element(a,round(perf.rmse[i],4))
a<-table.row.end(a)
}
a<-table.end(a)
table.save(a,file='mytable1.tab')