| Multiple Linear Regression - Estimated Regression Equation |
| Yt[t] = + 54.1289882375707 + 0.0743007158608039`Yt-1`[t] + 0.0785777695501799`Yt-2`[t] -0.161410948493399`Yt-3`[t] -0.0651190403399635`Yt-4`[t] -0.0877429693266317`Yt-5`[t] -0.116882268075762`Yt-6`[t] -0.0333284658880138`Yt-7`[t] -6.96007335314391M1[t] + 24.4760936488194M2[t] + 25.2621720483599M3[t] + 5.75978078634362M4[t] + 17.1927602981443M5[t] + 11.9528555928096M6[t] + 8.5129331116677M7[t] + 26.9648752251198M8[t] + 10.6154076472889M9[t] + 8.92522966959725M10[t] + 23.8060185192799M11[t] + 0.00905195872685246t + e[t] |
| Multiple Linear Regression - Ordinary Least Squares | |||||
| Variable | Parameter | S.D. | T-STAT H0: parameter = 0 | 2-tail p-value | 1-tail p-value |
| (Intercept) | 54.1289882375707 | 26.324613 | 2.0562 | 0.045589 | 0.022795 |
| `Yt-1` | 0.0743007158608039 | 0.152033 | 0.4887 | 0.627417 | 0.313709 |
| `Yt-2` | 0.0785777695501799 | 0.151406 | 0.519 | 0.606313 | 0.303157 |
| `Yt-3` | -0.161410948493399 | 0.150009 | -1.076 | 0.287659 | 0.143829 |
| `Yt-4` | -0.0651190403399635 | 0.157392 | -0.4137 | 0.681031 | 0.340515 |
| `Yt-5` | -0.0877429693266317 | 0.157252 | -0.558 | 0.579625 | 0.289813 |
| `Yt-6` | -0.116882268075762 | 0.155699 | -0.7507 | 0.456744 | 0.228372 |
| `Yt-7` | -0.0333284658880138 | 0.158656 | -0.2101 | 0.834564 | 0.417282 |
| M1 | -6.96007335314391 | 7.519101 | -0.9257 | 0.359564 | 0.179782 |
| M2 | 24.4760936488194 | 8.155344 | 3.0012 | 0.004375 | 0.002187 |
| M3 | 25.2621720483599 | 6.04489 | 4.1791 | 0.000133 | 6.7e-05 |
| M4 | 5.75978078634362 | 7.66477 | 0.7515 | 0.456287 | 0.228144 |
| M5 | 17.1927602981443 | 8.936198 | 1.9239 | 0.0607 | 0.03035 |
| M6 | 11.9528555928096 | 7.32759 | 1.6312 | 0.109826 | 0.054913 |
| M7 | 8.5129331116677 | 7.461836 | 1.1409 | 0.259962 | 0.129981 |
| M8 | 26.9648752251198 | 8.368565 | 3.2222 | 0.002367 | 0.001184 |
| M9 | 10.6154076472889 | 5.971208 | 1.7778 | 0.0822 | 0.0411 |
| M10 | 8.92522966959725 | 6.805117 | 1.3115 | 0.196326 | 0.098163 |
| M11 | 23.8060185192799 | 7.018994 | 3.3917 | 0.001457 | 0.000728 |
| t | 0.00905195872685246 | 0.061558 | 0.147 | 0.88375 | 0.441875 |
| Multiple Linear Regression - Regression Statistics | |
| Multiple R | 0.811379738044797 |
| R-squared | 0.658337079309643 |
| Adjusted R-squared | 0.514079401684825 |
| F-TEST (value) | 4.56361900558133 |
| F-TEST (DF numerator) | 19 |
| F-TEST (DF denominator) | 45 |
| p-value | 1.44195929475677e-05 |
| Multiple Linear Regression - Residual Statistics | |
| Residual Standard Deviation | 8.58721839245433 |
| Sum Squared Residuals | 3318.31438738677 |
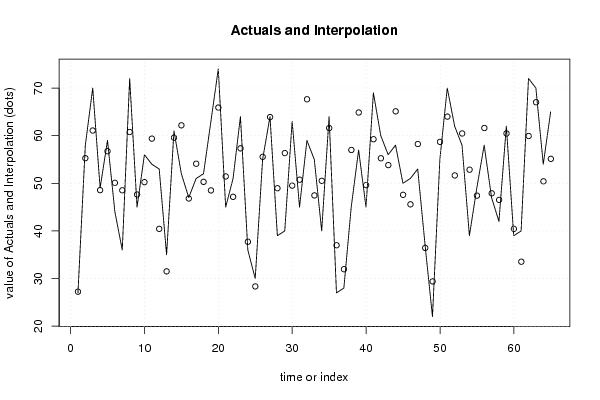
| Multiple Linear Regression - Actuals, Interpolation, and Residuals | |||
| Time or Index | Actuals | Interpolation Forecast | Residuals Prediction Error |
| 1 | 27 | 27.2428357162288 | -0.242835716228843 |
| 2 | 58 | 55.2705917174992 | 2.72940828250075 |
| 3 | 70 | 61.0744223249019 | 8.92557767509808 |
| 4 | 49 | 48.5576891750165 | 0.442310824983464 |
| 5 | 59 | 56.7278070567268 | 2.27219294327316 |
| 6 | 44 | 50.1002682101377 | -6.10026821013769 |
| 7 | 36 | 48.5317551012895 | -12.5317551012895 |
| 8 | 72 | 60.7633998456986 | 11.2366001543014 |
| 9 | 45 | 47.645994361605 | -2.64599436160503 |
| 10 | 56 | 50.2327782569202 | 5.7672217430798 |
| 11 | 54 | 59.3757049816912 | -5.3757049816912 |
| 12 | 53 | 40.4301957284209 | 12.5698042715791 |
| 13 | 35 | 31.5066499719619 | 3.49335002803808 |
| 14 | 61 | 59.5703169790504 | 1.42968302094963 |
| 15 | 52 | 62.1653389304528 | -10.1653389304528 |
| 16 | 47 | 46.8064808747382 | 0.193519125261784 |
| 17 | 51 | 54.1001612860111 | -3.10016128601111 |
| 18 | 52 | 50.2961386904283 | 1.70386130957168 |
| 19 | 63 | 48.5028981563607 | 14.4971018436393 |
| 20 | 74 | 65.890389420239 | 8.10961057976096 |
| 21 | 45 | 51.4338651770292 | -6.43386517702917 |
| 22 | 51 | 47.1551300454501 | 3.84486995454986 |
| 23 | 64 | 57.3315602427127 | 6.66843975728733 |
| 24 | 36 | 37.7212088739993 | -1.72120887399933 |
| 25 | 30 | 28.3470588412163 | 1.65294115878368 |
| 26 | 55 | 55.5494674237535 | -0.549467423753461 |
| 27 | 64 | 63.9001229281046 | 0.099877071895396 |
| 28 | 39 | 48.9563064278479 | -9.95630642784788 |
| 29 | 40 | 56.3408233183445 | -16.3408233183445 |
| 30 | 63 | 49.5050437694402 | 13.4949562305598 |
| 31 | 45 | 50.7517862508023 | -5.75178625080228 |
| 32 | 59 | 67.6374485666409 | -8.63744856664092 |
| 33 | 55 | 47.4536944352803 | 7.54630556471968 |
| 34 | 40 | 50.5174710112122 | -10.5174710112122 |
| 35 | 64 | 61.5891205353327 | 2.41087946466728 |
| 36 | 27 | 36.9884346576492 | -9.98843465764918 |
| 37 | 28 | 31.9647181737141 | -3.96471817371411 |
| 38 | 45 | 56.9943157283964 | -11.9943157283964 |
| 39 | 57 | 64.8575592417146 | -7.85755924171456 |
| 40 | 45 | 49.6203607760424 | -4.62036077604241 |
| 41 | 69 | 59.245854145702 | 9.75414585429799 |
| 42 | 60 | 55.2483480456154 | 4.75165195438461 |
| 43 | 56 | 53.8147809387266 | 2.18521906127337 |
| 44 | 58 | 65.1056952866532 | -7.10569528665319 |
| 45 | 50 | 47.5731560842657 | 2.42684391573433 |
| 46 | 51 | 45.5833093969619 | 5.41669060303809 |
| 47 | 53 | 58.2409369099814 | -5.2409369099814 |
| 48 | 37 | 36.4352281666435 | 0.564771833356541 |
| 49 | 22 | 29.4040915584221 | -7.40409155842212 |
| 50 | 55 | 58.6911076130842 | -3.69110761308419 |
| 51 | 70 | 63.9924903902232 | 6.00750960977677 |
| 52 | 62 | 51.6440566132173 | 10.3559433867827 |
| 53 | 58 | 60.4573677121149 | -2.45736771211495 |
| 54 | 39 | 52.8502012843783 | -13.8502012843783 |
| 55 | 49 | 47.3987795528208 | 1.60122044717917 |
| 56 | 58 | 61.6030668807683 | -3.60306688076827 |
| 57 | 47 | 47.8932899418198 | -0.893289941819812 |
| 58 | 42 | 46.5113112894556 | -4.51131128945557 |
| 59 | 62 | 60.462677330282 | 1.53732266971797 |
| 60 | 39 | 40.4249325732871 | -1.42493257328708 |
| 61 | 40 | 33.5346457384567 | 6.46535426154332 |
| 62 | 72 | 59.9242005382163 | 12.0757994617837 |
| 63 | 70 | 67.0100661846029 | 2.98993381539714 |
| 64 | 54 | 50.4151061331377 | 3.58489386686232 |
| 65 | 65 | 55.1279864811006 | 9.87201351889938 |
| Goldfeld-Quandt test for Heteroskedasticity | |||
| p-values | Alternative Hypothesis | ||
| breakpoint index | greater | 2-sided | less |
| 23 | 0.813102860224024 | 0.373794279551952 | 0.186897139775976 |
| 24 | 0.798852893690574 | 0.402294212618853 | 0.201147106309426 |
| 25 | 0.74474295149927 | 0.510514097001459 | 0.255257048500729 |
| 26 | 0.713642566884737 | 0.572714866230526 | 0.286357433115263 |
| 27 | 0.629132964686915 | 0.741734070626171 | 0.370867035313085 |
| 28 | 0.557068759749914 | 0.885862480500173 | 0.442931240250087 |
| 29 | 0.651918411467033 | 0.696163177065934 | 0.348081588532967 |
| 30 | 0.802595111463643 | 0.394809777072714 | 0.197404888536357 |
| 31 | 0.728800378845895 | 0.54239924230821 | 0.271199621154105 |
| 32 | 0.693831082593061 | 0.612337834813877 | 0.306168917406939 |
| 33 | 0.694049056694841 | 0.611901886610318 | 0.305950943305159 |
| 34 | 0.717200186849811 | 0.565599626300378 | 0.282799813150189 |
| 35 | 0.65522032660536 | 0.68955934678928 | 0.34477967339464 |
| 36 | 0.614436448264173 | 0.771127103471655 | 0.385563551735827 |
| 37 | 0.519997864254213 | 0.960004271491575 | 0.480002135745787 |
| 38 | 0.573079277518022 | 0.853841444963955 | 0.426920722481978 |
| 39 | 0.459965686204521 | 0.919931372409042 | 0.540034313795479 |
| 40 | 0.426314586167301 | 0.852629172334603 | 0.573685413832699 |
| 41 | 0.396759034122893 | 0.793518068245786 | 0.603240965877107 |
| 42 | 0.502000006633369 | 0.995999986733262 | 0.497999993366631 |
| Meta Analysis of Goldfeld-Quandt test for Heteroskedasticity | |||
| Description | # significant tests | % significant tests | OK/NOK |
| 1% type I error level | 0 | 0 | OK |
| 5% type I error level | 0 | 0 | OK |
| 10% type I error level | 0 | 0 | OK |