| Multiple Linear Regression - Estimated Regression Equation |
| Y[t] = + 8911.90701176469 + 0.397503514887048Y1[t] -0.130306574914554Y2[t] + 0.156160419736908Y3[t] -0.00795077215187155Y4[t] + 291.642374490895M1[t] -531.234917189707M2[t] -2825.79570833536M3[t] -3626.86564899572M4[t] + 713.966769798309M5[t] -1985.5007314796M6[t] -2292.53578267656M7[t] -4193.07741914983M8[t] -3505.00434766720M9[t] -2698.69964404757M10[t] -221.276602119008M11[t] + 30.1446737173865t + e[t] |
| Multiple Linear Regression - Ordinary Least Squares | |||||
| Variable | Parameter | S.D. | T-STAT H0: parameter = 0 | 2-tail p-value | 1-tail p-value |
| (Intercept) | 8911.90701176469 | 2560.604771 | 3.4804 | 0.001248 | 0.000624 |
| Y1 | 0.397503514887048 | 0.158352 | 2.5103 | 0.016323 | 0.008161 |
| Y2 | -0.130306574914554 | 0.172165 | -0.7569 | 0.453675 | 0.226837 |
| Y3 | 0.156160419736908 | 0.171235 | 0.912 | 0.367389 | 0.183694 |
| Y4 | -0.00795077215187155 | 0.16044 | -0.0496 | 0.960729 | 0.480365 |
| M1 | 291.642374490895 | 1051.397165 | 0.2774 | 0.782949 | 0.391475 |
| M2 | -531.234917189707 | 1151.1532 | -0.4615 | 0.647018 | 0.323509 |
| M3 | -2825.79570833536 | 1271.435054 | -2.2225 | 0.032116 | 0.016058 |
| M4 | -3626.86564899572 | 1393.118013 | -2.6034 | 0.012988 | 0.006494 |
| M5 | 713.966769798309 | 1409.396306 | 0.5066 | 0.615304 | 0.307652 |
| M6 | -1985.5007314796 | 1214.253364 | -1.6352 | 0.110062 | 0.055031 |
| M7 | -2292.53578267656 | 1229.464631 | -1.8647 | 0.069767 | 0.034884 |
| M8 | -4193.07741914983 | 1262.335963 | -3.3217 | 0.001951 | 0.000976 |
| M9 | -3505.00434766720 | 1431.977322 | -2.4477 | 0.018983 | 0.009492 |
| M10 | -2698.69964404757 | 1293.213648 | -2.0868 | 0.04349 | 0.021745 |
| M11 | -221.276602119008 | 1165.530832 | -0.1899 | 0.850411 | 0.425205 |
| t | 30.1446737173865 | 19.043477 | 1.5829 | 0.121512 | 0.060756 |
| Multiple Linear Regression - Regression Statistics | |
| Multiple R | 0.856201301737816 |
| R-squared | 0.73308066909753 |
| Adjusted R-squared | 0.62357530257344 |
| F-TEST (value) | 6.69447253926373 |
| F-TEST (DF numerator) | 16 |
| F-TEST (DF denominator) | 39 |
| p-value | 6.4654506637396e-07 |
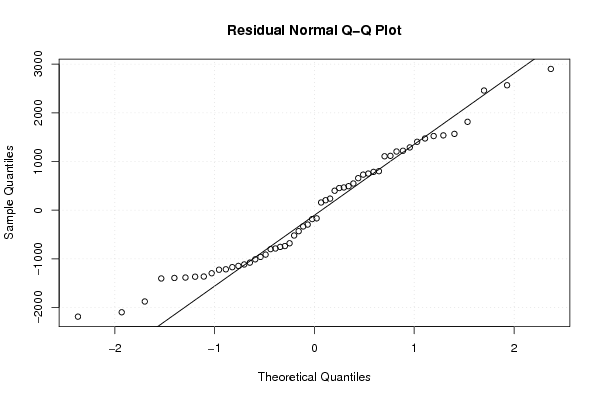
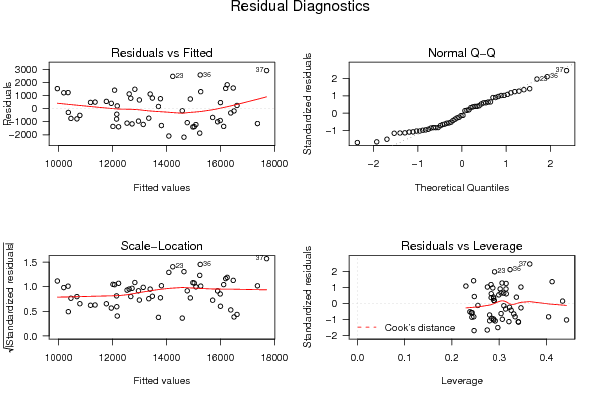
| Multiple Linear Regression - Residual Statistics | |
| Residual Standard Deviation | 1476.02799666902 |
| Sum Squared Residuals | 84967687.2310801 |
| Multiple Linear Regression - Actuals, Interpolation, and Residuals | |||
| Time or Index | Actuals | Interpolation Forecast | Residuals Prediction Error |
| 1 | 11993 | 14088.9051767802 | -2095.90517678015 |
| 2 | 14504 | 13397.0855339425 | 1106.91446605746 |
| 3 | 11727 | 12158.2567660383 | -431.256766038315 |
| 4 | 11477 | 9954.66346841773 | 1522.33653158227 |
| 5 | 13578 | 14980.2369039323 | -1402.23690393232 |
| 6 | 11555 | 12725.0237303954 | -1170.02373039539 |
| 7 | 11846 | 11353.2488177354 | 492.751182264642 |
| 8 | 11397 | 10192.2163137690 | 1204.78368623105 |
| 9 | 10066 | 10361.4186660657 | -295.418666065704 |
| 10 | 10269 | 10788.8256114314 | -519.825611431373 |
| 11 | 14279 | 13478.0948886526 | 800.905111347399 |
| 12 | 13870 | 15092.7734025048 | -1222.77340250477 |
| 13 | 13695 | 14771.7351906576 | -1076.73519065762 |
| 14 | 14420 | 14587.3241231274 | -167.324123127394 |
| 15 | 11424 | 12538.1494966009 | -1114.14949660089 |
| 16 | 9704 | 10457.7552245994 | -753.755224599414 |
| 17 | 12464 | 14650.0324593850 | -2186.03245938495 |
| 18 | 14301 | 12828.3257144238 | 1472.67428557617 |
| 19 | 13464 | 12677.2277384471 | 786.772261552878 |
| 20 | 9893 | 10679.4252421878 | -786.425242187821 |
| 21 | 11572 | 10352.1470988472 | 1219.85290115280 |
| 22 | 12380 | 12176.0178169367 | 203.982183063327 |
| 23 | 16692 | 14234.9895707404 | 2457.01042925956 |
| 24 | 16052 | 16385.7438423314 | -333.743842331428 |
| 25 | 16459 | 16004.0749626849 | 454.925037315129 |
| 26 | 14761 | 16123.4619892328 | -1362.46198923283 |
| 27 | 13654 | 12996.8237293856 | 657.176270614353 |
| 28 | 13480 | 12075.7684206777 | 1404.23157932227 |
| 29 | 18068 | 16253.4329230501 | 1814.56707694986 |
| 30 | 16560 | 15271.1603922916 | 1288.83960770835 |
| 31 | 14530 | 13778.6177403923 | 751.38225960767 |
| 32 | 10650 | 12015.6383974942 | -1365.63839749424 |
| 33 | 11651 | 11184.096796413 | 466.90320358699 |
| 34 | 13735 | 12619.0208151595 | 1115.97918484047 |
| 35 | 13360 | 15234.7866132297 | -1874.78661322972 |
| 36 | 17818 | 15252.7507449674 | 2565.24925503255 |
| 37 | 20613 | 17712.9530199428 | 2900.04698005716 |
| 38 | 16231 | 17375.206448554 | -1144.20644855400 |
| 39 | 13862 | 13703.8677427486 | 158.132257251397 |
| 40 | 12004 | 12963.2838912254 | -959.283891225394 |
| 41 | 17734 | 16197.8783615976 | 1536.12163840235 |
| 42 | 15034 | 15713.2565397439 | -679.256539743918 |
| 43 | 12609 | 13345.1393171655 | -736.139317165528 |
| 44 | 12320 | 11772.1958228285 | 547.804177171498 |
| 45 | 10833 | 12224.3374386741 | -1391.33743867408 |
| 46 | 11350 | 12150.1357564724 | -800.135756472419 |
| 47 | 13648 | 15031.1289273772 | -1383.12892737724 |
| 48 | 14890 | 15898.7320101964 | -1008.73201019635 |
| 49 | 16325 | 16507.3316499345 | -182.331649934516 |
| 50 | 18045 | 16477.9219051432 | 1567.07809485677 |
| 51 | 15616 | 14885.9022652265 | 730.097734773452 |
| 52 | 11926 | 13139.5289950797 | -1213.52899507973 |
| 53 | 16855 | 16617.4193520349 | 237.580647965059 |
| 54 | 15083 | 15995.2336231452 | -912.233623145216 |
| 55 | 12520 | 13814.7663862597 | -1294.76638625966 |
| 56 | 12355 | 11955.5242237205 | 399.475776279516 |
| Goldfeld-Quandt test for Heteroskedasticity | |||
| p-values | Alternative Hypothesis | ||
| breakpoint index | greater | 2-sided | less |
| 20 | 0.651508310938254 | 0.696983378123492 | 0.348491689061746 |
| 21 | 0.553967788805034 | 0.892064422389932 | 0.446032211194966 |
| 22 | 0.465164531508554 | 0.930329063017108 | 0.534835468491446 |
| 23 | 0.588533916085317 | 0.822932167829366 | 0.411466083914683 |
| 24 | 0.566128851913382 | 0.867742296173236 | 0.433871148086618 |
| 25 | 0.579566699461433 | 0.840866601077135 | 0.420433300538567 |
| 26 | 0.762274386392201 | 0.475451227215597 | 0.237725613607799 |
| 27 | 0.71846847840604 | 0.56306304318792 | 0.28153152159396 |
| 28 | 0.624712525608994 | 0.750574948782012 | 0.375287474391006 |
| 29 | 0.652741715392794 | 0.694516569214413 | 0.347258284607206 |
| 30 | 0.545590573727302 | 0.908818852545397 | 0.454409426272698 |
| 31 | 0.422688088787768 | 0.845376177575537 | 0.577311911212232 |
| 32 | 0.468527212917342 | 0.937054425834684 | 0.531472787082658 |
| 33 | 0.389153217457232 | 0.778306434914464 | 0.610846782542768 |
| 34 | 0.263088812066561 | 0.526177624133123 | 0.736911187933439 |
| 35 | 0.349634589125981 | 0.699269178251962 | 0.650365410874019 |
| 36 | 0.554516605554932 | 0.890966788890136 | 0.445483394445068 |
| Meta Analysis of Goldfeld-Quandt test for Heteroskedasticity | |||
| Description | # significant tests | % significant tests | OK/NOK |
| 1% type I error level | 0 | 0 | OK |
| 5% type I error level | 0 | 0 | OK |
| 10% type I error level | 0 | 0 | OK |