\begin{tabular}{lllllllll}
\hline
Summary of computational transaction \tabularnewline
Raw Input & view raw input (R code)  \tabularnewline
Raw Output & view raw output of R engine  \tabularnewline
Computing time & 5 seconds \tabularnewline
R Server & 'George Udny Yule' @ 72.249.76.132 \tabularnewline
\hline
\end{tabular}
%Source: https://freestatistics.org/blog/index.php?pk=108043&T=0
[TABLE]
[ROW][C]Summary of computational transaction[/C][/ROW]
[ROW][C]Raw Input[/C][C]view raw input (R code) [/C][/ROW]
[ROW][C]Raw Output[/C][C]view raw output of R engine [/C][/ROW]
[ROW][C]Computing time[/C][C]5 seconds[/C][/ROW]
[ROW][C]R Server[/C][C]'George Udny Yule' @ 72.249.76.132[/C][/ROW]
[/TABLE]
Source: https://freestatistics.org/blog/index.php?pk=108043&T=0
If you paste this QR Code into your document, anyone with a smartphone or tablet will be able to scan it and view this table in a browser.
If you paste this QR Code into your document, anyone with a smartphone or tablet will be able to scan it and view this table in a browser.
If you paste this QR Code into your document, anyone with a smartphone or tablet will be able to scan it and view this table in a browser.
If you paste this QR Code into your document, anyone with a smartphone or tablet will be able to scan it and view this table in a browser.
If you paste this QR Code into your document, anyone with a smartphone or tablet will be able to scan it and view this table in a browser.
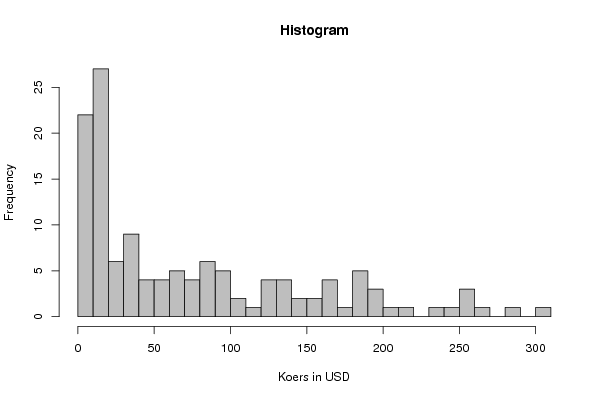
| Frequency Table (Histogram) | | Bins | Midpoint | Abs. Frequency | Rel. Frequency | Cumul. Rel. Freq. | Density | | [0,10[ | 5 | 22 | 0.169231 | 0.169231 | 0.016923 | | [10,20[ | 15 | 27 | 0.207692 | 0.376923 | 0.020769 | | [20,30[ | 25 | 6 | 0.046154 | 0.423077 | 0.004615 | | [30,40[ | 35 | 9 | 0.069231 | 0.492308 | 0.006923 | | [40,50[ | 45 | 4 | 0.030769 | 0.523077 | 0.003077 | | [50,60[ | 55 | 4 | 0.030769 | 0.553846 | 0.003077 | | [60,70[ | 65 | 5 | 0.038462 | 0.592308 | 0.003846 | | [70,80[ | 75 | 4 | 0.030769 | 0.623077 | 0.003077 | | [80,90[ | 85 | 6 | 0.046154 | 0.669231 | 0.004615 | | [90,100[ | 95 | 5 | 0.038462 | 0.707692 | 0.003846 | | [100,110[ | 105 | 2 | 0.015385 | 0.723077 | 0.001538 | | [110,120[ | 115 | 1 | 0.007692 | 0.730769 | 0.000769 | | [120,130[ | 125 | 4 | 0.030769 | 0.761538 | 0.003077 | | [130,140[ | 135 | 4 | 0.030769 | 0.792308 | 0.003077 | | [140,150[ | 145 | 2 | 0.015385 | 0.807692 | 0.001538 | | [150,160[ | 155 | 2 | 0.015385 | 0.823077 | 0.001538 | | [160,170[ | 165 | 4 | 0.030769 | 0.853846 | 0.003077 | | [170,180[ | 175 | 1 | 0.007692 | 0.861538 | 0.000769 | | [180,190[ | 185 | 5 | 0.038462 | 0.9 | 0.003846 | | [190,200[ | 195 | 3 | 0.023077 | 0.923077 | 0.002308 | | [200,210[ | 205 | 1 | 0.007692 | 0.930769 | 0.000769 | | [210,220[ | 215 | 1 | 0.007692 | 0.938462 | 0.000769 | | [220,230[ | 225 | 0 | 0 | 0.938462 | 0 | | [230,240[ | 235 | 1 | 0.007692 | 0.946154 | 0.000769 | | [240,250[ | 245 | 1 | 0.007692 | 0.953846 | 0.000769 | | [250,260[ | 255 | 3 | 0.023077 | 0.976923 | 0.002308 | | [260,270[ | 265 | 1 | 0.007692 | 0.984615 | 0.000769 | | [270,280[ | 275 | 0 | 0 | 0.984615 | 0 | | [280,290[ | 285 | 1 | 0.007692 | 0.992308 | 0.000769 | | [290,300[ | 295 | 0 | 0 | 0.992308 | 0 | | [300,310] | 305 | 1 | 0.007692 | 1 | 0.000769 |
\begin{tabular}{lllllllll}
\hline
Frequency Table (Histogram) \tabularnewline
Bins & Midpoint & Abs. Frequency & Rel. Frequency & Cumul. Rel. Freq. & Density \tabularnewline
[0,10[ & 5 & 22 & 0.169231 & 0.169231 & 0.016923 \tabularnewline
[10,20[ & 15 & 27 & 0.207692 & 0.376923 & 0.020769 \tabularnewline
[20,30[ & 25 & 6 & 0.046154 & 0.423077 & 0.004615 \tabularnewline
[30,40[ & 35 & 9 & 0.069231 & 0.492308 & 0.006923 \tabularnewline
[40,50[ & 45 & 4 & 0.030769 & 0.523077 & 0.003077 \tabularnewline
[50,60[ & 55 & 4 & 0.030769 & 0.553846 & 0.003077 \tabularnewline
[60,70[ & 65 & 5 & 0.038462 & 0.592308 & 0.003846 \tabularnewline
[70,80[ & 75 & 4 & 0.030769 & 0.623077 & 0.003077 \tabularnewline
[80,90[ & 85 & 6 & 0.046154 & 0.669231 & 0.004615 \tabularnewline
[90,100[ & 95 & 5 & 0.038462 & 0.707692 & 0.003846 \tabularnewline
[100,110[ & 105 & 2 & 0.015385 & 0.723077 & 0.001538 \tabularnewline
[110,120[ & 115 & 1 & 0.007692 & 0.730769 & 0.000769 \tabularnewline
[120,130[ & 125 & 4 & 0.030769 & 0.761538 & 0.003077 \tabularnewline
[130,140[ & 135 & 4 & 0.030769 & 0.792308 & 0.003077 \tabularnewline
[140,150[ & 145 & 2 & 0.015385 & 0.807692 & 0.001538 \tabularnewline
[150,160[ & 155 & 2 & 0.015385 & 0.823077 & 0.001538 \tabularnewline
[160,170[ & 165 & 4 & 0.030769 & 0.853846 & 0.003077 \tabularnewline
[170,180[ & 175 & 1 & 0.007692 & 0.861538 & 0.000769 \tabularnewline
[180,190[ & 185 & 5 & 0.038462 & 0.9 & 0.003846 \tabularnewline
[190,200[ & 195 & 3 & 0.023077 & 0.923077 & 0.002308 \tabularnewline
[200,210[ & 205 & 1 & 0.007692 & 0.930769 & 0.000769 \tabularnewline
[210,220[ & 215 & 1 & 0.007692 & 0.938462 & 0.000769 \tabularnewline
[220,230[ & 225 & 0 & 0 & 0.938462 & 0 \tabularnewline
[230,240[ & 235 & 1 & 0.007692 & 0.946154 & 0.000769 \tabularnewline
[240,250[ & 245 & 1 & 0.007692 & 0.953846 & 0.000769 \tabularnewline
[250,260[ & 255 & 3 & 0.023077 & 0.976923 & 0.002308 \tabularnewline
[260,270[ & 265 & 1 & 0.007692 & 0.984615 & 0.000769 \tabularnewline
[270,280[ & 275 & 0 & 0 & 0.984615 & 0 \tabularnewline
[280,290[ & 285 & 1 & 0.007692 & 0.992308 & 0.000769 \tabularnewline
[290,300[ & 295 & 0 & 0 & 0.992308 & 0 \tabularnewline
[300,310] & 305 & 1 & 0.007692 & 1 & 0.000769 \tabularnewline
\hline
\end{tabular}
%Source: https://freestatistics.org/blog/index.php?pk=108043&T=1
[TABLE]
[ROW][C]Frequency Table (Histogram)[/C][/ROW]
[ROW][C]Bins[/C][C]Midpoint[/C][C]Abs. Frequency[/C][C]Rel. Frequency[/C][C]Cumul. Rel. Freq.[/C][C]Density[/C][/ROW]
[ROW][C][0,10[[/C][C]5[/C][C]22[/C][C]0.169231[/C][C]0.169231[/C][C]0.016923[/C][/ROW]
[ROW][C][10,20[[/C][C]15[/C][C]27[/C][C]0.207692[/C][C]0.376923[/C][C]0.020769[/C][/ROW]
[ROW][C][20,30[[/C][C]25[/C][C]6[/C][C]0.046154[/C][C]0.423077[/C][C]0.004615[/C][/ROW]
[ROW][C][30,40[[/C][C]35[/C][C]9[/C][C]0.069231[/C][C]0.492308[/C][C]0.006923[/C][/ROW]
[ROW][C][40,50[[/C][C]45[/C][C]4[/C][C]0.030769[/C][C]0.523077[/C][C]0.003077[/C][/ROW]
[ROW][C][50,60[[/C][C]55[/C][C]4[/C][C]0.030769[/C][C]0.553846[/C][C]0.003077[/C][/ROW]
[ROW][C][60,70[[/C][C]65[/C][C]5[/C][C]0.038462[/C][C]0.592308[/C][C]0.003846[/C][/ROW]
[ROW][C][70,80[[/C][C]75[/C][C]4[/C][C]0.030769[/C][C]0.623077[/C][C]0.003077[/C][/ROW]
[ROW][C][80,90[[/C][C]85[/C][C]6[/C][C]0.046154[/C][C]0.669231[/C][C]0.004615[/C][/ROW]
[ROW][C][90,100[[/C][C]95[/C][C]5[/C][C]0.038462[/C][C]0.707692[/C][C]0.003846[/C][/ROW]
[ROW][C][100,110[[/C][C]105[/C][C]2[/C][C]0.015385[/C][C]0.723077[/C][C]0.001538[/C][/ROW]
[ROW][C][110,120[[/C][C]115[/C][C]1[/C][C]0.007692[/C][C]0.730769[/C][C]0.000769[/C][/ROW]
[ROW][C][120,130[[/C][C]125[/C][C]4[/C][C]0.030769[/C][C]0.761538[/C][C]0.003077[/C][/ROW]
[ROW][C][130,140[[/C][C]135[/C][C]4[/C][C]0.030769[/C][C]0.792308[/C][C]0.003077[/C][/ROW]
[ROW][C][140,150[[/C][C]145[/C][C]2[/C][C]0.015385[/C][C]0.807692[/C][C]0.001538[/C][/ROW]
[ROW][C][150,160[[/C][C]155[/C][C]2[/C][C]0.015385[/C][C]0.823077[/C][C]0.001538[/C][/ROW]
[ROW][C][160,170[[/C][C]165[/C][C]4[/C][C]0.030769[/C][C]0.853846[/C][C]0.003077[/C][/ROW]
[ROW][C][170,180[[/C][C]175[/C][C]1[/C][C]0.007692[/C][C]0.861538[/C][C]0.000769[/C][/ROW]
[ROW][C][180,190[[/C][C]185[/C][C]5[/C][C]0.038462[/C][C]0.9[/C][C]0.003846[/C][/ROW]
[ROW][C][190,200[[/C][C]195[/C][C]3[/C][C]0.023077[/C][C]0.923077[/C][C]0.002308[/C][/ROW]
[ROW][C][200,210[[/C][C]205[/C][C]1[/C][C]0.007692[/C][C]0.930769[/C][C]0.000769[/C][/ROW]
[ROW][C][210,220[[/C][C]215[/C][C]1[/C][C]0.007692[/C][C]0.938462[/C][C]0.000769[/C][/ROW]
[ROW][C][220,230[[/C][C]225[/C][C]0[/C][C]0[/C][C]0.938462[/C][C]0[/C][/ROW]
[ROW][C][230,240[[/C][C]235[/C][C]1[/C][C]0.007692[/C][C]0.946154[/C][C]0.000769[/C][/ROW]
[ROW][C][240,250[[/C][C]245[/C][C]1[/C][C]0.007692[/C][C]0.953846[/C][C]0.000769[/C][/ROW]
[ROW][C][250,260[[/C][C]255[/C][C]3[/C][C]0.023077[/C][C]0.976923[/C][C]0.002308[/C][/ROW]
[ROW][C][260,270[[/C][C]265[/C][C]1[/C][C]0.007692[/C][C]0.984615[/C][C]0.000769[/C][/ROW]
[ROW][C][270,280[[/C][C]275[/C][C]0[/C][C]0[/C][C]0.984615[/C][C]0[/C][/ROW]
[ROW][C][280,290[[/C][C]285[/C][C]1[/C][C]0.007692[/C][C]0.992308[/C][C]0.000769[/C][/ROW]
[ROW][C][290,300[[/C][C]295[/C][C]0[/C][C]0[/C][C]0.992308[/C][C]0[/C][/ROW]
[ROW][C][300,310][/C][C]305[/C][C]1[/C][C]0.007692[/C][C]1[/C][C]0.000769[/C][/ROW]
[/TABLE]
Source: https://freestatistics.org/blog/index.php?pk=108043&T=1
Globally Unique Identifier (entire table): ba.freestatistics.org/blog/index.php?pk=108043&T=1
As an alternative you can also use a QR Code:
The GUIDs for individual cells are displayed in the table below:
| Frequency Table (Histogram) | | Bins | Midpoint | Abs. Frequency | Rel. Frequency | Cumul. Rel. Freq. | Density | | [0,10[ | 5 | 22 | 0.169231 | 0.169231 | 0.016923 | | [10,20[ | 15 | 27 | 0.207692 | 0.376923 | 0.020769 | | [20,30[ | 25 | 6 | 0.046154 | 0.423077 | 0.004615 | | [30,40[ | 35 | 9 | 0.069231 | 0.492308 | 0.006923 | | [40,50[ | 45 | 4 | 0.030769 | 0.523077 | 0.003077 | | [50,60[ | 55 | 4 | 0.030769 | 0.553846 | 0.003077 | | [60,70[ | 65 | 5 | 0.038462 | 0.592308 | 0.003846 | | [70,80[ | 75 | 4 | 0.030769 | 0.623077 | 0.003077 | | [80,90[ | 85 | 6 | 0.046154 | 0.669231 | 0.004615 | | [90,100[ | 95 | 5 | 0.038462 | 0.707692 | 0.003846 | | [100,110[ | 105 | 2 | 0.015385 | 0.723077 | 0.001538 | | [110,120[ | 115 | 1 | 0.007692 | 0.730769 | 0.000769 | | [120,130[ | 125 | 4 | 0.030769 | 0.761538 | 0.003077 | | [130,140[ | 135 | 4 | 0.030769 | 0.792308 | 0.003077 | | [140,150[ | 145 | 2 | 0.015385 | 0.807692 | 0.001538 | | [150,160[ | 155 | 2 | 0.015385 | 0.823077 | 0.001538 | | [160,170[ | 165 | 4 | 0.030769 | 0.853846 | 0.003077 | | [170,180[ | 175 | 1 | 0.007692 | 0.861538 | 0.000769 | | [180,190[ | 185 | 5 | 0.038462 | 0.9 | 0.003846 | | [190,200[ | 195 | 3 | 0.023077 | 0.923077 | 0.002308 | | [200,210[ | 205 | 1 | 0.007692 | 0.930769 | 0.000769 | | [210,220[ | 215 | 1 | 0.007692 | 0.938462 | 0.000769 | | [220,230[ | 225 | 0 | 0 | 0.938462 | 0 | | [230,240[ | 235 | 1 | 0.007692 | 0.946154 | 0.000769 | | [240,250[ | 245 | 1 | 0.007692 | 0.953846 | 0.000769 | | [250,260[ | 255 | 3 | 0.023077 | 0.976923 | 0.002308 | | [260,270[ | 265 | 1 | 0.007692 | 0.984615 | 0.000769 | | [270,280[ | 275 | 0 | 0 | 0.984615 | 0 | | [280,290[ | 285 | 1 | 0.007692 | 0.992308 | 0.000769 | | [290,300[ | 295 | 0 | 0 | 0.992308 | 0 | | [300,310] | 305 | 1 | 0.007692 | 1 | 0.000769 |
If you paste this QR Code into your document, anyone with a smartphone or tablet will be able to scan it and view this table in a browser.
If you paste this QR Code into your document, anyone with a smartphone or tablet will be able to scan it and view this table in a browser.
If you paste this QR Code into your document, anyone with a smartphone or tablet will be able to scan it and view this table in a browser.
If you paste this QR Code into your document, anyone with a smartphone or tablet will be able to scan it and view this table in a browser.
If you paste this QR Code into your document, anyone with a smartphone or tablet will be able to scan it and view this table in a browser.
|