| Multiple Linear Regression - Estimated Regression Equation |
| logps[t] = + 1.07450734042497 -0.303538868483014logtg[t] -0.110510499814239D[t] + e[t] |
| Multiple Linear Regression - Ordinary Least Squares | |||||
| Variable | Parameter | S.D. | T-STAT H0: parameter = 0 | 2-tail p-value | 1-tail p-value |
| (Intercept) | 1.07450734042497 | 0.128751 | 8.3456 | 0 | 0 |
| logtg | -0.303538868483014 | 0.068904 | -4.4053 | 9.1e-05 | 4.5e-05 |
| D | -0.110510499814239 | 0.022191 | -4.98 | 1.6e-05 | 8e-06 |
| Multiple Linear Regression - Regression Statistics | |
| Multiple R | 0.809091683132234 |
| R-squared | 0.654629351713751 |
| Adjusted R-squared | 0.635442093475626 |
| F-TEST (value) | 34.1179205277494 |
| F-TEST (DF numerator) | 2 |
| F-TEST (DF denominator) | 36 |
| p-value | 4.88807283538506e-09 |
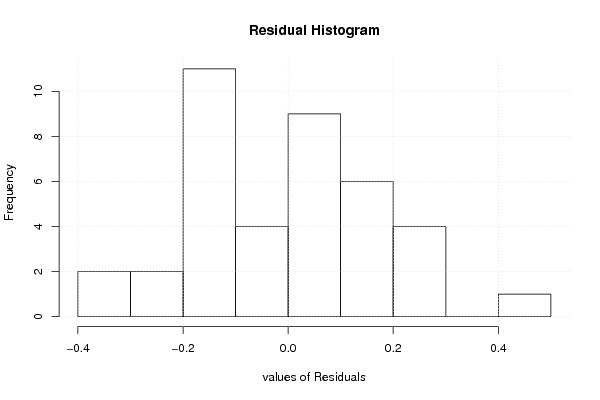
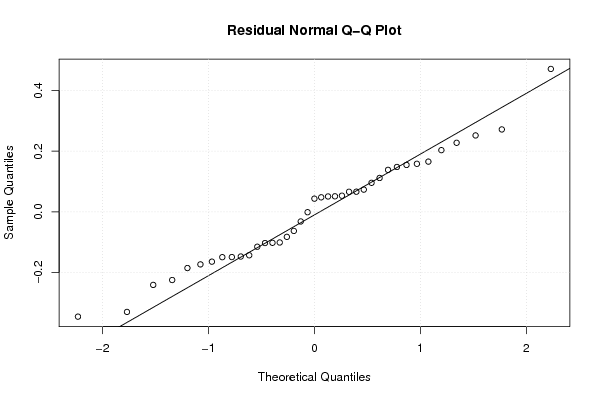
| Multiple Linear Regression - Residual Statistics | |
| Residual Standard Deviation | 0.181764010644755 |
| Sum Squared Residuals | 1.189373600364 |
| Multiple Linear Regression - Actuals, Interpolation, and Residuals | |||
| Time or Index | Actuals | Interpolation Forecast | Residuals Prediction Error |
| 1 | 0.301029995664 | 0.250256588109019 | 0.0507734075549815 |
| 2 | 0.2552725051033 | -0.215981826385341 | 0.471254331488641 |
| 3 | -0.1549019599857 | -0.052097523151895 | -0.102804436833805 |
| 4 | 0.5910646070265 | 0.495312173567859 | 0.095752433458641 |
| 5 | 0 | -0.154697777268155 | 0.154697777268155 |
| 6 | 0.5563025007673 | 0.417827046213979 | 0.138475454553321 |
| 7 | 0.1461280356782 | 0.247120645601109 | -0.100992609922909 |
| 8 | 0.1760912590557 | 0.0104480212917013 | 0.165643237763999 |
| 9 | -0.1549019599857 | -0.221322704237425 | 0.066420744251725 |
| 10 | 0.3222192947339 | 0.471277587737495 | -0.149058293003595 |
| 11 | 0.6127838567197 | 0.360767087923257 | 0.252016768796443 |
| 12 | 0.0791812460476 | 0.222374018000099 | -0.143192771952499 |
| 13 | -0.301029995664 | -0.136803944049229 | -0.164226051614771 |
| 14 | 0.5314789170423 | 0.487989123743332 | 0.0434897932989676 |
| 15 | 0.1760912590557 | 0.20777173108234 | -0.0316804720266405 |
| 16 | 0.5314789170423 | 0.303707129632534 | 0.227771787409766 |
| 17 | -0.0969100130081 | 0.076227659320135 | -0.173137672328235 |
| 18 | -0.0969100130081 | -0.244887324309321 | 0.147977311301221 |
| 19 | 0.301029995664 | 0.448293407907998 | -0.147263412243998 |
| 20 | 0.2787536009528 | 0.227456357974827 | 0.0512972429779726 |
| 21 | 0.1139433523068 | 0.35482441988046 | -0.24088106757366 |
| 22 | 0.7481880270062 | 0.636423386297352 | 0.111764640708848 |
| 23 | 0.4913616938343 | 0.332884517814338 | 0.158477176019962 |
| 24 | 0.2552725051033 | 0.202053065227056 | 0.0532194398762439 |
| 25 | -0.0457574905607 | -0.0445626006363152 | -0.00119488992438484 |
| 26 | 0.2552725051033 | 0.479997267475176 | -0.224724762371876 |
| 27 | 0.2787536009528 | 0.00696345042169078 | 0.271790150531109 |
| 28 | -0.0457574905607 | 0.0692686003084 | -0.1150260908691 |
| 29 | 0.4149733479708 | 0.341630892372315 | 0.0733424555984847 |
| 30 | 0.3802112417116 | 0.443123127370753 | -0.0629118856591535 |
| 31 | 0.0791812460476 | 0.181195145293527 | -0.102013899245927 |
| 32 | -0.0457574905607 | 0.139507520783429 | -0.185265011344129 |
| 33 | -0.301029995664 | 0.0289970209691908 | -0.330027016633191 |
| 34 | -0.2218487496164 | -0.139449355678176 | -0.0823993939382244 |
| 35 | 0.3617278360176 | 0.313748322263396 | 0.0479795137542038 |
| 36 | -0.301029995664 | 0.0445237997529265 | -0.345553795416927 |
| 37 | 0.4149733479708 | 0.348774710006588 | 0.0661986379642121 |
| 38 | -0.2218487496164 | -0.0724184759249378 | -0.149430273691462 |
| 39 | 0.8195439355419 | 0.616102433524309 | 0.203441502017591 |
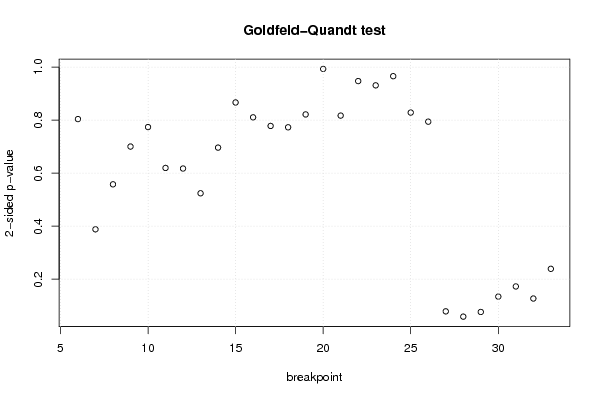
| Goldfeld-Quandt test for Heteroskedasticity | |||
| p-values | Alternative Hypothesis | ||
| breakpoint index | greater | 2-sided | less |
| 6 | 0.59792896957371 | 0.80414206085258 | 0.40207103042629 |
| 7 | 0.805814977507871 | 0.388370044984258 | 0.194185022492129 |
| 8 | 0.720981818694345 | 0.55803636261131 | 0.279018181305655 |
| 9 | 0.649764792858917 | 0.700470414282166 | 0.350235207141083 |
| 10 | 0.613004805277004 | 0.773990389445993 | 0.386995194722996 |
| 11 | 0.690107188097475 | 0.61978562380505 | 0.309892811902525 |
| 12 | 0.691199655958168 | 0.617600688083664 | 0.308800344041832 |
| 13 | 0.737898423674923 | 0.524203152650155 | 0.262101576325077 |
| 14 | 0.651773096047814 | 0.696453807904372 | 0.348226903952186 |
| 15 | 0.566642974519477 | 0.866714050961045 | 0.433357025480523 |
| 16 | 0.594689072319514 | 0.810621855360971 | 0.405310927680486 |
| 17 | 0.610880146167799 | 0.778239707664403 | 0.389119853832201 |
| 18 | 0.613441083996094 | 0.773117832007812 | 0.386558916003906 |
| 19 | 0.589205364713064 | 0.821589270573872 | 0.410794635286936 |
| 20 | 0.503427823550494 | 0.993144352899011 | 0.496572176449506 |
| 21 | 0.59140003064361 | 0.81719993871278 | 0.40859996935639 |
| 22 | 0.526280887806607 | 0.947438224386787 | 0.473719112193393 |
| 23 | 0.534351614657396 | 0.931296770685208 | 0.465648385342604 |
| 24 | 0.482913739935743 | 0.965827479871486 | 0.517086260064257 |
| 25 | 0.414301128450514 | 0.828602256901027 | 0.585698871549486 |
| 26 | 0.602854839068652 | 0.794290321862696 | 0.397145160931348 |
| 27 | 0.96055824418003 | 0.07888351163994 | 0.03944175581997 |
| 28 | 0.970552683437988 | 0.0588946331240236 | 0.0294473165620118 |
| 29 | 0.961721815063157 | 0.0765563698736861 | 0.038278184936843 |
| 30 | 0.932745485002658 | 0.134509029994683 | 0.0672545149973416 |
| 31 | 0.913605273138516 | 0.172789453722968 | 0.086394726861484 |
| 32 | 0.936353640760105 | 0.127292718479789 | 0.0636463592398946 |
| 33 | 0.880356992568872 | 0.239286014862255 | 0.119643007431128 |
| Meta Analysis of Goldfeld-Quandt test for Heteroskedasticity | |||
| Description | # significant tests | % significant tests | OK/NOK |
| 1% type I error level | 0 | 0 | OK |
| 5% type I error level | 0 | 0 | OK |
| 10% type I error level | 3 | 0.107142857142857 | NOK |