Free Statistics

of Irreproducible Research!

Author's title

Author*The author of this computation has been verified*
R Software Modulerwasp_arimabackwardselection.wasp
Title produced by softwareARIMA Backward Selection
Date of computationFri, 10 Dec 2010 21:13:51 +0000
Cite this page as followsStatistical Computations at FreeStatistics.org, Office for Research Development and Education, URL https://freestatistics.org/blog/index.php?v=date/2010/Dec/10/t1292015622x1b356dylfuhqgm.htm/, Retrieved Mon, 29 Apr 2024 12:38:56 +0000
Statistical Computations at FreeStatistics.org, Office for Research Development and Education, URL https://freestatistics.org/blog/index.php?pk=107955, Retrieved Mon, 29 Apr 2024 12:38:56 +0000
QR Codes:

Original text written by user:
IsPrivate?No (this computation is public)
User-defined keywords
Estimated Impact132
Family? (F = Feedback message, R = changed R code, M = changed R Module, P = changed Parameters, D = changed Data)
-       [ARIMA Backward Selection] [ARIMA Backward Se...] [2010-12-10 21:13:51] [60147a93d53c93401a082f47876e6cb5] [Current]
Feedback Forum

Post a new message
Dataseries X:
4143
4429
5219
4929
5761
5592
4163
4962
5208
4755
4491
5732
5731
5040
6102
4904
5369
5578
4619
4731
5011
5299
4146
4625
4736
4219
5116
4205
4121
5103
4300
4578
3809
5657
4248
3830
4736
4839
4411
4570
4104
4801
3953
3828
4440
4026
4109
4785
3224
3552
3940
3913
3681
4309
3830
4143
4087
3818
3380
3430
3458
3970
5260
5024
5634
6549
4676


Summary of computational transaction
Raw Inputview raw input (R code)
Raw Outputview raw output of R engine
Computing time4 seconds
R Server'Sir Ronald Aylmer Fisher' @ 193.190.124.24

\begin{tabular}{lllllllll}
\hline
Summary of computational transaction \tabularnewline
Raw Input & view raw input (R code)  \tabularnewline
Raw Output & view raw output of R engine  \tabularnewline
Computing time & 4 seconds \tabularnewline
R Server & 'Sir Ronald Aylmer Fisher' @ 193.190.124.24 \tabularnewline
\hline
\end{tabular}
%Source: https://freestatistics.org/blog/index.php?pk=107955&T=0

[TABLE]
[ROW][C]Summary of computational transaction[/C][/ROW]
[ROW][C]Raw Input[/C][C]view raw input (R code) [/C][/ROW]
[ROW][C]Raw Output[/C][C]view raw output of R engine [/C][/ROW]
[ROW][C]Computing time[/C][C]4 seconds[/C][/ROW]
[ROW][C]R Server[/C][C]'Sir Ronald Aylmer Fisher' @ 193.190.124.24[/C][/ROW]
[/TABLE]
Source: https://freestatistics.org/blog/index.php?pk=107955&T=0

Globally Unique Identifier (entire table): ba.freestatistics.org/blog/index.php?pk=107955&T=0

As an alternative you can also use a QR Code:  

The GUIDs for individual cells are displayed in the table below:

Summary of computational transaction
Raw Inputview raw input (R code)
Raw Outputview raw output of R engine
Computing time4 seconds
R Server'Sir Ronald Aylmer Fisher' @ 193.190.124.24


ARIMA Parameter Estimation and Backward Selection
Iterationar1ar2ar3ma1sar1sar2sma1
Estimates ( 1 )-0.6548-0.43630.04670.0608-0.10360.03830.0608
(p-val)(0.7002 )(0.7181 )(0.9544 )(0.9776 )(0.9579 )(0.9026 )(0.9776 )
Estimates ( 2 )-0.6196-0.40540.06380-0.02590.03080.0094
(p-val)(0.6477 )(0.6712 )(0.9204 )(NA )(0.9902 )(0.92 )(0.9967 )
Estimates ( 3 )-0.5964-0.39060.07430-0.03990.03010
(p-val)(0.5844 )(0.5835 )(0.883 )(NA )(0.9708 )(0.9115 )(NA )
Estimates ( 4 )-0.6358-0.41470.0566000.02960
(p-val)(0 )(0.0925 )(0.7088 )(NA )(NA )(0.9087 )(NA )
Estimates ( 5 )-0.6358-0.39160.0660000
(p-val)(0 )(0.0082 )(0.611 )(NA )(NA )(NA )(NA )
Estimates ( 6 )-0.6617-0.434100000
(p-val)(0 )(4e-04 )(NA )(NA )(NA )(NA )(NA )
Estimates ( 7 )NANANANANANANA
(p-val)(NA )(NA )(NA )(NA )(NA )(NA )(NA )
Estimates ( 8 )NANANANANANANA
(p-val)(NA )(NA )(NA )(NA )(NA )(NA )(NA )
Estimates ( 9 )NANANANANANANA
(p-val)(NA )(NA )(NA )(NA )(NA )(NA )(NA )
Estimates ( 10 )NANANANANANANA
(p-val)(NA )(NA )(NA )(NA )(NA )(NA )(NA )
Estimates ( 11 )NANANANANANANA
(p-val)(NA )(NA )(NA )(NA )(NA )(NA )(NA )
Estimates ( 12 )NANANANANANANA
(p-val)(NA )(NA )(NA )(NA )(NA )(NA )(NA )
Estimates ( 13 )NANANANANANANA
(p-val)(NA )(NA )(NA )(NA )(NA )(NA )(NA )

\begin{tabular}{lllllllll}
\hline
ARIMA Parameter Estimation and Backward Selection \tabularnewline
Iteration & ar1 & ar2 & ar3 & ma1 & sar1 & sar2 & sma1 \tabularnewline
Estimates ( 1 ) & -0.6548 & -0.4363 & 0.0467 & 0.0608 & -0.1036 & 0.0383 & 0.0608 \tabularnewline
(p-val) & (0.7002 ) & (0.7181 ) & (0.9544 ) & (0.9776 ) & (0.9579 ) & (0.9026 ) & (0.9776 ) \tabularnewline
Estimates ( 2 ) & -0.6196 & -0.4054 & 0.0638 & 0 & -0.0259 & 0.0308 & 0.0094 \tabularnewline
(p-val) & (0.6477 ) & (0.6712 ) & (0.9204 ) & (NA ) & (0.9902 ) & (0.92 ) & (0.9967 ) \tabularnewline
Estimates ( 3 ) & -0.5964 & -0.3906 & 0.0743 & 0 & -0.0399 & 0.0301 & 0 \tabularnewline
(p-val) & (0.5844 ) & (0.5835 ) & (0.883 ) & (NA ) & (0.9708 ) & (0.9115 ) & (NA ) \tabularnewline
Estimates ( 4 ) & -0.6358 & -0.4147 & 0.0566 & 0 & 0 & 0.0296 & 0 \tabularnewline
(p-val) & (0 ) & (0.0925 ) & (0.7088 ) & (NA ) & (NA ) & (0.9087 ) & (NA ) \tabularnewline
Estimates ( 5 ) & -0.6358 & -0.3916 & 0.066 & 0 & 0 & 0 & 0 \tabularnewline
(p-val) & (0 ) & (0.0082 ) & (0.611 ) & (NA ) & (NA ) & (NA ) & (NA ) \tabularnewline
Estimates ( 6 ) & -0.6617 & -0.4341 & 0 & 0 & 0 & 0 & 0 \tabularnewline
(p-val) & (0 ) & (4e-04 ) & (NA ) & (NA ) & (NA ) & (NA ) & (NA ) \tabularnewline
Estimates ( 7 ) & NA & NA & NA & NA & NA & NA & NA \tabularnewline
(p-val) & (NA ) & (NA ) & (NA ) & (NA ) & (NA ) & (NA ) & (NA ) \tabularnewline
Estimates ( 8 ) & NA & NA & NA & NA & NA & NA & NA \tabularnewline
(p-val) & (NA ) & (NA ) & (NA ) & (NA ) & (NA ) & (NA ) & (NA ) \tabularnewline
Estimates ( 9 ) & NA & NA & NA & NA & NA & NA & NA \tabularnewline
(p-val) & (NA ) & (NA ) & (NA ) & (NA ) & (NA ) & (NA ) & (NA ) \tabularnewline
Estimates ( 10 ) & NA & NA & NA & NA & NA & NA & NA \tabularnewline
(p-val) & (NA ) & (NA ) & (NA ) & (NA ) & (NA ) & (NA ) & (NA ) \tabularnewline
Estimates ( 11 ) & NA & NA & NA & NA & NA & NA & NA \tabularnewline
(p-val) & (NA ) & (NA ) & (NA ) & (NA ) & (NA ) & (NA ) & (NA ) \tabularnewline
Estimates ( 12 ) & NA & NA & NA & NA & NA & NA & NA \tabularnewline
(p-val) & (NA ) & (NA ) & (NA ) & (NA ) & (NA ) & (NA ) & (NA ) \tabularnewline
Estimates ( 13 ) & NA & NA & NA & NA & NA & NA & NA \tabularnewline
(p-val) & (NA ) & (NA ) & (NA ) & (NA ) & (NA ) & (NA ) & (NA ) \tabularnewline
\hline
\end{tabular}
%Source: https://freestatistics.org/blog/index.php?pk=107955&T=1

[TABLE]
[ROW][C]ARIMA Parameter Estimation and Backward Selection[/C][/ROW]
[ROW][C]Iteration[/C][C]ar1[/C][C]ar2[/C][C]ar3[/C][C]ma1[/C][C]sar1[/C][C]sar2[/C][C]sma1[/C][/ROW]
[ROW][C]Estimates ( 1 )[/C][C]-0.6548[/C][C]-0.4363[/C][C]0.0467[/C][C]0.0608[/C][C]-0.1036[/C][C]0.0383[/C][C]0.0608[/C][/ROW]
[ROW][C](p-val)[/C][C](0.7002 )[/C][C](0.7181 )[/C][C](0.9544 )[/C][C](0.9776 )[/C][C](0.9579 )[/C][C](0.9026 )[/C][C](0.9776 )[/C][/ROW]
[ROW][C]Estimates ( 2 )[/C][C]-0.6196[/C][C]-0.4054[/C][C]0.0638[/C][C]0[/C][C]-0.0259[/C][C]0.0308[/C][C]0.0094[/C][/ROW]
[ROW][C](p-val)[/C][C](0.6477 )[/C][C](0.6712 )[/C][C](0.9204 )[/C][C](NA )[/C][C](0.9902 )[/C][C](0.92 )[/C][C](0.9967 )[/C][/ROW]
[ROW][C]Estimates ( 3 )[/C][C]-0.5964[/C][C]-0.3906[/C][C]0.0743[/C][C]0[/C][C]-0.0399[/C][C]0.0301[/C][C]0[/C][/ROW]
[ROW][C](p-val)[/C][C](0.5844 )[/C][C](0.5835 )[/C][C](0.883 )[/C][C](NA )[/C][C](0.9708 )[/C][C](0.9115 )[/C][C](NA )[/C][/ROW]
[ROW][C]Estimates ( 4 )[/C][C]-0.6358[/C][C]-0.4147[/C][C]0.0566[/C][C]0[/C][C]0[/C][C]0.0296[/C][C]0[/C][/ROW]
[ROW][C](p-val)[/C][C](0 )[/C][C](0.0925 )[/C][C](0.7088 )[/C][C](NA )[/C][C](NA )[/C][C](0.9087 )[/C][C](NA )[/C][/ROW]
[ROW][C]Estimates ( 5 )[/C][C]-0.6358[/C][C]-0.3916[/C][C]0.066[/C][C]0[/C][C]0[/C][C]0[/C][C]0[/C][/ROW]
[ROW][C](p-val)[/C][C](0 )[/C][C](0.0082 )[/C][C](0.611 )[/C][C](NA )[/C][C](NA )[/C][C](NA )[/C][C](NA )[/C][/ROW]
[ROW][C]Estimates ( 6 )[/C][C]-0.6617[/C][C]-0.4341[/C][C]0[/C][C]0[/C][C]0[/C][C]0[/C][C]0[/C][/ROW]
[ROW][C](p-val)[/C][C](0 )[/C][C](4e-04 )[/C][C](NA )[/C][C](NA )[/C][C](NA )[/C][C](NA )[/C][C](NA )[/C][/ROW]
[ROW][C]Estimates ( 7 )[/C][C]NA[/C][C]NA[/C][C]NA[/C][C]NA[/C][C]NA[/C][C]NA[/C][C]NA[/C][/ROW]
[ROW][C](p-val)[/C][C](NA )[/C][C](NA )[/C][C](NA )[/C][C](NA )[/C][C](NA )[/C][C](NA )[/C][C](NA )[/C][/ROW]
[ROW][C]Estimates ( 8 )[/C][C]NA[/C][C]NA[/C][C]NA[/C][C]NA[/C][C]NA[/C][C]NA[/C][C]NA[/C][/ROW]
[ROW][C](p-val)[/C][C](NA )[/C][C](NA )[/C][C](NA )[/C][C](NA )[/C][C](NA )[/C][C](NA )[/C][C](NA )[/C][/ROW]
[ROW][C]Estimates ( 9 )[/C][C]NA[/C][C]NA[/C][C]NA[/C][C]NA[/C][C]NA[/C][C]NA[/C][C]NA[/C][/ROW]
[ROW][C](p-val)[/C][C](NA )[/C][C](NA )[/C][C](NA )[/C][C](NA )[/C][C](NA )[/C][C](NA )[/C][C](NA )[/C][/ROW]
[ROW][C]Estimates ( 10 )[/C][C]NA[/C][C]NA[/C][C]NA[/C][C]NA[/C][C]NA[/C][C]NA[/C][C]NA[/C][/ROW]
[ROW][C](p-val)[/C][C](NA )[/C][C](NA )[/C][C](NA )[/C][C](NA )[/C][C](NA )[/C][C](NA )[/C][C](NA )[/C][/ROW]
[ROW][C]Estimates ( 11 )[/C][C]NA[/C][C]NA[/C][C]NA[/C][C]NA[/C][C]NA[/C][C]NA[/C][C]NA[/C][/ROW]
[ROW][C](p-val)[/C][C](NA )[/C][C](NA )[/C][C](NA )[/C][C](NA )[/C][C](NA )[/C][C](NA )[/C][C](NA )[/C][/ROW]
[ROW][C]Estimates ( 12 )[/C][C]NA[/C][C]NA[/C][C]NA[/C][C]NA[/C][C]NA[/C][C]NA[/C][C]NA[/C][/ROW]
[ROW][C](p-val)[/C][C](NA )[/C][C](NA )[/C][C](NA )[/C][C](NA )[/C][C](NA )[/C][C](NA )[/C][C](NA )[/C][/ROW]
[ROW][C]Estimates ( 13 )[/C][C]NA[/C][C]NA[/C][C]NA[/C][C]NA[/C][C]NA[/C][C]NA[/C][C]NA[/C][/ROW]
[ROW][C](p-val)[/C][C](NA )[/C][C](NA )[/C][C](NA )[/C][C](NA )[/C][C](NA )[/C][C](NA )[/C][C](NA )[/C][/ROW]
[/TABLE]
Source: https://freestatistics.org/blog/index.php?pk=107955&T=1

Globally Unique Identifier (entire table): ba.freestatistics.org/blog/index.php?pk=107955&T=1

As an alternative you can also use a QR Code:  

The GUIDs for individual cells are displayed in the table below:

ARIMA Parameter Estimation and Backward Selection
Iterationar1ar2ar3ma1sar1sar2sma1
Estimates ( 1 )-0.6548-0.43630.04670.0608-0.10360.03830.0608
(p-val)(0.7002 )(0.7181 )(0.9544 )(0.9776 )(0.9579 )(0.9026 )(0.9776 )
Estimates ( 2 )-0.6196-0.40540.06380-0.02590.03080.0094
(p-val)(0.6477 )(0.6712 )(0.9204 )(NA )(0.9902 )(0.92 )(0.9967 )
Estimates ( 3 )-0.5964-0.39060.07430-0.03990.03010
(p-val)(0.5844 )(0.5835 )(0.883 )(NA )(0.9708 )(0.9115 )(NA )
Estimates ( 4 )-0.6358-0.41470.0566000.02960
(p-val)(0 )(0.0925 )(0.7088 )(NA )(NA )(0.9087 )(NA )
Estimates ( 5 )-0.6358-0.39160.0660000
(p-val)(0 )(0.0082 )(0.611 )(NA )(NA )(NA )(NA )
Estimates ( 6 )-0.6617-0.434100000
(p-val)(0 )(4e-04 )(NA )(NA )(NA )(NA )(NA )
Estimates ( 7 )NANANANANANANA
(p-val)(NA )(NA )(NA )(NA )(NA )(NA )(NA )
Estimates ( 8 )NANANANANANANA
(p-val)(NA )(NA )(NA )(NA )(NA )(NA )(NA )
Estimates ( 9 )NANANANANANANA
(p-val)(NA )(NA )(NA )(NA )(NA )(NA )(NA )
Estimates ( 10 )NANANANANANANA
(p-val)(NA )(NA )(NA )(NA )(NA )(NA )(NA )
Estimates ( 11 )NANANANANANANA
(p-val)(NA )(NA )(NA )(NA )(NA )(NA )(NA )
Estimates ( 12 )NANANANANANANA
(p-val)(NA )(NA )(NA )(NA )(NA )(NA )(NA )
Estimates ( 13 )NANANANANANANA
(p-val)(NA )(NA )(NA )(NA )(NA )(NA )(NA )


Estimated ARIMA Residuals
Value
4.14299673217516
227.710747157245
828.553696796382
358.763903839703
938.05523602158
194.264042782966
-1191.52267003560
-230.697033180527
205.639462753314
110.645811653659
-508.471284886596
879.523239097866
714.588523695794
-188.277228441440
540.298237298359
-793.269877286752
164.772657348318
-34.5766521658361
-564.916209794497
-446.618424659806
-38.0962719833888
573.221238376832
-867.648369266613
-159.813585356420
-54.9339697560727
-182.715921253723
580.112169474857
-550.444986417853
-277.849238773176
512.638622775511
-151.355876795850
157.501647446935
-971.524289766192
1520.95190550642
-553.492430771438
-539.467837954238
-33.5288308742925
608.434657793266
19.8468934564189
-132.635809509978
-539.295509324391
491.238884608139
-597.807819683278
-360.47303331842
154.448140245569
-17.8202738795471
67.663564017319
526.246230419192
-1071.34958283987
-405.288394346323
-59.3230418605804
451.225926016454
-118.906665653617
444.293454762649
-168.769449492591
269.668005916994
-86.025527307986
-150.411007578854
-651.633029013347
-330.114639398577
-93.9443923626918
578.309608646678
1623.19567216737
782.822009783486
931.240409706092
1125.23428847629
-1036.79729699348

\begin{tabular}{lllllllll}
\hline
Estimated ARIMA Residuals \tabularnewline
Value \tabularnewline
4.14299673217516 \tabularnewline
227.710747157245 \tabularnewline
828.553696796382 \tabularnewline
358.763903839703 \tabularnewline
938.05523602158 \tabularnewline
194.264042782966 \tabularnewline
-1191.52267003560 \tabularnewline
-230.697033180527 \tabularnewline
205.639462753314 \tabularnewline
110.645811653659 \tabularnewline
-508.471284886596 \tabularnewline
879.523239097866 \tabularnewline
714.588523695794 \tabularnewline
-188.277228441440 \tabularnewline
540.298237298359 \tabularnewline
-793.269877286752 \tabularnewline
164.772657348318 \tabularnewline
-34.5766521658361 \tabularnewline
-564.916209794497 \tabularnewline
-446.618424659806 \tabularnewline
-38.0962719833888 \tabularnewline
573.221238376832 \tabularnewline
-867.648369266613 \tabularnewline
-159.813585356420 \tabularnewline
-54.9339697560727 \tabularnewline
-182.715921253723 \tabularnewline
580.112169474857 \tabularnewline
-550.444986417853 \tabularnewline
-277.849238773176 \tabularnewline
512.638622775511 \tabularnewline
-151.355876795850 \tabularnewline
157.501647446935 \tabularnewline
-971.524289766192 \tabularnewline
1520.95190550642 \tabularnewline
-553.492430771438 \tabularnewline
-539.467837954238 \tabularnewline
-33.5288308742925 \tabularnewline
608.434657793266 \tabularnewline
19.8468934564189 \tabularnewline
-132.635809509978 \tabularnewline
-539.295509324391 \tabularnewline
491.238884608139 \tabularnewline
-597.807819683278 \tabularnewline
-360.47303331842 \tabularnewline
154.448140245569 \tabularnewline
-17.8202738795471 \tabularnewline
67.663564017319 \tabularnewline
526.246230419192 \tabularnewline
-1071.34958283987 \tabularnewline
-405.288394346323 \tabularnewline
-59.3230418605804 \tabularnewline
451.225926016454 \tabularnewline
-118.906665653617 \tabularnewline
444.293454762649 \tabularnewline
-168.769449492591 \tabularnewline
269.668005916994 \tabularnewline
-86.025527307986 \tabularnewline
-150.411007578854 \tabularnewline
-651.633029013347 \tabularnewline
-330.114639398577 \tabularnewline
-93.9443923626918 \tabularnewline
578.309608646678 \tabularnewline
1623.19567216737 \tabularnewline
782.822009783486 \tabularnewline
931.240409706092 \tabularnewline
1125.23428847629 \tabularnewline
-1036.79729699348 \tabularnewline
\hline
\end{tabular}
%Source: https://freestatistics.org/blog/index.php?pk=107955&T=2

[TABLE]
[ROW][C]Estimated ARIMA Residuals[/C][/ROW]
[ROW][C]Value[/C][/ROW]
[ROW][C]4.14299673217516[/C][/ROW]
[ROW][C]227.710747157245[/C][/ROW]
[ROW][C]828.553696796382[/C][/ROW]
[ROW][C]358.763903839703[/C][/ROW]
[ROW][C]938.05523602158[/C][/ROW]
[ROW][C]194.264042782966[/C][/ROW]
[ROW][C]-1191.52267003560[/C][/ROW]
[ROW][C]-230.697033180527[/C][/ROW]
[ROW][C]205.639462753314[/C][/ROW]
[ROW][C]110.645811653659[/C][/ROW]
[ROW][C]-508.471284886596[/C][/ROW]
[ROW][C]879.523239097866[/C][/ROW]
[ROW][C]714.588523695794[/C][/ROW]
[ROW][C]-188.277228441440[/C][/ROW]
[ROW][C]540.298237298359[/C][/ROW]
[ROW][C]-793.269877286752[/C][/ROW]
[ROW][C]164.772657348318[/C][/ROW]
[ROW][C]-34.5766521658361[/C][/ROW]
[ROW][C]-564.916209794497[/C][/ROW]
[ROW][C]-446.618424659806[/C][/ROW]
[ROW][C]-38.0962719833888[/C][/ROW]
[ROW][C]573.221238376832[/C][/ROW]
[ROW][C]-867.648369266613[/C][/ROW]
[ROW][C]-159.813585356420[/C][/ROW]
[ROW][C]-54.9339697560727[/C][/ROW]
[ROW][C]-182.715921253723[/C][/ROW]
[ROW][C]580.112169474857[/C][/ROW]
[ROW][C]-550.444986417853[/C][/ROW]
[ROW][C]-277.849238773176[/C][/ROW]
[ROW][C]512.638622775511[/C][/ROW]
[ROW][C]-151.355876795850[/C][/ROW]
[ROW][C]157.501647446935[/C][/ROW]
[ROW][C]-971.524289766192[/C][/ROW]
[ROW][C]1520.95190550642[/C][/ROW]
[ROW][C]-553.492430771438[/C][/ROW]
[ROW][C]-539.467837954238[/C][/ROW]
[ROW][C]-33.5288308742925[/C][/ROW]
[ROW][C]608.434657793266[/C][/ROW]
[ROW][C]19.8468934564189[/C][/ROW]
[ROW][C]-132.635809509978[/C][/ROW]
[ROW][C]-539.295509324391[/C][/ROW]
[ROW][C]491.238884608139[/C][/ROW]
[ROW][C]-597.807819683278[/C][/ROW]
[ROW][C]-360.47303331842[/C][/ROW]
[ROW][C]154.448140245569[/C][/ROW]
[ROW][C]-17.8202738795471[/C][/ROW]
[ROW][C]67.663564017319[/C][/ROW]
[ROW][C]526.246230419192[/C][/ROW]
[ROW][C]-1071.34958283987[/C][/ROW]
[ROW][C]-405.288394346323[/C][/ROW]
[ROW][C]-59.3230418605804[/C][/ROW]
[ROW][C]451.225926016454[/C][/ROW]
[ROW][C]-118.906665653617[/C][/ROW]
[ROW][C]444.293454762649[/C][/ROW]
[ROW][C]-168.769449492591[/C][/ROW]
[ROW][C]269.668005916994[/C][/ROW]
[ROW][C]-86.025527307986[/C][/ROW]
[ROW][C]-150.411007578854[/C][/ROW]
[ROW][C]-651.633029013347[/C][/ROW]
[ROW][C]-330.114639398577[/C][/ROW]
[ROW][C]-93.9443923626918[/C][/ROW]
[ROW][C]578.309608646678[/C][/ROW]
[ROW][C]1623.19567216737[/C][/ROW]
[ROW][C]782.822009783486[/C][/ROW]
[ROW][C]931.240409706092[/C][/ROW]
[ROW][C]1125.23428847629[/C][/ROW]
[ROW][C]-1036.79729699348[/C][/ROW]
[/TABLE]
Source: https://freestatistics.org/blog/index.php?pk=107955&T=2

Globally Unique Identifier (entire table): ba.freestatistics.org/blog/index.php?pk=107955&T=2

As an alternative you can also use a QR Code:  

The GUIDs for individual cells are displayed in the table below:

Estimated ARIMA Residuals
Value
4.14299673217516
227.710747157245
828.553696796382
358.763903839703
938.05523602158
194.264042782966
-1191.52267003560
-230.697033180527
205.639462753314
110.645811653659
-508.471284886596
879.523239097866
714.588523695794
-188.277228441440
540.298237298359
-793.269877286752
164.772657348318
-34.5766521658361
-564.916209794497
-446.618424659806
-38.0962719833888
573.221238376832
-867.648369266613
-159.813585356420
-54.9339697560727
-182.715921253723
580.112169474857
-550.444986417853
-277.849238773176
512.638622775511
-151.355876795850
157.501647446935
-971.524289766192
1520.95190550642
-553.492430771438
-539.467837954238
-33.5288308742925
608.434657793266
19.8468934564189
-132.635809509978
-539.295509324391
491.238884608139
-597.807819683278
-360.47303331842
154.448140245569
-17.8202738795471
67.663564017319
526.246230419192
-1071.34958283987
-405.288394346323
-59.3230418605804
451.225926016454
-118.906665653617
444.293454762649
-168.769449492591
269.668005916994
-86.025527307986
-150.411007578854
-651.633029013347
-330.114639398577
-93.9443923626918
578.309608646678
1623.19567216737
782.822009783486
931.240409706092
1125.23428847629
-1036.79729699348


Parameters (Session):
par1 = FALSE ; par2 = 1 ; par3 = 1 ; par4 = 0 ; par5 = 1 ; par6 = 3 ; par7 = 1 ; par8 = 2 ; par9 = 1 ;
Parameters (R input):
par1 = FALSE ; par2 = 1 ; par3 = 1 ; par4 = 0 ; par5 = 1 ; par6 = 3 ; par7 = 1 ; par8 = 2 ; par9 = 1 ;
R code (references can be found in the software module):
library(lattice)
if (par1 == 'TRUE') par1 <- TRUE
if (par1 == 'FALSE') par1 <- FALSE
par2 <- as.numeric(par2) #Box-Cox lambda transformation parameter
par3 <- as.numeric(par3) #degree of non-seasonal differencing
par4 <- as.numeric(par4) #degree of seasonal differencing
par5 <- as.numeric(par5) #seasonal period
par6 <- as.numeric(par6) #degree (p) of the non-seasonal AR(p) polynomial
par7 <- as.numeric(par7) #degree (q) of the non-seasonal MA(q) polynomial
par8 <- as.numeric(par8) #degree (P) of the seasonal AR(P) polynomial
par9 <- as.numeric(par9) #degree (Q) of the seasonal MA(Q) polynomial
armaGR <- function(arima.out, names, n){
try1 <- arima.out$coef
try2 <- sqrt(diag(arima.out$var.coef))
try.data.frame <- data.frame(matrix(NA,ncol=4,nrow=length(names)))
dimnames(try.data.frame) <- list(names,c('coef','std','tstat','pv'))
try.data.frame[,1] <- try1
for(i in 1:length(try2)) try.data.frame[which(rownames(try.data.frame)==names(try2)[i]),2] <- try2[i]
try.data.frame[,3] <- try.data.frame[,1] / try.data.frame[,2]
try.data.frame[,4] <- round((1-pt(abs(try.data.frame[,3]),df=n-(length(try2)+1)))*2,5)
vector <- rep(NA,length(names))
vector[is.na(try.data.frame[,4])] <- 0
maxi <- which.max(try.data.frame[,4])
continue <- max(try.data.frame[,4],na.rm=TRUE) > .05
vector[maxi] <- 0
list(summary=try.data.frame,next.vector=vector,continue=continue)
}
arimaSelect <- function(series, order=c(13,0,0), seasonal=list(order=c(2,0,0),period=12), include.mean=F){
nrc <- order[1]+order[3]+seasonal$order[1]+seasonal$order[3]
coeff <- matrix(NA, nrow=nrc*2, ncol=nrc)
pval <- matrix(NA, nrow=nrc*2, ncol=nrc)
mylist <- rep(list(NULL), nrc)
names <- NULL
if(order[1] > 0) names <- paste('ar',1:order[1],sep='')
if(order[3] > 0) names <- c( names , paste('ma',1:order[3],sep='') )
if(seasonal$order[1] > 0) names <- c(names, paste('sar',1:seasonal$order[1],sep=''))
if(seasonal$order[3] > 0) names <- c(names, paste('sma',1:seasonal$order[3],sep=''))
arima.out <- arima(series, order=order, seasonal=seasonal, include.mean=include.mean, method='ML')
mylist[[1]] <- arima.out
last.arma <- armaGR(arima.out, names, length(series))
mystop <- FALSE
i <- 1
coeff[i,] <- last.arma[[1]][,1]
pval [i,] <- last.arma[[1]][,4]
i <- 2
aic <- arima.out$aic
while(!mystop){
mylist[[i]] <- arima.out
arima.out <- arima(series, order=order, seasonal=seasonal, include.mean=include.mean, method='ML', fixed=last.arma$next.vector)
aic <- c(aic, arima.out$aic)
last.arma <- armaGR(arima.out, names, length(series))
mystop <- !last.arma$continue
coeff[i,] <- last.arma[[1]][,1]
pval [i,] <- last.arma[[1]][,4]
i <- i+1
}
list(coeff, pval, mylist, aic=aic)
}
arimaSelectplot <- function(arimaSelect.out,noms,choix){
noms <- names(arimaSelect.out[[3]][[1]]$coef)
coeff <- arimaSelect.out[[1]]
k <- min(which(is.na(coeff[,1])))-1
coeff <- coeff[1:k,]
pval <- arimaSelect.out[[2]][1:k,]
aic <- arimaSelect.out$aic[1:k]
coeff[coeff==0] <- NA
n <- ncol(coeff)
if(missing(choix)) choix <- k
layout(matrix(c(1,1,1,2,
3,3,3,2,
3,3,3,4,
5,6,7,7),nr=4),
widths=c(10,35,45,15),
heights=c(30,30,15,15))
couleurs <- rainbow(75)[1:50]#(50)
ticks <- pretty(coeff)
par(mar=c(1,1,3,1))
plot(aic,k:1-.5,type='o',pch=21,bg='blue',cex=2,axes=F,lty=2,xpd=NA)
points(aic[choix],k-choix+.5,pch=21,cex=4,bg=2,xpd=NA)
title('aic',line=2)
par(mar=c(3,0,0,0))
plot(0,axes=F,xlab='',ylab='',xlim=range(ticks),ylim=c(.1,1))
rect(xleft = min(ticks) + (0:49)/50*(max(ticks)-min(ticks)),
xright = min(ticks) + (1:50)/50*(max(ticks)-min(ticks)),
ytop = rep(1,50),
ybottom= rep(0,50),col=couleurs,border=NA)
axis(1,ticks)
rect(xleft=min(ticks),xright=max(ticks),ytop=1,ybottom=0)
text(mean(coeff,na.rm=T),.5,'coefficients',cex=2,font=2)
par(mar=c(1,1,3,1))
image(1:n,1:k,t(coeff[k:1,]),axes=F,col=couleurs,zlim=range(ticks))
for(i in 1:n) for(j in 1:k) if(!is.na(coeff[j,i])) {
if(pval[j,i]<.01) symb = 'green'
else if( (pval[j,i]<.05) & (pval[j,i]>=.01)) symb = 'orange'
else if( (pval[j,i]<.1) & (pval[j,i]>=.05)) symb = 'red'
else symb = 'black'
polygon(c(i+.5 ,i+.2 ,i+.5 ,i+.5),
c(k-j+0.5,k-j+0.5,k-j+0.8,k-j+0.5),
col=symb)
if(j==choix) {
rect(xleft=i-.5,
xright=i+.5,
ybottom=k-j+1.5,
ytop=k-j+.5,
lwd=4)
text(i,
k-j+1,
round(coeff[j,i],2),
cex=1.2,
font=2)
}
else{
rect(xleft=i-.5,xright=i+.5,ybottom=k-j+1.5,ytop=k-j+.5)
text(i,k-j+1,round(coeff[j,i],2),cex=1.2,font=1)
}
}
axis(3,1:n,noms)
par(mar=c(0.5,0,0,0.5))
plot(0,axes=F,xlab='',ylab='',type='n',xlim=c(0,8),ylim=c(-.2,.8))
cols <- c('green','orange','red','black')
niv <- c('0','0.01','0.05','0.1')
for(i in 0:3){
polygon(c(1+2*i ,1+2*i ,1+2*i-.5 ,1+2*i),
c(.4 ,.7 , .4 , .4),
col=cols[i+1])
text(2*i,0.5,niv[i+1],cex=1.5)
}
text(8,.5,1,cex=1.5)
text(4,0,'p-value',cex=2)
box()
residus <- arimaSelect.out[[3]][[choix]]$res
par(mar=c(1,2,4,1))
acf(residus,main='')
title('acf',line=.5)
par(mar=c(1,2,4,1))
pacf(residus,main='')
title('pacf',line=.5)
par(mar=c(2,2,4,1))
qqnorm(residus,main='')
title('qq-norm',line=.5)
qqline(residus)
residus
}
if (par2 == 0) x <- log(x)
if (par2 != 0) x <- x^par2
(selection <- arimaSelect(x, order=c(par6,par3,par7), seasonal=list(order=c(par8,par4,par9), period=par5)))
bitmap(file='test1.png')
resid <- arimaSelectplot(selection)
dev.off()
resid
bitmap(file='test2.png')
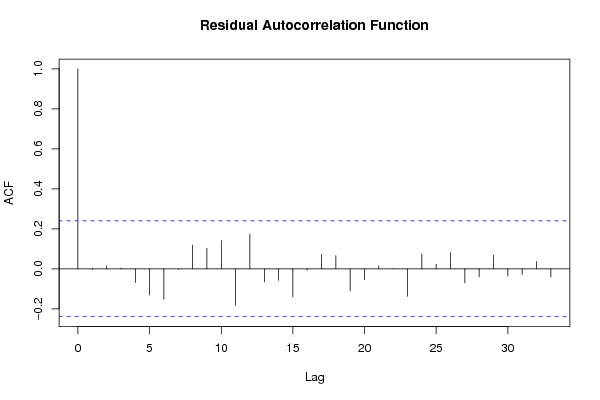
acf(resid,length(resid)/2, main='Residual Autocorrelation Function')
dev.off()
bitmap(file='test3.png')
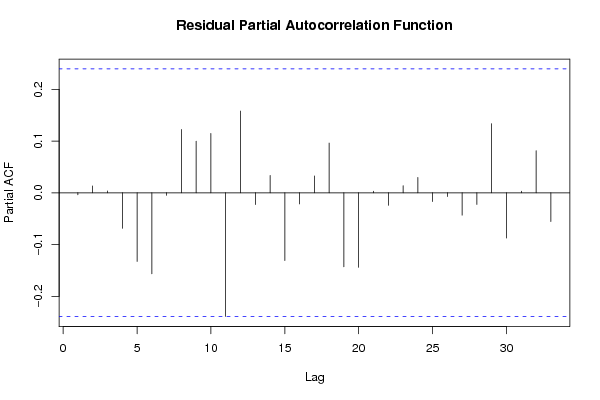
pacf(resid,length(resid)/2, main='Residual Partial Autocorrelation Function')
dev.off()
bitmap(file='test4.png')
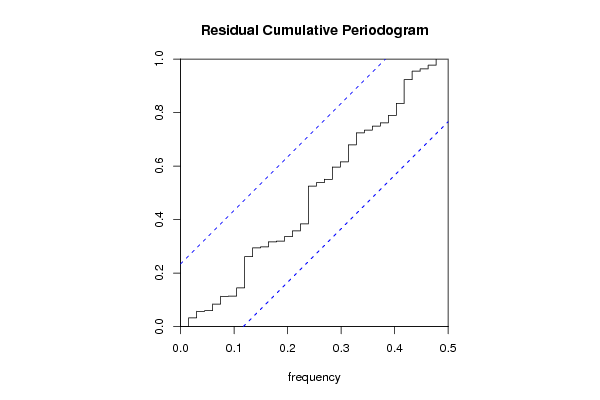
cpgram(resid, main='Residual Cumulative Periodogram')
dev.off()
bitmap(file='test5.png')
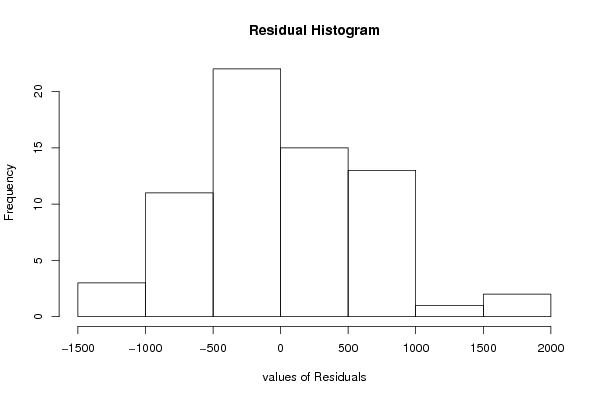
hist(resid, main='Residual Histogram', xlab='values of Residuals')
dev.off()
bitmap(file='test6.png')
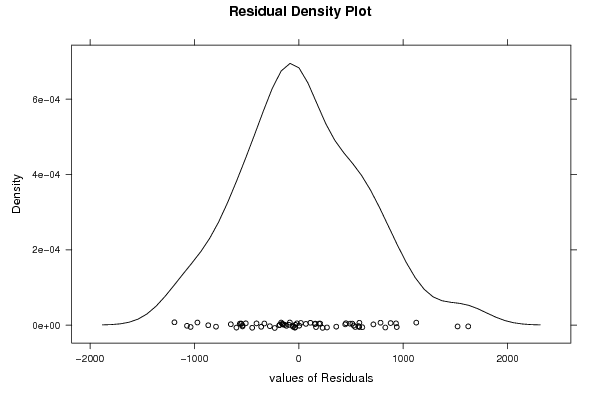
densityplot(~resid,col='black',main='Residual Density Plot', xlab='values of Residuals')
dev.off()
bitmap(file='test7.png')
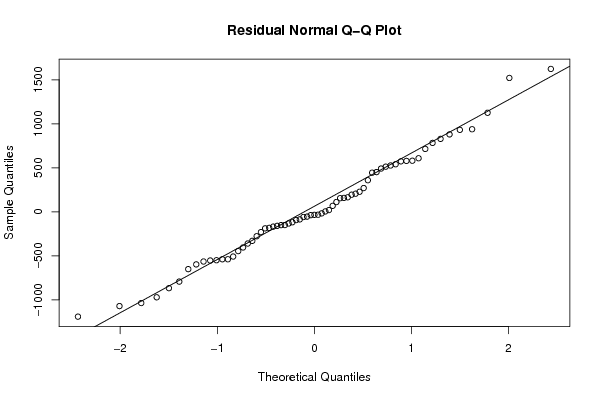
qqnorm(resid, main='Residual Normal Q-Q Plot')
qqline(resid)
dev.off()
ncols <- length(selection[[1]][1,])
nrows <- length(selection[[2]][,1])-1
load(file='createtable')
a<-table.start()
a<-table.row.start(a)
a<-table.element(a,'ARIMA Parameter Estimation and Backward Selection', ncols+1,TRUE)
a<-table.row.end(a)
a<-table.row.start(a)
a<-table.element(a,'Iteration', header=TRUE)
for (i in 1:ncols) {
a<-table.element(a,names(selection[[3]][[1]]$coef)[i],header=TRUE)
}
a<-table.row.end(a)
for (j in 1:nrows) {
a<-table.row.start(a)
mydum <- 'Estimates ('
mydum <- paste(mydum,j)
mydum <- paste(mydum,')')
a<-table.element(a,mydum, header=TRUE)
for (i in 1:ncols) {
a<-table.element(a,round(selection[[1]][j,i],4))
}
a<-table.row.end(a)
a<-table.row.start(a)
a<-table.element(a,'(p-val)', header=TRUE)
for (i in 1:ncols) {
mydum <- '('
mydum <- paste(mydum,round(selection[[2]][j,i],4),sep='')
mydum <- paste(mydum,')')
a<-table.element(a,mydum)
}
a<-table.row.end(a)
}
a<-table.end(a)
table.save(a,file='mytable.tab')
a<-table.start()
a<-table.row.start(a)
a<-table.element(a,'Estimated ARIMA Residuals', 1,TRUE)
a<-table.row.end(a)
a<-table.row.start(a)
a<-table.element(a,'Value', 1,TRUE)
a<-table.row.end(a)
for (i in (par4*par5+par3):length(resid)) {
a<-table.row.start(a)
a<-table.element(a,resid[i])
a<-table.row.end(a)
}
a<-table.end(a)
table.save(a,file='mytable1.tab')