Free Statistics

of Irreproducible Research!

Author's title

Author*The author of this computation has been verified*
R Software Modulerwasp_autocorrelation.wasp
Title produced by software(Partial) Autocorrelation Function
Date of computationFri, 10 Dec 2010 20:58:10 +0000
Cite this page as followsStatistical Computations at FreeStatistics.org, Office for Research Development and Education, URL https://freestatistics.org/blog/index.php?v=date/2010/Dec/10/t12920146746k91dnylv823px1.htm/, Retrieved Mon, 29 Apr 2024 13:00:28 +0000
Statistical Computations at FreeStatistics.org, Office for Research Development and Education, URL https://freestatistics.org/blog/index.php?pk=107940, Retrieved Mon, 29 Apr 2024 13:00:28 +0000
QR Codes:

Original text written by user:
IsPrivate?No (this computation is public)
User-defined keywords
Estimated Impact165
Family? (F = Feedback message, R = changed R code, M = changed R Module, P = changed Parameters, D = changed Data)
-     [Multiple Regression] [Schiphol: MR - Mo...] [2010-12-10 19:50:21] [97ad38b1c3b35a5feca8b85f7bc7b3ff]
- RMPD    [(Partial) Autocorrelation Function] [Autocorrelatiefun...] [2010-12-10 20:58:10] [9ea95e194e0eb2a674315798620d5bc6] [Current]
- R         [(Partial) Autocorrelation Function] [Paper - autocorre...] [2011-12-22 14:13:15] [69d59b79aaf660457acc70a0ef0bfdab]
Feedback Forum

Post a new message
Dataseries X:
1149822
1086979
1276674
1522522
1742117
1737275
1979900
2061036
1867943
1707752
1298756
1281814
1281151
1164976
1454329
1645288
1817743
1895785
2236311
2295951
2087315
1980891
1465446
1445026
1488120
1338333
1715789
1806090
2083316
2092278
2430800
2424894
2299016
2130688
1652221
1608162
1647074
1479691
1884978
2007898
2208954
2217164
2534291
2560312
2429069
2315077
1799608
1772590
1744799
1659093
2099821
2135736
2427894
2468882
2703217
2766841
2655236
2550373
2052097
1998055
1920748
1876694
2380930
2467402
2770771
2781340
3143926
3172235
2952540
2920877
2384552
2248987
2208616
2178756
2632870
2706905
3029745
3015402
3391414
3507805
3177852
3142961
2545815
2414007
2372578
2332664
2825328
2901478
3263955
3226738
3610786
3709274
3467185
3449646
2802951
2462530
2490645
2561520
3067554
3226951
3546493
3492787
3952263
3932072
3720284
3651555
2914972
2713514
2703997
2591373
3163748
3355137
3613702
3686773
4098716
4063517
3551489
3226663
2656842
2597484
2572399
2596631
3165225
3303145
3698247
3668631
4130433
4131400
3864358
3721110
2892532
2843451
2747502
2668775
3018602
3013392
3393657
3544233
4075832
4032923
3734509
3761285
2970090
2847849
2741680
2830639
3257673
3480085
3843271
3796961
4337767
4243630
3927202
3915296
3087396
2963792
2955792
2829925
3281195
3548011
4059648
3941175
4528594
4433151
4145737
4077132
3198519
3078660
3028202
2858642
3398954
3808883
4175961
4227542
4744616
4608012
4295049
4201144
3353276
3286851
3169889
3051720
3695426
3905501
4296458
4246247
4921849
4821446
4425064
4379099
3472889
3359160
3200944
3153170
3741498
3918719
4403449
4400407
4847473
4716136
4297440
4272253
3271834
3168388
2911748
2720999
3199918
3672623
3892013
3850845
4532467
4484739
4014972
3983758
3158459
3100569
2935404
2855719
3465611
3006985
4095110
4104793
4730788
4642726
4246919
4308117


Summary of computational transaction
Raw Inputview raw input (R code)
Raw Outputview raw output of R engine
Computing time2 seconds
R Server'RServer@AstonUniversity' @ vre.aston.ac.uk

\begin{tabular}{lllllllll}
\hline
Summary of computational transaction \tabularnewline
Raw Input & view raw input (R code)  \tabularnewline
Raw Output & view raw output of R engine  \tabularnewline
Computing time & 2 seconds \tabularnewline
R Server & 'RServer@AstonUniversity' @ vre.aston.ac.uk \tabularnewline
\hline
\end{tabular}
%Source: https://freestatistics.org/blog/index.php?pk=107940&T=0

[TABLE]
[ROW][C]Summary of computational transaction[/C][/ROW]
[ROW][C]Raw Input[/C][C]view raw input (R code) [/C][/ROW]
[ROW][C]Raw Output[/C][C]view raw output of R engine [/C][/ROW]
[ROW][C]Computing time[/C][C]2 seconds[/C][/ROW]
[ROW][C]R Server[/C][C]'RServer@AstonUniversity' @ vre.aston.ac.uk[/C][/ROW]
[/TABLE]
Source: https://freestatistics.org/blog/index.php?pk=107940&T=0

Globally Unique Identifier (entire table): ba.freestatistics.org/blog/index.php?pk=107940&T=0

As an alternative you can also use a QR Code:  

The GUIDs for individual cells are displayed in the table below:

Summary of computational transaction
Raw Inputview raw input (R code)
Raw Outputview raw output of R engine
Computing time2 seconds
R Server'RServer@AstonUniversity' @ vre.aston.ac.uk


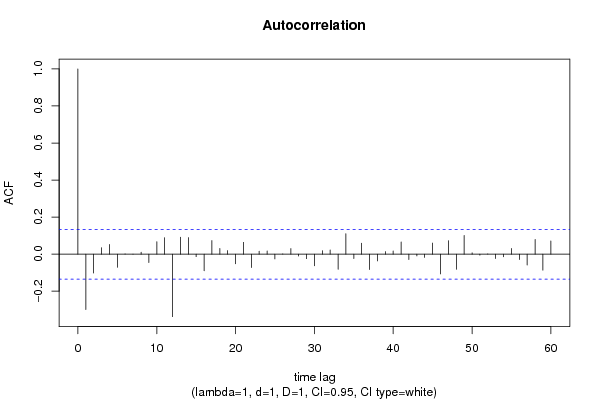
Autocorrelation Function
Time lag kACF(k)T-STATP-value
1-0.298927-4.36271e-05
2-0.101987-1.48850.069055
30.0345340.5040.30739
40.0516830.75430.225753
5-0.071121-1.0380.150229
6-0.001007-0.01470.494146
73e-054e-040.499827
80.010560.15410.438831
9-0.045368-0.66210.254303
100.0668210.97520.165277
110.0882821.28840.099497
12-0.337599-4.92711e-06
130.0913061.33260.092048
140.0891631.30130.097282
15-0.013705-0.20.420831
16-0.089648-1.30840.09608
170.0731031.06690.14361
180.0301520.44010.330173
190.0191670.27970.389975
20-0.052218-0.76210.223421
210.0636670.92920.176921
22-0.072526-1.05850.145516
230.0152990.22330.411765
240.0170140.24830.402065
25-0.025687-0.37490.354057
26-0.001193-0.01740.493063
270.0300630.43880.330642
28-0.010213-0.1490.440828
29-0.024283-0.35440.361694
30-0.062989-0.91930.179492
310.0187250.27330.392451
320.0228620.33370.369481
33-0.081354-1.18730.118213
340.1106531.61490.053903
35-0.023767-0.34690.364514
360.0591460.86320.194497
37-0.082719-1.20720.114339
38-0.036693-0.53550.296428
390.0136540.19930.421117
400.0169240.2470.402571
410.065420.95480.170388
42-0.029484-0.43030.333702
43-0.009726-0.14190.443628
44-0.01774-0.25890.397981
450.0595870.86960.192737
46-0.106828-1.55910.060228
470.072131.05270.146835
48-0.081608-1.1910.117483
490.100281.46350.072398
500.0070360.10270.459153
51-0.005567-0.08120.467663
520.0013140.01920.492361
53-0.0239-0.34880.363789
54-0.014614-0.21330.415656
550.0307880.44930.326821
56-0.029381-0.42880.334251
57-0.058675-0.85630.196387
580.079221.15620.124451
59-0.08654-1.2630.103984
600.0709881.0360.15068

\begin{tabular}{lllllllll}
\hline
Autocorrelation Function \tabularnewline
Time lag k & ACF(k) & T-STAT & P-value \tabularnewline
1 & -0.298927 & -4.3627 & 1e-05 \tabularnewline
2 & -0.101987 & -1.4885 & 0.069055 \tabularnewline
3 & 0.034534 & 0.504 & 0.30739 \tabularnewline
4 & 0.051683 & 0.7543 & 0.225753 \tabularnewline
5 & -0.071121 & -1.038 & 0.150229 \tabularnewline
6 & -0.001007 & -0.0147 & 0.494146 \tabularnewline
7 & 3e-05 & 4e-04 & 0.499827 \tabularnewline
8 & 0.01056 & 0.1541 & 0.438831 \tabularnewline
9 & -0.045368 & -0.6621 & 0.254303 \tabularnewline
10 & 0.066821 & 0.9752 & 0.165277 \tabularnewline
11 & 0.088282 & 1.2884 & 0.099497 \tabularnewline
12 & -0.337599 & -4.9271 & 1e-06 \tabularnewline
13 & 0.091306 & 1.3326 & 0.092048 \tabularnewline
14 & 0.089163 & 1.3013 & 0.097282 \tabularnewline
15 & -0.013705 & -0.2 & 0.420831 \tabularnewline
16 & -0.089648 & -1.3084 & 0.09608 \tabularnewline
17 & 0.073103 & 1.0669 & 0.14361 \tabularnewline
18 & 0.030152 & 0.4401 & 0.330173 \tabularnewline
19 & 0.019167 & 0.2797 & 0.389975 \tabularnewline
20 & -0.052218 & -0.7621 & 0.223421 \tabularnewline
21 & 0.063667 & 0.9292 & 0.176921 \tabularnewline
22 & -0.072526 & -1.0585 & 0.145516 \tabularnewline
23 & 0.015299 & 0.2233 & 0.411765 \tabularnewline
24 & 0.017014 & 0.2483 & 0.402065 \tabularnewline
25 & -0.025687 & -0.3749 & 0.354057 \tabularnewline
26 & -0.001193 & -0.0174 & 0.493063 \tabularnewline
27 & 0.030063 & 0.4388 & 0.330642 \tabularnewline
28 & -0.010213 & -0.149 & 0.440828 \tabularnewline
29 & -0.024283 & -0.3544 & 0.361694 \tabularnewline
30 & -0.062989 & -0.9193 & 0.179492 \tabularnewline
31 & 0.018725 & 0.2733 & 0.392451 \tabularnewline
32 & 0.022862 & 0.3337 & 0.369481 \tabularnewline
33 & -0.081354 & -1.1873 & 0.118213 \tabularnewline
34 & 0.110653 & 1.6149 & 0.053903 \tabularnewline
35 & -0.023767 & -0.3469 & 0.364514 \tabularnewline
36 & 0.059146 & 0.8632 & 0.194497 \tabularnewline
37 & -0.082719 & -1.2072 & 0.114339 \tabularnewline
38 & -0.036693 & -0.5355 & 0.296428 \tabularnewline
39 & 0.013654 & 0.1993 & 0.421117 \tabularnewline
40 & 0.016924 & 0.247 & 0.402571 \tabularnewline
41 & 0.06542 & 0.9548 & 0.170388 \tabularnewline
42 & -0.029484 & -0.4303 & 0.333702 \tabularnewline
43 & -0.009726 & -0.1419 & 0.443628 \tabularnewline
44 & -0.01774 & -0.2589 & 0.397981 \tabularnewline
45 & 0.059587 & 0.8696 & 0.192737 \tabularnewline
46 & -0.106828 & -1.5591 & 0.060228 \tabularnewline
47 & 0.07213 & 1.0527 & 0.146835 \tabularnewline
48 & -0.081608 & -1.191 & 0.117483 \tabularnewline
49 & 0.10028 & 1.4635 & 0.072398 \tabularnewline
50 & 0.007036 & 0.1027 & 0.459153 \tabularnewline
51 & -0.005567 & -0.0812 & 0.467663 \tabularnewline
52 & 0.001314 & 0.0192 & 0.492361 \tabularnewline
53 & -0.0239 & -0.3488 & 0.363789 \tabularnewline
54 & -0.014614 & -0.2133 & 0.415656 \tabularnewline
55 & 0.030788 & 0.4493 & 0.326821 \tabularnewline
56 & -0.029381 & -0.4288 & 0.334251 \tabularnewline
57 & -0.058675 & -0.8563 & 0.196387 \tabularnewline
58 & 0.07922 & 1.1562 & 0.124451 \tabularnewline
59 & -0.08654 & -1.263 & 0.103984 \tabularnewline
60 & 0.070988 & 1.036 & 0.15068 \tabularnewline
\hline
\end{tabular}
%Source: https://freestatistics.org/blog/index.php?pk=107940&T=1

[TABLE]
[ROW][C]Autocorrelation Function[/C][/ROW]
[ROW][C]Time lag k[/C][C]ACF(k)[/C][C]T-STAT[/C][C]P-value[/C][/ROW]
[ROW][C]1[/C][C]-0.298927[/C][C]-4.3627[/C][C]1e-05[/C][/ROW]
[ROW][C]2[/C][C]-0.101987[/C][C]-1.4885[/C][C]0.069055[/C][/ROW]
[ROW][C]3[/C][C]0.034534[/C][C]0.504[/C][C]0.30739[/C][/ROW]
[ROW][C]4[/C][C]0.051683[/C][C]0.7543[/C][C]0.225753[/C][/ROW]
[ROW][C]5[/C][C]-0.071121[/C][C]-1.038[/C][C]0.150229[/C][/ROW]
[ROW][C]6[/C][C]-0.001007[/C][C]-0.0147[/C][C]0.494146[/C][/ROW]
[ROW][C]7[/C][C]3e-05[/C][C]4e-04[/C][C]0.499827[/C][/ROW]
[ROW][C]8[/C][C]0.01056[/C][C]0.1541[/C][C]0.438831[/C][/ROW]
[ROW][C]9[/C][C]-0.045368[/C][C]-0.6621[/C][C]0.254303[/C][/ROW]
[ROW][C]10[/C][C]0.066821[/C][C]0.9752[/C][C]0.165277[/C][/ROW]
[ROW][C]11[/C][C]0.088282[/C][C]1.2884[/C][C]0.099497[/C][/ROW]
[ROW][C]12[/C][C]-0.337599[/C][C]-4.9271[/C][C]1e-06[/C][/ROW]
[ROW][C]13[/C][C]0.091306[/C][C]1.3326[/C][C]0.092048[/C][/ROW]
[ROW][C]14[/C][C]0.089163[/C][C]1.3013[/C][C]0.097282[/C][/ROW]
[ROW][C]15[/C][C]-0.013705[/C][C]-0.2[/C][C]0.420831[/C][/ROW]
[ROW][C]16[/C][C]-0.089648[/C][C]-1.3084[/C][C]0.09608[/C][/ROW]
[ROW][C]17[/C][C]0.073103[/C][C]1.0669[/C][C]0.14361[/C][/ROW]
[ROW][C]18[/C][C]0.030152[/C][C]0.4401[/C][C]0.330173[/C][/ROW]
[ROW][C]19[/C][C]0.019167[/C][C]0.2797[/C][C]0.389975[/C][/ROW]
[ROW][C]20[/C][C]-0.052218[/C][C]-0.7621[/C][C]0.223421[/C][/ROW]
[ROW][C]21[/C][C]0.063667[/C][C]0.9292[/C][C]0.176921[/C][/ROW]
[ROW][C]22[/C][C]-0.072526[/C][C]-1.0585[/C][C]0.145516[/C][/ROW]
[ROW][C]23[/C][C]0.015299[/C][C]0.2233[/C][C]0.411765[/C][/ROW]
[ROW][C]24[/C][C]0.017014[/C][C]0.2483[/C][C]0.402065[/C][/ROW]
[ROW][C]25[/C][C]-0.025687[/C][C]-0.3749[/C][C]0.354057[/C][/ROW]
[ROW][C]26[/C][C]-0.001193[/C][C]-0.0174[/C][C]0.493063[/C][/ROW]
[ROW][C]27[/C][C]0.030063[/C][C]0.4388[/C][C]0.330642[/C][/ROW]
[ROW][C]28[/C][C]-0.010213[/C][C]-0.149[/C][C]0.440828[/C][/ROW]
[ROW][C]29[/C][C]-0.024283[/C][C]-0.3544[/C][C]0.361694[/C][/ROW]
[ROW][C]30[/C][C]-0.062989[/C][C]-0.9193[/C][C]0.179492[/C][/ROW]
[ROW][C]31[/C][C]0.018725[/C][C]0.2733[/C][C]0.392451[/C][/ROW]
[ROW][C]32[/C][C]0.022862[/C][C]0.3337[/C][C]0.369481[/C][/ROW]
[ROW][C]33[/C][C]-0.081354[/C][C]-1.1873[/C][C]0.118213[/C][/ROW]
[ROW][C]34[/C][C]0.110653[/C][C]1.6149[/C][C]0.053903[/C][/ROW]
[ROW][C]35[/C][C]-0.023767[/C][C]-0.3469[/C][C]0.364514[/C][/ROW]
[ROW][C]36[/C][C]0.059146[/C][C]0.8632[/C][C]0.194497[/C][/ROW]
[ROW][C]37[/C][C]-0.082719[/C][C]-1.2072[/C][C]0.114339[/C][/ROW]
[ROW][C]38[/C][C]-0.036693[/C][C]-0.5355[/C][C]0.296428[/C][/ROW]
[ROW][C]39[/C][C]0.013654[/C][C]0.1993[/C][C]0.421117[/C][/ROW]
[ROW][C]40[/C][C]0.016924[/C][C]0.247[/C][C]0.402571[/C][/ROW]
[ROW][C]41[/C][C]0.06542[/C][C]0.9548[/C][C]0.170388[/C][/ROW]
[ROW][C]42[/C][C]-0.029484[/C][C]-0.4303[/C][C]0.333702[/C][/ROW]
[ROW][C]43[/C][C]-0.009726[/C][C]-0.1419[/C][C]0.443628[/C][/ROW]
[ROW][C]44[/C][C]-0.01774[/C][C]-0.2589[/C][C]0.397981[/C][/ROW]
[ROW][C]45[/C][C]0.059587[/C][C]0.8696[/C][C]0.192737[/C][/ROW]
[ROW][C]46[/C][C]-0.106828[/C][C]-1.5591[/C][C]0.060228[/C][/ROW]
[ROW][C]47[/C][C]0.07213[/C][C]1.0527[/C][C]0.146835[/C][/ROW]
[ROW][C]48[/C][C]-0.081608[/C][C]-1.191[/C][C]0.117483[/C][/ROW]
[ROW][C]49[/C][C]0.10028[/C][C]1.4635[/C][C]0.072398[/C][/ROW]
[ROW][C]50[/C][C]0.007036[/C][C]0.1027[/C][C]0.459153[/C][/ROW]
[ROW][C]51[/C][C]-0.005567[/C][C]-0.0812[/C][C]0.467663[/C][/ROW]
[ROW][C]52[/C][C]0.001314[/C][C]0.0192[/C][C]0.492361[/C][/ROW]
[ROW][C]53[/C][C]-0.0239[/C][C]-0.3488[/C][C]0.363789[/C][/ROW]
[ROW][C]54[/C][C]-0.014614[/C][C]-0.2133[/C][C]0.415656[/C][/ROW]
[ROW][C]55[/C][C]0.030788[/C][C]0.4493[/C][C]0.326821[/C][/ROW]
[ROW][C]56[/C][C]-0.029381[/C][C]-0.4288[/C][C]0.334251[/C][/ROW]
[ROW][C]57[/C][C]-0.058675[/C][C]-0.8563[/C][C]0.196387[/C][/ROW]
[ROW][C]58[/C][C]0.07922[/C][C]1.1562[/C][C]0.124451[/C][/ROW]
[ROW][C]59[/C][C]-0.08654[/C][C]-1.263[/C][C]0.103984[/C][/ROW]
[ROW][C]60[/C][C]0.070988[/C][C]1.036[/C][C]0.15068[/C][/ROW]
[/TABLE]
Source: https://freestatistics.org/blog/index.php?pk=107940&T=1

Globally Unique Identifier (entire table): ba.freestatistics.org/blog/index.php?pk=107940&T=1

As an alternative you can also use a QR Code:  

The GUIDs for individual cells are displayed in the table below:

Autocorrelation Function
Time lag kACF(k)T-STATP-value
1-0.298927-4.36271e-05
2-0.101987-1.48850.069055
30.0345340.5040.30739
40.0516830.75430.225753
5-0.071121-1.0380.150229
6-0.001007-0.01470.494146
73e-054e-040.499827
80.010560.15410.438831
9-0.045368-0.66210.254303
100.0668210.97520.165277
110.0882821.28840.099497
12-0.337599-4.92711e-06
130.0913061.33260.092048
140.0891631.30130.097282
15-0.013705-0.20.420831
16-0.089648-1.30840.09608
170.0731031.06690.14361
180.0301520.44010.330173
190.0191670.27970.389975
20-0.052218-0.76210.223421
210.0636670.92920.176921
22-0.072526-1.05850.145516
230.0152990.22330.411765
240.0170140.24830.402065
25-0.025687-0.37490.354057
26-0.001193-0.01740.493063
270.0300630.43880.330642
28-0.010213-0.1490.440828
29-0.024283-0.35440.361694
30-0.062989-0.91930.179492
310.0187250.27330.392451
320.0228620.33370.369481
33-0.081354-1.18730.118213
340.1106531.61490.053903
35-0.023767-0.34690.364514
360.0591460.86320.194497
37-0.082719-1.20720.114339
38-0.036693-0.53550.296428
390.0136540.19930.421117
400.0169240.2470.402571
410.065420.95480.170388
42-0.029484-0.43030.333702
43-0.009726-0.14190.443628
44-0.01774-0.25890.397981
450.0595870.86960.192737
46-0.106828-1.55910.060228
470.072131.05270.146835
48-0.081608-1.1910.117483
490.100281.46350.072398
500.0070360.10270.459153
51-0.005567-0.08120.467663
520.0013140.01920.492361
53-0.0239-0.34880.363789
54-0.014614-0.21330.415656
550.0307880.44930.326821
56-0.029381-0.42880.334251
57-0.058675-0.85630.196387
580.079221.15620.124451
59-0.08654-1.2630.103984
600.0709881.0360.15068


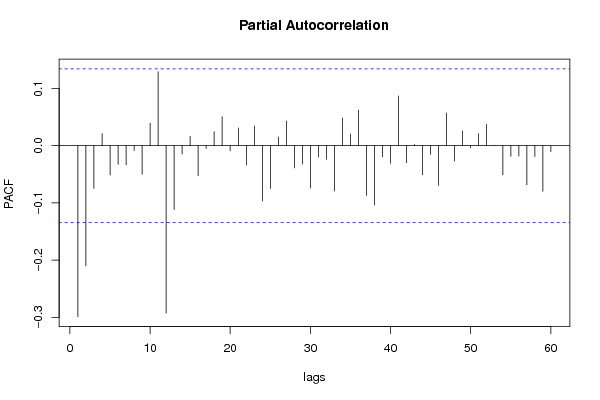
Partial Autocorrelation Function
Time lag kPACF(k)T-STATP-value
1-0.298927-4.36271e-05
2-0.210121-3.06660.001223
3-0.07487-1.09270.137881
40.0209650.3060.379963
5-0.051129-0.74620.228186
6-0.032296-0.47130.318938
7-0.03341-0.48760.313165
8-0.008285-0.12090.451934
9-0.049878-0.7280.233721
100.0392110.57230.283874
110.1293181.88730.030238
12-0.292815-4.27351.5e-05
13-0.111442-1.62640.052667
14-0.014296-0.20860.417466
150.0167840.24490.403366
16-0.052294-0.76320.223091
17-0.004699-0.06860.472693
180.0245630.35850.360168
190.050650.73920.230298
20-0.008929-0.13030.448221
210.0310990.45390.325189
22-0.033697-0.49180.311686
230.0344170.50230.307986
24-0.096497-1.40830.080246
25-0.074768-1.09120.138208
260.0152370.22240.412115
270.0430720.62860.265136
28-0.03877-0.56580.286051
29-0.031961-0.46650.320683
30-0.074041-1.08060.140551
31-0.019916-0.29070.385794
32-0.023842-0.3480.364104
33-0.079353-1.15810.124056
340.0483220.70520.240715
350.0204540.29850.3828
360.0622620.90870.182271
37-0.086915-1.26850.103005
38-0.103436-1.50960.066314
39-0.019434-0.28360.388484
40-0.030823-0.44990.326638
410.0870791.27090.102578
42-0.029886-0.43620.331578
430.0022320.03260.487024
44-0.050614-0.73870.230455
45-0.015222-0.22220.412203
46-0.069386-1.01270.156187
470.0573250.83660.201867
48-0.026846-0.39180.347798
490.0260170.37970.352268
50-0.0036-0.05250.479075
510.0209610.30590.379984
520.0371560.54230.2941
530.0005870.00860.496584
54-0.050942-0.74350.229005
55-0.018433-0.2690.394085
56-0.017844-0.26040.397393
57-0.068138-0.99440.160567
58-0.018871-0.27540.391633
59-0.079611-1.16190.123292
60-0.010223-0.14920.440767

\begin{tabular}{lllllllll}
\hline
Partial Autocorrelation Function \tabularnewline
Time lag k & PACF(k) & T-STAT & P-value \tabularnewline
1 & -0.298927 & -4.3627 & 1e-05 \tabularnewline
2 & -0.210121 & -3.0666 & 0.001223 \tabularnewline
3 & -0.07487 & -1.0927 & 0.137881 \tabularnewline
4 & 0.020965 & 0.306 & 0.379963 \tabularnewline
5 & -0.051129 & -0.7462 & 0.228186 \tabularnewline
6 & -0.032296 & -0.4713 & 0.318938 \tabularnewline
7 & -0.03341 & -0.4876 & 0.313165 \tabularnewline
8 & -0.008285 & -0.1209 & 0.451934 \tabularnewline
9 & -0.049878 & -0.728 & 0.233721 \tabularnewline
10 & 0.039211 & 0.5723 & 0.283874 \tabularnewline
11 & 0.129318 & 1.8873 & 0.030238 \tabularnewline
12 & -0.292815 & -4.2735 & 1.5e-05 \tabularnewline
13 & -0.111442 & -1.6264 & 0.052667 \tabularnewline
14 & -0.014296 & -0.2086 & 0.417466 \tabularnewline
15 & 0.016784 & 0.2449 & 0.403366 \tabularnewline
16 & -0.052294 & -0.7632 & 0.223091 \tabularnewline
17 & -0.004699 & -0.0686 & 0.472693 \tabularnewline
18 & 0.024563 & 0.3585 & 0.360168 \tabularnewline
19 & 0.05065 & 0.7392 & 0.230298 \tabularnewline
20 & -0.008929 & -0.1303 & 0.448221 \tabularnewline
21 & 0.031099 & 0.4539 & 0.325189 \tabularnewline
22 & -0.033697 & -0.4918 & 0.311686 \tabularnewline
23 & 0.034417 & 0.5023 & 0.307986 \tabularnewline
24 & -0.096497 & -1.4083 & 0.080246 \tabularnewline
25 & -0.074768 & -1.0912 & 0.138208 \tabularnewline
26 & 0.015237 & 0.2224 & 0.412115 \tabularnewline
27 & 0.043072 & 0.6286 & 0.265136 \tabularnewline
28 & -0.03877 & -0.5658 & 0.286051 \tabularnewline
29 & -0.031961 & -0.4665 & 0.320683 \tabularnewline
30 & -0.074041 & -1.0806 & 0.140551 \tabularnewline
31 & -0.019916 & -0.2907 & 0.385794 \tabularnewline
32 & -0.023842 & -0.348 & 0.364104 \tabularnewline
33 & -0.079353 & -1.1581 & 0.124056 \tabularnewline
34 & 0.048322 & 0.7052 & 0.240715 \tabularnewline
35 & 0.020454 & 0.2985 & 0.3828 \tabularnewline
36 & 0.062262 & 0.9087 & 0.182271 \tabularnewline
37 & -0.086915 & -1.2685 & 0.103005 \tabularnewline
38 & -0.103436 & -1.5096 & 0.066314 \tabularnewline
39 & -0.019434 & -0.2836 & 0.388484 \tabularnewline
40 & -0.030823 & -0.4499 & 0.326638 \tabularnewline
41 & 0.087079 & 1.2709 & 0.102578 \tabularnewline
42 & -0.029886 & -0.4362 & 0.331578 \tabularnewline
43 & 0.002232 & 0.0326 & 0.487024 \tabularnewline
44 & -0.050614 & -0.7387 & 0.230455 \tabularnewline
45 & -0.015222 & -0.2222 & 0.412203 \tabularnewline
46 & -0.069386 & -1.0127 & 0.156187 \tabularnewline
47 & 0.057325 & 0.8366 & 0.201867 \tabularnewline
48 & -0.026846 & -0.3918 & 0.347798 \tabularnewline
49 & 0.026017 & 0.3797 & 0.352268 \tabularnewline
50 & -0.0036 & -0.0525 & 0.479075 \tabularnewline
51 & 0.020961 & 0.3059 & 0.379984 \tabularnewline
52 & 0.037156 & 0.5423 & 0.2941 \tabularnewline
53 & 0.000587 & 0.0086 & 0.496584 \tabularnewline
54 & -0.050942 & -0.7435 & 0.229005 \tabularnewline
55 & -0.018433 & -0.269 & 0.394085 \tabularnewline
56 & -0.017844 & -0.2604 & 0.397393 \tabularnewline
57 & -0.068138 & -0.9944 & 0.160567 \tabularnewline
58 & -0.018871 & -0.2754 & 0.391633 \tabularnewline
59 & -0.079611 & -1.1619 & 0.123292 \tabularnewline
60 & -0.010223 & -0.1492 & 0.440767 \tabularnewline
\hline
\end{tabular}
%Source: https://freestatistics.org/blog/index.php?pk=107940&T=2

[TABLE]
[ROW][C]Partial Autocorrelation Function[/C][/ROW]
[ROW][C]Time lag k[/C][C]PACF(k)[/C][C]T-STAT[/C][C]P-value[/C][/ROW]
[ROW][C]1[/C][C]-0.298927[/C][C]-4.3627[/C][C]1e-05[/C][/ROW]
[ROW][C]2[/C][C]-0.210121[/C][C]-3.0666[/C][C]0.001223[/C][/ROW]
[ROW][C]3[/C][C]-0.07487[/C][C]-1.0927[/C][C]0.137881[/C][/ROW]
[ROW][C]4[/C][C]0.020965[/C][C]0.306[/C][C]0.379963[/C][/ROW]
[ROW][C]5[/C][C]-0.051129[/C][C]-0.7462[/C][C]0.228186[/C][/ROW]
[ROW][C]6[/C][C]-0.032296[/C][C]-0.4713[/C][C]0.318938[/C][/ROW]
[ROW][C]7[/C][C]-0.03341[/C][C]-0.4876[/C][C]0.313165[/C][/ROW]
[ROW][C]8[/C][C]-0.008285[/C][C]-0.1209[/C][C]0.451934[/C][/ROW]
[ROW][C]9[/C][C]-0.049878[/C][C]-0.728[/C][C]0.233721[/C][/ROW]
[ROW][C]10[/C][C]0.039211[/C][C]0.5723[/C][C]0.283874[/C][/ROW]
[ROW][C]11[/C][C]0.129318[/C][C]1.8873[/C][C]0.030238[/C][/ROW]
[ROW][C]12[/C][C]-0.292815[/C][C]-4.2735[/C][C]1.5e-05[/C][/ROW]
[ROW][C]13[/C][C]-0.111442[/C][C]-1.6264[/C][C]0.052667[/C][/ROW]
[ROW][C]14[/C][C]-0.014296[/C][C]-0.2086[/C][C]0.417466[/C][/ROW]
[ROW][C]15[/C][C]0.016784[/C][C]0.2449[/C][C]0.403366[/C][/ROW]
[ROW][C]16[/C][C]-0.052294[/C][C]-0.7632[/C][C]0.223091[/C][/ROW]
[ROW][C]17[/C][C]-0.004699[/C][C]-0.0686[/C][C]0.472693[/C][/ROW]
[ROW][C]18[/C][C]0.024563[/C][C]0.3585[/C][C]0.360168[/C][/ROW]
[ROW][C]19[/C][C]0.05065[/C][C]0.7392[/C][C]0.230298[/C][/ROW]
[ROW][C]20[/C][C]-0.008929[/C][C]-0.1303[/C][C]0.448221[/C][/ROW]
[ROW][C]21[/C][C]0.031099[/C][C]0.4539[/C][C]0.325189[/C][/ROW]
[ROW][C]22[/C][C]-0.033697[/C][C]-0.4918[/C][C]0.311686[/C][/ROW]
[ROW][C]23[/C][C]0.034417[/C][C]0.5023[/C][C]0.307986[/C][/ROW]
[ROW][C]24[/C][C]-0.096497[/C][C]-1.4083[/C][C]0.080246[/C][/ROW]
[ROW][C]25[/C][C]-0.074768[/C][C]-1.0912[/C][C]0.138208[/C][/ROW]
[ROW][C]26[/C][C]0.015237[/C][C]0.2224[/C][C]0.412115[/C][/ROW]
[ROW][C]27[/C][C]0.043072[/C][C]0.6286[/C][C]0.265136[/C][/ROW]
[ROW][C]28[/C][C]-0.03877[/C][C]-0.5658[/C][C]0.286051[/C][/ROW]
[ROW][C]29[/C][C]-0.031961[/C][C]-0.4665[/C][C]0.320683[/C][/ROW]
[ROW][C]30[/C][C]-0.074041[/C][C]-1.0806[/C][C]0.140551[/C][/ROW]
[ROW][C]31[/C][C]-0.019916[/C][C]-0.2907[/C][C]0.385794[/C][/ROW]
[ROW][C]32[/C][C]-0.023842[/C][C]-0.348[/C][C]0.364104[/C][/ROW]
[ROW][C]33[/C][C]-0.079353[/C][C]-1.1581[/C][C]0.124056[/C][/ROW]
[ROW][C]34[/C][C]0.048322[/C][C]0.7052[/C][C]0.240715[/C][/ROW]
[ROW][C]35[/C][C]0.020454[/C][C]0.2985[/C][C]0.3828[/C][/ROW]
[ROW][C]36[/C][C]0.062262[/C][C]0.9087[/C][C]0.182271[/C][/ROW]
[ROW][C]37[/C][C]-0.086915[/C][C]-1.2685[/C][C]0.103005[/C][/ROW]
[ROW][C]38[/C][C]-0.103436[/C][C]-1.5096[/C][C]0.066314[/C][/ROW]
[ROW][C]39[/C][C]-0.019434[/C][C]-0.2836[/C][C]0.388484[/C][/ROW]
[ROW][C]40[/C][C]-0.030823[/C][C]-0.4499[/C][C]0.326638[/C][/ROW]
[ROW][C]41[/C][C]0.087079[/C][C]1.2709[/C][C]0.102578[/C][/ROW]
[ROW][C]42[/C][C]-0.029886[/C][C]-0.4362[/C][C]0.331578[/C][/ROW]
[ROW][C]43[/C][C]0.002232[/C][C]0.0326[/C][C]0.487024[/C][/ROW]
[ROW][C]44[/C][C]-0.050614[/C][C]-0.7387[/C][C]0.230455[/C][/ROW]
[ROW][C]45[/C][C]-0.015222[/C][C]-0.2222[/C][C]0.412203[/C][/ROW]
[ROW][C]46[/C][C]-0.069386[/C][C]-1.0127[/C][C]0.156187[/C][/ROW]
[ROW][C]47[/C][C]0.057325[/C][C]0.8366[/C][C]0.201867[/C][/ROW]
[ROW][C]48[/C][C]-0.026846[/C][C]-0.3918[/C][C]0.347798[/C][/ROW]
[ROW][C]49[/C][C]0.026017[/C][C]0.3797[/C][C]0.352268[/C][/ROW]
[ROW][C]50[/C][C]-0.0036[/C][C]-0.0525[/C][C]0.479075[/C][/ROW]
[ROW][C]51[/C][C]0.020961[/C][C]0.3059[/C][C]0.379984[/C][/ROW]
[ROW][C]52[/C][C]0.037156[/C][C]0.5423[/C][C]0.2941[/C][/ROW]
[ROW][C]53[/C][C]0.000587[/C][C]0.0086[/C][C]0.496584[/C][/ROW]
[ROW][C]54[/C][C]-0.050942[/C][C]-0.7435[/C][C]0.229005[/C][/ROW]
[ROW][C]55[/C][C]-0.018433[/C][C]-0.269[/C][C]0.394085[/C][/ROW]
[ROW][C]56[/C][C]-0.017844[/C][C]-0.2604[/C][C]0.397393[/C][/ROW]
[ROW][C]57[/C][C]-0.068138[/C][C]-0.9944[/C][C]0.160567[/C][/ROW]
[ROW][C]58[/C][C]-0.018871[/C][C]-0.2754[/C][C]0.391633[/C][/ROW]
[ROW][C]59[/C][C]-0.079611[/C][C]-1.1619[/C][C]0.123292[/C][/ROW]
[ROW][C]60[/C][C]-0.010223[/C][C]-0.1492[/C][C]0.440767[/C][/ROW]
[/TABLE]
Source: https://freestatistics.org/blog/index.php?pk=107940&T=2

Globally Unique Identifier (entire table): ba.freestatistics.org/blog/index.php?pk=107940&T=2

As an alternative you can also use a QR Code:  

The GUIDs for individual cells are displayed in the table below:

Partial Autocorrelation Function
Time lag kPACF(k)T-STATP-value
1-0.298927-4.36271e-05
2-0.210121-3.06660.001223
3-0.07487-1.09270.137881
40.0209650.3060.379963
5-0.051129-0.74620.228186
6-0.032296-0.47130.318938
7-0.03341-0.48760.313165
8-0.008285-0.12090.451934
9-0.049878-0.7280.233721
100.0392110.57230.283874
110.1293181.88730.030238
12-0.292815-4.27351.5e-05
13-0.111442-1.62640.052667
14-0.014296-0.20860.417466
150.0167840.24490.403366
16-0.052294-0.76320.223091
17-0.004699-0.06860.472693
180.0245630.35850.360168
190.050650.73920.230298
20-0.008929-0.13030.448221
210.0310990.45390.325189
22-0.033697-0.49180.311686
230.0344170.50230.307986
24-0.096497-1.40830.080246
25-0.074768-1.09120.138208
260.0152370.22240.412115
270.0430720.62860.265136
28-0.03877-0.56580.286051
29-0.031961-0.46650.320683
30-0.074041-1.08060.140551
31-0.019916-0.29070.385794
32-0.023842-0.3480.364104
33-0.079353-1.15810.124056
340.0483220.70520.240715
350.0204540.29850.3828
360.0622620.90870.182271
37-0.086915-1.26850.103005
38-0.103436-1.50960.066314
39-0.019434-0.28360.388484
40-0.030823-0.44990.326638
410.0870791.27090.102578
42-0.029886-0.43620.331578
430.0022320.03260.487024
44-0.050614-0.73870.230455
45-0.015222-0.22220.412203
46-0.069386-1.01270.156187
470.0573250.83660.201867
48-0.026846-0.39180.347798
490.0260170.37970.352268
50-0.0036-0.05250.479075
510.0209610.30590.379984
520.0371560.54230.2941
530.0005870.00860.496584
54-0.050942-0.74350.229005
55-0.018433-0.2690.394085
56-0.017844-0.26040.397393
57-0.068138-0.99440.160567
58-0.018871-0.27540.391633
59-0.079611-1.16190.123292
60-0.010223-0.14920.440767


Parameters (Session):
par1 = 60 ; par2 = 1 ; par3 = 1 ; par4 = 1 ; par5 = 12 ; par6 = White Noise ; par7 = 0.95 ;
Parameters (R input):
par1 = 60 ; par2 = 1 ; par3 = 1 ; par4 = 1 ; par5 = 12 ; par6 = White Noise ; par7 = 0.95 ;
R code (references can be found in the software module):
if (par1 == 'Default') {
par1 = 10*log10(length(x))
} else {
par1 <- as.numeric(par1)
}
par2 <- as.numeric(par2)
par3 <- as.numeric(par3)
par4 <- as.numeric(par4)
par5 <- as.numeric(par5)
if (par6 == 'White Noise') par6 <- 'white' else par6 <- 'ma'
par7 <- as.numeric(par7)
if (par2 == 0) {
x <- log(x)
} else {
x <- (x ^ par2 - 1) / par2
}
if (par3 > 0) x <- diff(x,lag=1,difference=par3)
if (par4 > 0) x <- diff(x,lag=par5,difference=par4)
bitmap(file='pic1.png')
racf <- acf(x, par1, main='Autocorrelation', xlab='time lag', ylab='ACF', ci.type=par6, ci=par7, sub=paste('(lambda=',par2,', d=',par3,', D=',par4,', CI=', par7, ', CI type=',par6,')',sep=''))
dev.off()
bitmap(file='pic2.png')
rpacf <- pacf(x,par1,main='Partial Autocorrelation',xlab='lags',ylab='PACF')
dev.off()
(myacf <- c(racf$acf))
(mypacf <- c(rpacf$acf))
lengthx <- length(x)
sqrtn <- sqrt(lengthx)
load(file='createtable')
a<-table.start()
a<-table.row.start(a)
a<-table.element(a,'Autocorrelation Function',4,TRUE)
a<-table.row.end(a)
a<-table.row.start(a)
a<-table.element(a,'Time lag k',header=TRUE)
a<-table.element(a,hyperlink('basics.htm','ACF(k)','click here for more information about the Autocorrelation Function'),header=TRUE)
a<-table.element(a,'T-STAT',header=TRUE)
a<-table.element(a,'P-value',header=TRUE)
a<-table.row.end(a)
for (i in 2:(par1+1)) {
a<-table.row.start(a)
a<-table.element(a,i-1,header=TRUE)
a<-table.element(a,round(myacf[i],6))
mytstat <- myacf[i]*sqrtn
a<-table.element(a,round(mytstat,4))
a<-table.element(a,round(1-pt(abs(mytstat),lengthx),6))
a<-table.row.end(a)
}
a<-table.end(a)
table.save(a,file='mytable.tab')
a<-table.start()
a<-table.row.start(a)
a<-table.element(a,'Partial Autocorrelation Function',4,TRUE)
a<-table.row.end(a)
a<-table.row.start(a)
a<-table.element(a,'Time lag k',header=TRUE)
a<-table.element(a,hyperlink('basics.htm','PACF(k)','click here for more information about the Partial Autocorrelation Function'),header=TRUE)
a<-table.element(a,'T-STAT',header=TRUE)
a<-table.element(a,'P-value',header=TRUE)
a<-table.row.end(a)
for (i in 1:par1) {
a<-table.row.start(a)
a<-table.element(a,i,header=TRUE)
a<-table.element(a,round(mypacf[i],6))
mytstat <- mypacf[i]*sqrtn
a<-table.element(a,round(mytstat,4))
a<-table.element(a,round(1-pt(abs(mytstat),lengthx),6))
a<-table.row.end(a)
}
a<-table.end(a)
table.save(a,file='mytable1.tab')